Ichimoku Green BG by Pranojit DeyThis indicator shows ichimoku bulliush trend background so that the option buyers can understand bullish trend easily.
Pesquisar nos scripts por "ichimoku"

Ichimoku Strict exit indicatorIndicator for ichimoku with exit
entry - when all cond meet
exit on base line

Ichimoku SentinelThis version of the Ichimoku Cloud features an alarm system helping you to catch entry and exit points and get warnings when you have to act to secure your profit.
Only relevant alerts will be triggered. For instance, if you're in a uptrend there will be alerts only when the Price crosses down Tenkan, not when crossing up.
Also, the frequent Tenkan-Kijun-Price-crossovers which occur when the price is hovering in the cloud will also not trigger alerts.
There is a warning alert when the price is approaching the cloud which is an early sign that the end of the trend is near.
You can define this warning distance to the cloud in the settings.
Conditions for long entry are the traditional triple:
- Price and Chikou-Sen above Cloud
- Chikou-Sen above Price
- Tenkan-Sen above Kijun-Sen
For Short Entries accordingly.
For Exit alerts you can chose between these options:
a) Price crosses Kijun (default)
b) Tenkan crosses Kijun
c) Price crosses Tenkan
Barcoloring : Green candles when above cloud (considered an uptrend), red when below (downtrend) and orange when within the warning distance from the cloud (consolidation)

Ichimoku Cloud OscillatorThe script looks at how far the price is below or above the ichimoku cloud, and publishes an oscillator.
Low or high oscillator values are indicative of reversals, to assist with long or short entry decisions.

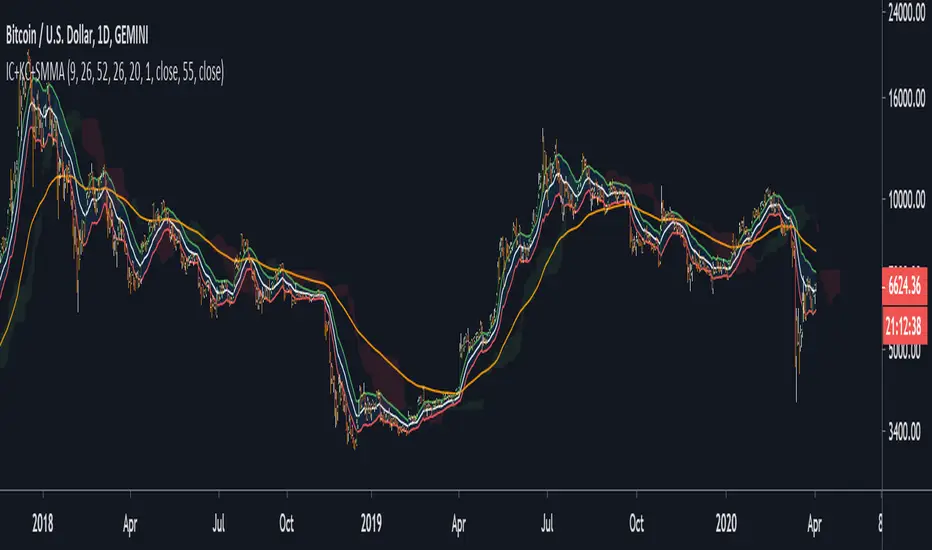
Ichimoku Cloud + keltner channel + SMMAa combo of
Ichimoku Cloud + keltner channel + SMMA
have fun, come up with your strategy
Ichimoku Cloud (for 1 hour period)Simple modification of standart Ichimoku Cloud indicator. Special for 1 hour period.
Ichimoku OverlaysHello!
Here is a script I wrote awhile ago. Basically the Ichmoku Overlays script takes the Ichimoku Cloud indicator and adds 4 timeframes to it.
Timeframes include multiples of 1, 3, 5, 10, 15. So basically if your interval timeframe is set to 1D you will see 1D, 3D, 5D, 10D, and 15D clouds. If you TF is set to 1m you will see 1m, 3m, 5m, 10m, 15m, etc.
The specific timeframe visibility can be set on/off in settings.
The purpose of this script is to show support/resistance zones in areas you might not see if you don't have the correct timeframe on.
Please feel free to PM me if you have any questions or suggestions!
Tips are welcome and can be sent to:
- BTC : 34dGv2EAxJ7HVpoAZHXg8RDKaX7KGCVUUW
- EOS : jwlondon1234
Enjoy!


Ichimoku Signal + Candle Color + Candle Pattern1. Ichimoku Signal:
Bullish Signal:
- UP-S: A strong bullish signal occurs when the Tenkan Sen crosses from below to above the Kijun Sen and the cross is above the Kumo.
- UP: An neutral bullish signal occurs when the Tenkan Sen crosses from below to above the Kijun Sen and the cross is in the Kumo.
- UP-W: A weak bullish signal occurs when the Tenkan Sen crosses from below to above the Kijun Sen and the cross is bellow the Kumo.
- Fly: A strong bullish signal when Chikou Span raise above the Kumo.
Bearish Signal:
- DN-S: A strong bearish signal occurs when the Tenkan Sen crosses from above to bellow the Kijun Sen and the cross is bellow the Kumo.
- DN: An neutral bearish signal occurs when the Tenkan Sen crosses from above to bellow the Kijun Sen and the cross is in the Kumo.
- DN-W: A weak bearish signal occurs when the Tenkan Sen crosses from above to bellow the Kijun Sen and the cross is above the Kumo.
- Dig: A strong bearish signal when Chikou Span fall bellow the Kumo.
2. Candle Color based on RSI (from NazcaProjections)
- Yellow represents Super OverBought
- Lime Green represents OverBought
- Green represents Slightly OverBought
- Red represents Slightly OverSold
- Dark Red represents OverSold
- Gray White represents Super OverSold
3. Candlestick Patterns Identified: Doji , Evening Star , Morning Star , Shooting Star , Hammer , Inverted Hammer , Bearish Harami, Bullish Harami, Bearish Engulfing , Bullish Engulfing


Ichimoku Cloud with Josh Olszewicz Crpyto Adjusted SettingsThis Ichimoku Cloud has the settings adjusted as described in Josh Olszewicz's Video here: www.youtube.com

Kijun-sen Colored [aamonkey]I isolated the Kijun-sen from the Ichimoku Cloud and colored it.
You can do major damage by just entering when the price closes above the Kijun-sen and sell when it is the other way around.
Add some other confirmation indicators to filter some false breakouts and you are good to go.

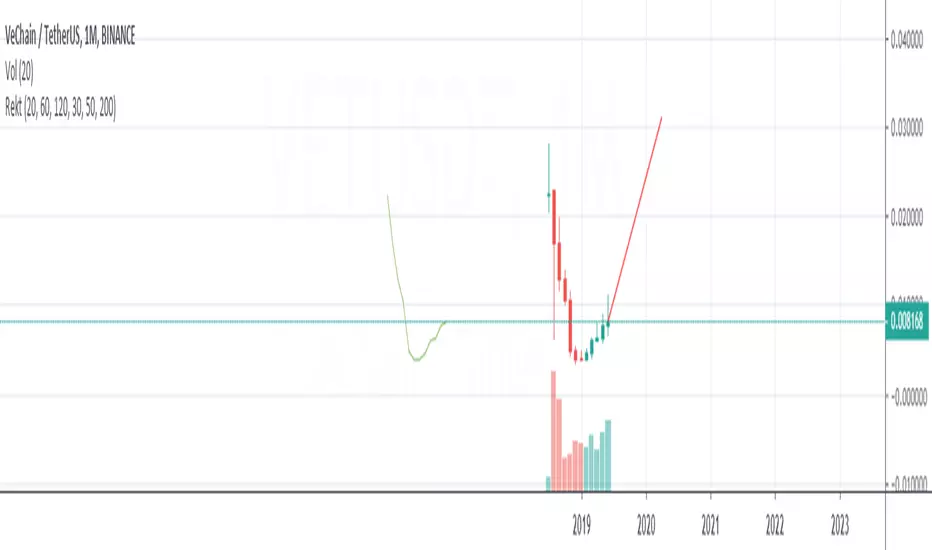
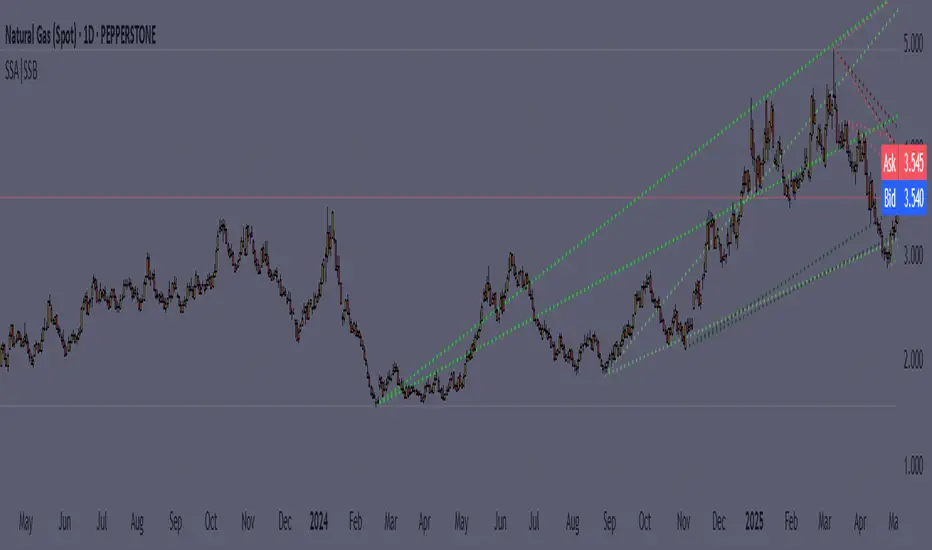
Dynamic Support|Resistance SSA & SSBHello, traders. I offer you an indicator to complement the Ichimoku Kinho Hyo trading system. This indicator determines possible dynamic resistance and support levels based on pivots and end points of the Senkou Span A and Senkou Span B lines.
You determine the pivots yourself, choosing how many bars back to look for HIGH and LOW.
Attention! Unlike the classical theory of Goichi Hosoda: the levels are dynamic, that is, they change values with each new bar!
Also added is the MTF function for displaying levels from different time frames.
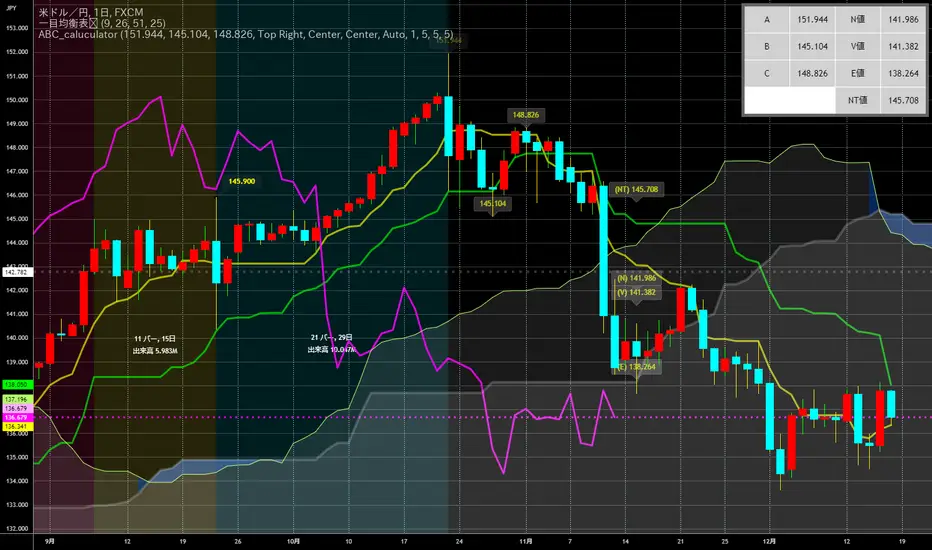
Goichi Hosoda TheoryGreetings to traders. I offer you an indicator for trading according to the Ichimoku Kinho Hyo trading system. This indicator determines possible time cycles of price reversal and expected asset price values based on the theory of waves and time cycles by Goichi Hosoda.
The indicator contains classic price levels N, V, E and NT, and is supplemented with intermediate levels V+E, V+N, N+NT and x2, x3, x4 for levels V and E, which are used in cases where the wave does not contain corrections and there is no possibility to update the impulse-corrective wave.
A function for counting bars from points A B and C has also been added.

SuperIchi [LuxAlgo]Using one indicator as the core for another one to improve certain aspects while offering an alternative user interaction can be very interesting in technical analysis.
This indicator is a modification of the popular Ichimoku indicator using the equally popular Supertrend indicator as its core, thus no longer entirely relying on calculations done over a fixed window size but instead relying on the average true range and the trend detection method offered by the Supertrend.
Settings
Tenkan: Atr length (left) and factor (right) used for the Supertrend involved in the calculations of the Tenkan Ichimoku component
Kijun: Atr length (left) and factor (right) used for the Supertrend involved in the calculations of the Kijun Ichimoku component
Senkou Span B: Atr length (left) and factor (right) used for the Supertrend involved in the calculations of the second Senkou Span Ichimoku component
Displacement: Bar offset of the cloud (positive offset) and Chikou (negative offset)
Usage
The SuperIchi indicator can be interpreted similarly to a regular Ichimoku as it retains the components and aspects from this one. Users can make use of the Supertrend Factor to detect shorter or longer-term trends.
Unlike the regular components of the Ichimoku based on rolling maximums/minimums, using the Supertrend here allows smoother components and makes it less prone to whipsaw signals.
Note that the Chikou is disabled by default in the style settings
Details
The original Ichimoku indicator is constructed from the average between the rolling maximum high and minimum low values. The Supertrend indicator also relies on one upper/lower extremity but using the average of these extremities for the modification of the Ichimoku indicator might not provide easy to use results due to the nature of these extremities.
Instead, we compute the average between the Supertrend and trailing maximums/minimums with a value reset when a new trend is detected by the Supertrend. This allows obtaining a result that is closer to the original average used by Ichimoku.

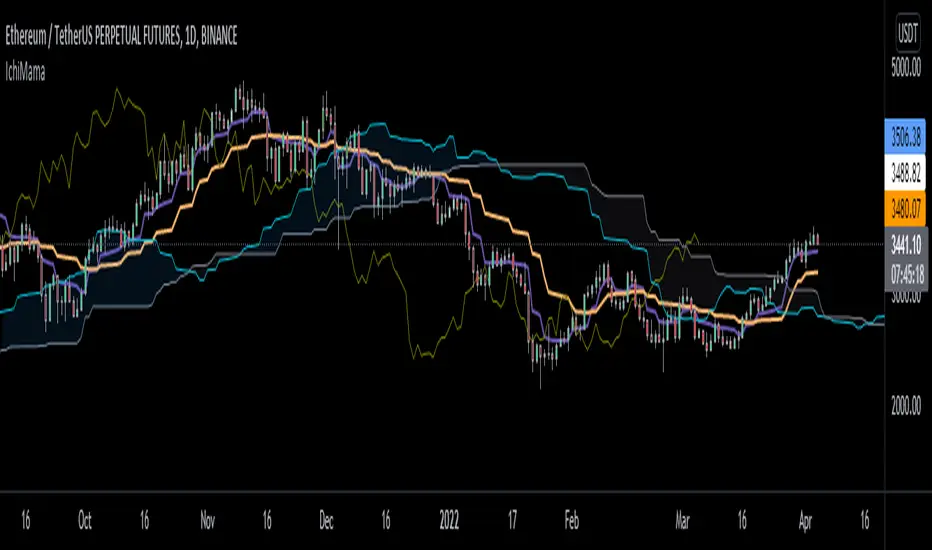
IchiMAMA (Experimental)Goichi Hosoda's "Ichimoku Kinkō Hyō" is a widely used Trend Following indicator and can be defined as a "system" rather than an indicator.
Published in the late 1960's, consisting of 5 lines.
TenkanSen (Conversion Line) = of the last 9 bars
KijunSen (Base Line) = of the last 26 bars
SenkouSpanA (Leading Span A) = Average of Tenkan&KijunSen shifted -> 26 bars
SenkouSpanB (Leading Span B) = of the last 52 bars
ChikouSpan (Lagging Span) = Price shifted <- 26 bars
On the other hand, Mesa Adaptive Moving Average developed by John Ehlers around early 2000's shows similarities with Hosoda's Tenkan and KijunSen using a different calculation method. For futher info: www.mesasoftware.com
I find MAMA superior to TenkanSen and KijunSen in terms of crossing signals.
Ichimoku:
Thus, decided to replace TenkanSen and KijunSen of regular Ichimoku with MAMA&FAMA of Ehlers and calculated SenkouSpanA accordingly. SenkouSpanB and ChikouSpan stays the same as per Ichimoku's logic. (Periods are 30 by default for cryptocurrencies. If stocks then 26)
IchiMAMA:
This is purely experimental and educational. Hope you'll like it :)
I'd like to thank @everget for MAMA&FAMA
and @KivancOzbilgic for Ichimoku Kinkō Hyō and Volume Based Colored Bars
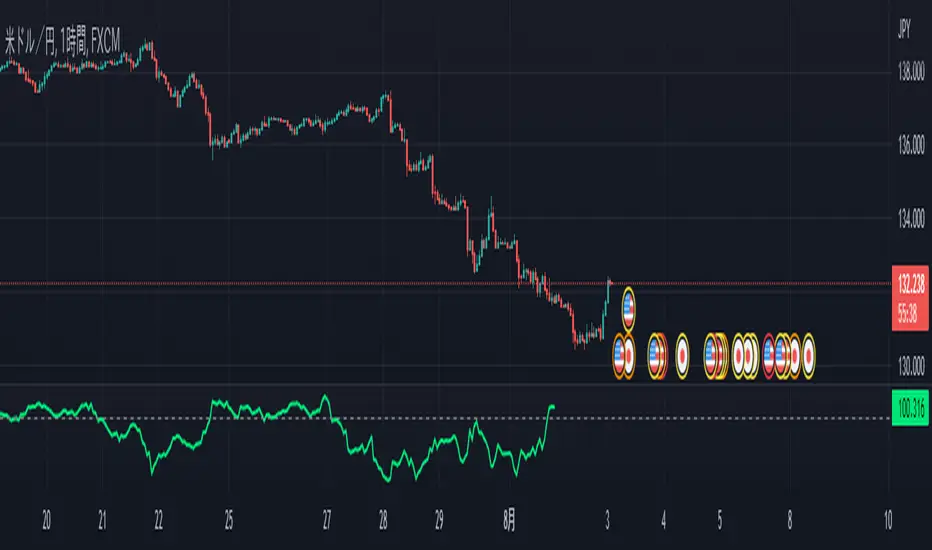
Chiko-Span Momentum_PineScript_Version5This is Momentum indicator based on "Chiko-span" of Ichimoku Kinko-Hyo.
Differ from normal momentum indicator, this indicator is using "close" and "open" as default parameter which is based on 9 week-candle chart Invented by Ichimoku-Sanjin. And, It is located 26 period before to match chiko-span.
(Parameters can change as you like)
The usage is same as normal momentum indicator so please check momentum indicator usage. However, due to use this indicator, it may support to compare momentum of chiko-span movement and to predict effect 5 lines of ichimoku.
For example, when price break out tenkan-sen, you can measure slope or period of chiko-span momentum and compare previously chiko-span momentum. If momentum is stronger than previously price, we can think that price try to out kijun- sen, touch cloud or break out cloud.
I wish, this indicator helps ichimoku users.
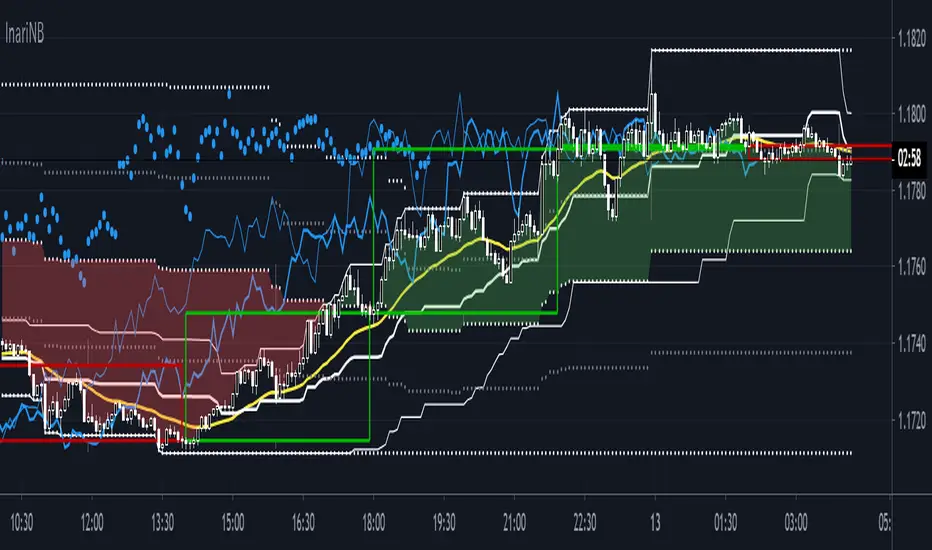
InariN BasicInariN is original work by N jijii.
I think InariN is modern interpretation of Ichimoku Cloud.
Please read script "InariN simple" for basic usage.
Multi time flame candles in this script is great work Candlestick Plot MTF by mortdiggiddy.
Supplementary explanation :
N jijii decided basic numbers as Ichimoku.
"I" first swing is 9. Only first swing is 9 because all numbers is consisted of nine numbers except start point 0 (his philosophy).
The second and subsequent is 8 because tangent point of previous swing is not counted (his philosophy).
"V" second swing is 9 + 8 = 17. "N" third swing is 9 + 8 + 8 = 25.
"N N = N2" is 25 +24 = 49. "N4" is 97. "N9"is 217.
He used basic numbers for parameters.
I think his idea is unique but the important point is this basic numbers are about popular numbers traders usually use and we can use as the same.
N2 and N9 spans is slightly difficult to use (Ichimoku lagging span).
Basically N span is used to measure Time Retracement and momentum.
If you want to practice Time Retracement , please check script "Ichimoku Time Retracement".
Enjoy!!
MTF Ichimoku CloudI published it because I could not find a good MTF glance.
なかなか良いMTF一目が見つからないので公開しました。

ABC_caluculator for Ichimoku Kinko Hyo(IKH) usersThis tool is using for calculating Target Value(N,V,E prices) by only clicking on a chart.
There is several points which makes it better.
Decrease the number of times of clicking.
Calculator needs a reset button, it's like loop structure. Push the reset and function again.
Plot percentages which it compare closing price and Target Value(N,V,E prices) on a chart.
Plot loss cut points from evaluating risk/returns.
My question is also written down precisely here !!!!!
↓
stackoverflow.com