Rage of UltronRage of Ultron - Multi-Timeframe Smart Money Trading System
Advanced Confluence-Based Trading Indicator
Rage of Ultron is a comprehensive multi-timeframe trading system that combines Smart Money Concepts (SMC) with macro market context, RSI divergences, liquidity sweeps, and volume analysis to identify high-probability setups across all markets.
Key Features
Multi-Timeframe Alignment
* Weekly Bias - Directional trend context
* Daily Structure - Order Blocks and Fair Value Gaps
* 4H Confirmation - Entry timing and execution
* Real-time MTF alignment scoring (🟢 Bull Aligned / 🔴 Bear Aligned / 🟡 Mixed)
Smart Money Concepts
* Order Blocks (OB) - Institutional entry zones with visual clarity
* Fair Value Gaps (FVG) - Price imbalances and retracement magnets
* Change of Character (CHoCH) - Market structure breaks (▲▼)
* Liquidity Sweeps - Stop hunt detection before reversals (💧)
Technical Analysis
* RSI Divergences - Regular and hidden divergences with zones (◆)
* RSI Swing Failure Patterns - Grade-A reversal setups (★)
* Automatic Fibonacci - Dynamic retracements and extensions
* Volume Impulse Detection - Weighted confirmation signals
Macro Market Radar
* DXY - Dollar strength assessment
* BTC Dominance - Crypto market risk gauge
* USDT Dominance - Stablecoin flow analysis
* Combined risk environment scoring
Confluence Scoring System (0-7)
Quantified setup quality with three alert tiers:
* Tier 1 (Score 6-7): Full confluence + sweep + volume + MTF alignment
* Tier 2 (Score 5): High confluence + volume or sweep
* Tier 3 (Score 4): Standard confluence setups
"Rage" Volume State
* 🟢 RAGE PULSE - Explosive volume spike (score 6+ trigger)
* ⚡ Active - Strong volume with good confluence
* 🟡 Stable - Moderate volume conditions
* 🔴 Dormant - Low volume, wait for confirmation
Visual Design
* Clean Zone Rendering - Persistent OB/FVG boxes with limited extension
* Signal Bar Highlighting - Colored fills and contrasting borders for instant recognition
* Dynamic Symbol Placement - ATR-based offset prevents overlap
* Comprehensive Panel - Real-time macro + trade metrics in one view
* Toggleable Legend - Learn signals, hide once familiar
How to Use
1. Set Your Timeframes - Default 1W/1D/4H works for swing trading
2. Monitor Macro Environment - Check risk-on/off context
3. Wait for Confluence ≥4 - Let multiple signals align
4. Enter on Tier 1/2 Alerts - Best probability setups
5. Use Fib Extensions for Targets - Systematic profit taking
Customizable Settings
* Multi-timeframe periods
* RSI length and divergence sensitivity
* Liquidity sweep parameters
* Fibonacci swing lookback
* Volume thresholds
* Shape offset multiplier
* Visual toggles (Fibs, extensions, legend)
Built-in Alert System
Three-tier alert structure lets you filter by setup quality. Set alerts for Tier 1 only for highest conviction trades, or include Tier 2 for more opportunities.
Best Practices
* Use on clean timeframes - 1H+ for less noise
* Combine with support/resistance - Zones near key levels = highest probability
* Respect the macro - Don't fight extreme risk-off environments
* Wait for the full stack - Best trades have 4+ aligned signals
* Practice on demo first - Learn signal behavior in your market
Works On
* Cryptocurrency (spot & futures)
* Forex pairs
* Stock indices
* Individual stocks
* Commodities
Note: This indicator identifies potential setups but does not guarantee profits. Always use proper risk management, position sizing, and stops. Past performance does not predict future results.
Created by cdotgnz | For educational purposes
Pesquisar nos scripts por "fvg"

Candle PA Scanner (Engulfing / Inside / Pin) by BK SahniHere’s how to read the “Candle PA Scanner (Engulfing / Inside / Pin)” and what each input means.
What the signals look like on your chart
B-ENG (label above/below bar)
Bullish Engulfing → “B-ENG” below the bar (green/teal).
Bearish Engulfing → “B-ENG” above the bar (red).
IB (small orange dot at the top)
Inside Bar (compression). Use the mother bar’s high/low for the break.
PIN (triangle)
Bullish Pin → triangle below the bar (long lower wick; rejection of support).
Bearish Pin → triangle above the bar (long upper wick; rejection of resistance).
Treat these as price-action alerts, not automatic buy/sell signals. Act only when they occur at your levels (VWAP band, Fib 38.2–61.8, PDH/PDL, OB/FVG, etc.).
How to trade the prints (quick rules)
A) Bullish Engulfing at support
Context: at VWAP/VAL/0.5–0.618 Fib.
Entry: next candle above the engulfing high (or market order on close if volume/momentum confirm).
Stop: a tick below the engulfing low (or below the level).
Targets: mid/range, VWAP, prior swing; trail with Chandelier/ATR if trend extends.
B) Bearish Engulfing at resistance
Mirror the above: trigger below the engulfing low; stop above its high.
C) Inside Bar
It’s compression. Mark the mother bar’s high/low.
Trade the breakout in the direction of bias (above VWAP for longs, below for shorts).
If the break fails (closes back inside), often sets up a reversal—manage fast.
D) Pin Bar (rejection)
Enter on break of the pin’s body in the direction away from the wick.
Stop beyond the wick tip (invalidated if wick gets closed through).
Scale at VWAP/mid or the opposite range edge.
What the Inputs do (the panel you showed)
Inside Bar lookback (default 1)
How many bars back can be the mother bar.
Keep 1 for strict IB; raise to 2–3 to catch nested/compression patterns (more signals, a bit noisier).
Pin wick:body min ratio (default 2)
How long the rejection wick must be compared to the body.
Higher (2.5–3.0) = pickier, great in chop.
Lower (1.5–1.8) = more pins, useful in strong trends where wicks are shorter.
Min body % of range (0–1) (default 0.25)
Filters out dojis. The body must be at least 25% of the bar’s high-low range.
If you want to allow slimmer bodies (more pins/dojis), drop to 0.15–0.20.
If you want only decisive bodies, raise to 0.30–0.35.
Suggested tuning by market state
Trending / high momentum:
IB lookback 1, Pin ratio 1.8–2.2, Min body 0.20–0.25 (to catch more continuation entries).
Ranging / choppy:
IB lookback 2, Pin ratio 2.5–3.0, Min body 0.30 (fewer, higher-quality reversals).
A simple confluence checklist (use before clicking)
Signal printed at a level (VWAP band, Fib, PDH/PDL, OB/FVG)?
Bias aligned (above VWAP for longs, below for shorts) or you’re intentionally fading a range edge?
For engulfing: did it close through nearby minor structure?
For IB: are you trading the mother bar break, not just the small inside candle?
Risk defined: stop beyond wick/zone, target mapped (mid/VWAP/swing/extension).
Common pitfalls
Taking signals mid-range (low R:R).
Treating an IB as a reversal without a break/shift.
Buying a bullish pin that closed below your level (no acceptance).
Ignoring volatility—during news spikes, patterns fail more often.

无敌大饺子缺口Indicator Name:Dumpling Price Action Gaps (Price Action Gaps)
Type: Price Action Indicator / Technical Analysis Tool
Applicable Markets: Stocks, Futures, Forex, Cryptocurrencies, and other charting markets
Timeframe: Any timeframe; supports multi-timeframe EMA smoothing
Indicator Overview
This indicator is a visual analysis tool based on Price Action and Fair Value Gaps (FVGs). It automatically identifies bullish and bearish gaps in the market, helping traders spot potential support and resistance areas, gap fill opportunities, and market sentiment turning points.
By combining EMA (Exponential Moving Average) and ATR (Average True Range) filtering, the indicator clearly plots on the chart:
Bullish Gaps: Highlight rapid upward price gaps.
Bearish Gaps: Highlight rapid downward price gaps.
Mitigation Zones: Mark areas where gaps are likely to be filled, assisting in judging potential price retracements.
Historical Gaps: Optionally display past gaps for multi-timeframe analysis.
Smoothed EMA20: Provides both current and multi-timeframe trend references to make gap analysis more reliable.
Key Features
Intelligent Gap Detection: Automatically identifies gap types by comparing the high and low of the current bar with the previous two bars.
Fair Value Filtering: Uses ATR to filter out insignificant gaps, reducing noise.
Visual Gap Fill Percentage: Displays the percentage of gap fill, helping traders gauge the strength of retracement.
Multi-Timeframe Smoothing: Supports current and 5-minute smoothed EMA to capture short-term trend impacts.
Flexible Across Timeframes: Suitable for intraday or swing trading strategies.
Use Cases
Support/Resistance Identification: Gap tops and bottoms can act as potential support or resistance levels.
Trend Continuation Confirmation: If price breaks through a gap without filling it, the trend is likely to continue.
Retracement Strategy: Gap fill zones can serve as potential entry or exit points for short-term trades.
Risk Management: Historical gaps help identify high-risk zones, optimizing stop-loss placement.
中文:
指标介绍
指标名称:无敌大饺子价格行为缺口(Dumpling Price Action Gaps)
类型:价格行为指标 / 技术分析工具
适用市场:股票、期货、外汇、加密货币等各类K线图市场
周期适用:任意时间周期,指标支持跨周期 EMA 平滑显示
功能概述
是一种基于价格行为(Price Action)和公允价值缺口(Fair Value Gap, FVG)的可视化分析工具。它通过自动识别市场中的看涨和看跌缺口,帮助交易者发现潜在的支撑与阻力区域、回补机会以及市场情绪转折点。
该指标结合了 EMA(指数移动平均)和 ATR(平均真实波幅)过滤,能够在图表上清晰绘制出:
看涨缺口(Bullish Gap):显示市场快速上涨形成的价格缺口。
看跌缺口(Bearish Gap):显示市场快速下跌形成的价格缺口。
回补区域(Mitigation Zone):标记缺口可能被回补的区域,辅助判断价格回调的概率。
历史缺口(Historical Gaps):可选择显示历史上形成的缺口,便于进行多周期分析。
平滑 EMA20(Smoothed EMA20):提供当前周期和跨周期的趋势参考,使缺口分析更加可靠。
核心特点
智能缺口识别:通过比较当前 K 线与前两根 K 线的高低价,自动判断缺口类型。
公允价值过滤:结合 ATR 值过滤掉微小缺口,避免噪音干扰。
可视化百分比显示:支持显示缺口回补的百分比,让交易者直观判断回补强弱。
跨周期平滑:可显示当前周期和平滑 5 分钟 EMA,帮助捕捉短期趋势与缺口冲击。
多周期适用:支持不同时间周期图表,可灵活应用于日内交易或波段策略。
使用场景
支撑/阻力判断:缺口上沿和下沿可以作为潜在支撑或阻力区域。
趋势延续确认:价格突破缺口并未回补时,表明趋势可能继续延续。
回调策略:当价格回补缺口至回补区域时,可作为短线交易的进出参考。
风险管理:历史缺口帮助交易者识别潜在高风险区域,优化止损设置。

Quantum Leap by GSK-Vizag-AP-IndiaQuantum Leap by GSK-Vizag-AP-India
This indicator detects strong impulse price movements, also known as "quantum leaps," in bullish and bearish directions. Using the Average True Range (ATR) to measure market volatility, it identifies candles with body sizes significantly larger than recent average ranges, suggesting strong momentum surges.
The script groups consecutive impulse candles into blocks, highlighting zones of sustained bullish or bearish strength on the chart. These visual blocks aid traders in quickly spotting powerful price moves that may indicate key market shifts or reversals. Additionally, this tool can be effectively used to identify Fair Value Gaps (FVG) in price action, making FVG detection easier and more intuitive for users.
Inputs allow customization for ATR length, impulse strength threshold, and minimum consecutive candles, enabling adaptation to different markets or timeframes.
Important Disclaimer:
This indicator is for educational and informational purposes only. It is not financial advice and does not guarantee future results. Users should conduct their own research and seek professional guidance before making any trading decisions. Trading involves risk, including the potential loss of capital.
FU Candle Detector (Smart Money Concept) En Anglais🧠 Overall concept: “FU Candle” in Smart Money logic
In the context of Smart Money Concepts (SMC) or ICT (Inner Circle Trader), an FU Candle (also known as a “Fakeout Candle” or “Manipulation Candle”) is a candle that:
Creates an imbalance or a break (often above a swing high or below a swing low),
Attracts liquidity by trapping retail traders (liquidity grab),
Then abruptly reverses direction, revealing the hand of “Smart Money” (large institutions).
It therefore often marks:
The point of manipulation before an impulsive movement (reversal),
An area of interest for entering in the institutional direction (after the liquidity grab).
---
⚙️ How the “FU Candle Detector” script works
The script identifies these candlesticks by observing several typical criteria:
1. Detection of the manipulative candle (FU Candle)
Search for a candlestick that breaks a previous swing (significant high or low),
But closes in the opposite direction, often below/above the broken zone,
Thus indicating a fakeout.
Examples:
Bullish FU Candle: breaks a previous low, but closes bullish.
Bearish FU Candle: breaks a previous high, but closes bearish.
---
2. Visualization on the chart
The script generally displays:
🔴 Red markers for bearish FUs (Fake Breakout upwards),
🟢 Green markers for bullish FUs (Fake Breakout downwards),
🟦 Rectangles of areas of interest (often around the FU Candle Open),
📏 Horizontal lines on areas of imbalance (OB/FVG if integrated).
---
3. Possible additions depending on the version
Depending on the version you have received, the script can also:
Detect Fair Value Gaps (FVG) around FU Candles,
Mark Order Blocks (OB) associated with manipulation,
Add alerts when new FU Candles are detected,
Calculate the distance between the manipulation point and the price return,
Filter according to candle size, volume, or market structure (MSB/CHoCH).
---
🎯 Practical use
FU Candles are often used:
As confirmation of an imminent reversal,
To identify institutional entry zones (hidden Order Block),
To anticipate the direction of the next impulse after the liquidity hunt.
Typical entry example:
> Wait for the formation of an FU Candle + price return within the candle body = entry in the opposite direction to the false breakout.
📈 Recommended combinations
This detector is often combined with:
Structure Break Indicator (CHoCH / BOS)
Liquidity Pool Zones
Fair Value Gap Finder
Order Block Detector
This gives you a complete Smart Money Concept system, capable of mapping:
1. Where liquidity has been taken,
2. Where the price is rebalancing,
3. Where Smart Money is repositioning its orders.

BATIK SMC🌀 BATIK SMC — Smart Money Concepts by YB Pips
BATIK SMC is a professional-grade Smart Money Concepts system refined under the Batik Syndicate methodology.
It combines institutional structure logic with precision-engineered visualization tools for traders who operate with discipline and intent.
🧭 Core Functions
Market Structure: automatic detection of BOS (Break of Structure) & CHoCH (Change of Character)
Order Blocks: internal & swing OB identification with real-time mitigation updates
Fair Value Gaps (FVG): dynamic detection across multiple timeframes
Equal Highs / Lows: liquidity points & sweep detection
Premium / Discount Zones: clear equilibrium mapping for high-RR setups
Smart Candle Coloring: visualize real-time trend bias directly on chart
Custom Alerts: receive instant BOS, CHoCH, OB breakout, and FVG notifications
💎 Why BATIK SMC
Developed for traders who follow structure, liquidity, and imbalance — not indicators.
It retains full Smart Money logic while carrying the signature Batik visual identity and philosophy:
“Trade where institutions position themselves — not where the crowd reacts.”

ICT SMART MONEY__Advanced Multi-Timeframe Target TREND indicator with comprehensive ICT (Inner Circle Trader) concepts, session analysis, and smart money concepts for professional forex and crypto trading.__
---
### __🔥 Core Features:__
#### __📈 Multi-Timeframe Analysis__
- __7 Timeframe Table__: 1min, 5min, 15min, 30min, 1hour, 4hour, Daily analysis
- __Target System__: Stop Loss, Entry, TP1, TP2, TP3 calculations for each timeframe
- __Trend Direction__: Visual arrows showing bullish/bearish bias across all timeframes
#### __⚡ ICT Killzone Sessions__
- __4 Major Sessions__: Asia KZ, London KZ, NY AM, NY PM with colored session boxes
- __Pivot Lines__: Automatic high/low detection with full format labels ("ASIA High", "LONDON Low")
- __Global Label Alignment__: All session labels perfectly aligned for professional appearance
- __Range Analytics__: Real-time pip calculations with historical averages and Turkish volatility analysis
#### __🌍 Trading Session Management__
- __Individual Controls__: Asia/London sessions auto-enabled, NY sessions optional
- __Horizontal Lines__: Clean session high/low tracking without clutter
- __NY Lunch Session__: Additional 11:30-13:30 session for advanced analysis
- __Session Transparency__: Adjustable transparency levels for optimal chart visibility
#### __📍 Professional Key Levels__
- __Monday High/Low__: Weekly opening reference levels
- __Previous Day High/Low__: Daily support/resistance zones
- __Previous Week High/Low__: Major weekly levels
- __Full Format Labels__: "Previous Day High" instead of "PDH" for crystal clarity
- __160 Bar Distance__: Optimized label positioning for clean charts
#### __🔗 Liquidity Trendlines__
- __Automatic Detection__: 8-bar lookback pivot detection system
- __Breakout Signals__: Visual alerts when trendlines are broken
- __Dynamic Padding__: 4.0 ATR-based trendline spacing
- __Bullish/Bearish Colors__: Clear color coding for trend direction
#### __💎 Smart Money Concepts (SMC)__
- __Fair Value Gaps (FVG)__: Automatic gap detection with mitigation tracking
- __Structure Analysis__: BOS (Break of Structure) and CHoCH (Change of Character) detection
- __Structure Fibonacci__: 5-level fibonacci retracements (78.6%, 70.5%, 61.8%, 50%, 38.2%)
- __Lifecycle Management__: Complete FVG and structure history tracking
#### __📊 Range Analytics Table__
- __Session Volatility__: Current pip movement vs historical averages
- __Turkish Analysis__: "Güçlü Momentum", "Yüksek Aktivite", "Normal Aktivite", "Düşük Hareket", "Zayıf Session"
- __Integrated Display__: Seamlessly positioned below multi-timeframe table
- __Professional Formatting__: Color-coded session identification with status analysis

Trader Jumblo Indicator Zone V6Trader Jumblo Zone (v6) displays automatically detected price zones based on recent candle structures and optional fair value gaps (FVGs).
It visually marks potential supply and demand regions and updates their state as price evolves.
Zones extend forward on the chart for context, with optional labels and transparency adjustments once they are interacted with.
The indicator highlights when price comes near or moves significantly away from a fresh zone.
It can generate alerts for both proximity (“approaching”) and momentum (“running”) conditions, measured relative to ATR.
This version is written in Pine Script v6 and includes safety and stability improvements for array handling, box/label management, and pruning logic.
It maintains visual clarity even with many active zones and prevents runtime errors that may occur in earlier versions.
🧩 Main features
Detects structural candle-based zones and optional FVG zones.
Distinguishes between fresh and touched zones.
Extends zones forward with adjustable length and transparency.
Optional labels with high/low information.
Visual markers for “Standby” and “Running” conditions.
Alert conditions for proximity and strong movement.
Watermark option for visual identification.
Safe and optimized handling of arrays, boxes, and labels.
⚙️ Inputs overview
Zone lookback and maximum zone count.
Minimum zone height (in ticks).
Zone extension length.
Colors for fresh supply/demand zones and transparency for touched ones.
ATR parameters for proximity and movement detection.
Toggle for Fair Value Gap zones and labels.
Watermark customization.
🛠️ Version notes
Improved internal safety: prevents errors when deleting or modifying boxes/labels.
Pruning logic refined to consistently maintain the set zone limit.
Simplified and cleaner running-distance calculations.
No changes to the detection logic or visual structure.
📢 Alerts
Approaching Fresh Zone – triggered when price nears a fresh zone.
Price Running – triggered when price moves strongly away from a zone.

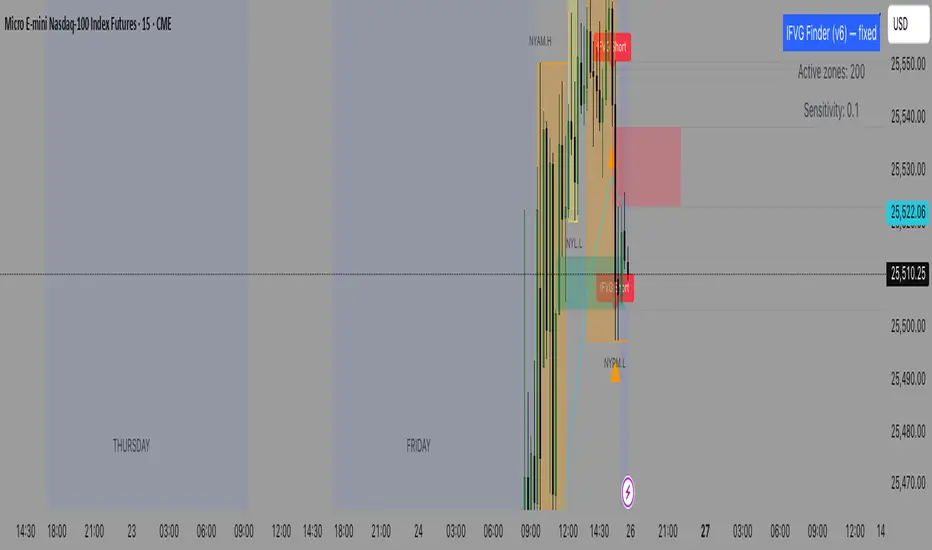
IFVG (Inverted Fair Value Gap) Finder Detects standard Fair Value Gaps (3-candle definition) on any timeframe.
Tracks those FVG zones on the chart.
Marks Inverted Fair Value Gaps (IFVGs) when price breaches (invalidates) an FVG and later retests it from the other side.
Draws the zones and plots clear entry arrows when a retest is detected (so you can use them to enter trades).
Has alertconditions you can enable for automated alerts.
DAMMU AUTOMATICAL AI ENRTY AND TARGET AND EXITMain Components
Supertrend System –
Detects market trend direction (Buy/Sell zones).
→ Green = Uptrend (Buy)
→ Red = Downtrend (Sell)
SMA Filter –
Uses 50 & 200 moving averages to confirm overall trend.
→ Price above both → Bullish
→ Price below both → Bearish
Buy/Sell Signals –
Generated when Supertrend flips direction and SMA confirms.
→ Triangle up = Buy
→ Triangle down = Sell
Take Profit / Stop Loss Levels –
Automatically calculated after Buy/Sell entry.
→ TP1, TP2, SL shown on chart
ADX (Sideways Zone Filter) –
If ADX < 25 → Market sideways → Avoid trades
Shows “No Trade Zone” area
Smart Money Concepts (SMC) Tools –
🔹 Market structure (HH, HL, LH, LL)
🔹 Order blocks (OB)
🔹 Equal highs/lows
🔹 Fair Value Gaps (FVG)
🔹 Premium & Discount zones
Helps find institutional entry points
Visual Display –
Color-coded background (trend zones)
Labels for buy/sell/structure
Optional FVG and order block boxes
Risk Management –
Input-based position sizing, SL & TP management
(to calculate profit levels and minimize loss)

ICT Liquidity Sweep Asia/London 1 Trade per High & Low🧠 ICT Liquidity Sweep Asia/London — 1 Trade per High & Low
This strategy is inspired by the ICT (Inner Circle Trader) concepts of liquidity sweeps and market structure, focusing on the Asia and London sessions.
It automatically identifies liquidity grabs (sweeps) above or below key session highs/lows and enters trades with a fixed risk/reward ratio (RR).
----------------------------------------------------------------------------------
----------------------------------------------------------------------------------
⚙️ Core Logic
-Asia Session: 8:00 PM – 11:59 PM (New York time)
-London Session: 2:00 AM – 5:00 AM (New York time)
-The script marks the Asia High/Low and London High/Low ranges for each day.
-When the market sweeps above a session high → potential Short setup
-When the market sweeps below a session low → potential Long setup
-A trade is triggered when the confirmation candle closes in the opposite direction of the sweep (bearish after a high sweep, bullish after a low sweep).
-Only one trade per sweep type (1 per High, 1 per Low) is allowed per session.
----------------------------------------------------------------------------------
----------------------------------------------------------------------------------
📈 Risk Management
-Configurable Risk/Reward Target (default = 2:1)
-Configurable Position Size (number of contracts)
-Each trade uses a fixed Stop Loss (beyond the wick of the sweep) and a Take Profit calculated from the RR setting.
-All trades are automatically logged in the Strategy Tester with performance metrics.
----------------------------------------------------------------------------------
----------------------------------------------------------------------------------
💡 Features
✅ Visual session highlighting (Asia = Aqua, London = Orange)
✅ Automatic liquidity line plotting (session highs/lows)
✅ Entry & exit labels (optional visual display)
✅ Customizable RR and contract size
✅ Works on any instrument (ideal for indices, futures, or forex)
✅ Compatible with all timeframes (optimized for 1M–15M)
----------------------------------------------------------------------------------
----------------------------------------------------------------------------------
⚠️ Notes
-Best used on New York time-based charts.
-Designed for educational and backtesting purposes — not financial advice.
-Use as a foundation for further optimization (e.g., SMT confirmation, FVG filter, or time-based restrictions).
----------------------------------------------------------------------------------
----------------------------------------------------------------------------------
🧩 Recommended Use
Pair this with:
-ICT’s concepts like CISD (Change in State of Delivery) and FVGs (Fair Value Gaps)
-Higher timeframe liquidity maps
-Session bias or daily narrative filters
----------------------------------------------------------------------------------
----------------------------------------------------------------------------------
Author: jygirouard
Strategy Version: 1.3
Type: ICT Liquidity Sweep Automation
Timezone: America/New_York

Swing Points LiquiditySwing Points Liquidity
Unlock advanced swing detection and liquidity zone marking for smarter trading decisions.
Overview:
Swing Points Liquidity automatically identifies key swing highs and swing lows using a five-candle “palm” structure, marking each significant price turn with precise labels: “BSL swing high” for potential bearish liquidity and “SSL swing low” for potential bullish liquidity. This transparent swing logic provides a robust way to highlight areas where price is most likely to react—making it an invaluable tool for traders applying Smart Money Concepts, supply and demand, or liquidity-based strategies.
How It Works:
The indicator scans every candle on your chart to detect and label swing highs and lows.
A swing high (“BSL swing high”) is identified when a central candle’s high is greater than the highs of the previous two and next two candles.
A swing low (“SSL swing low”) is identified when a central candle’s low is lower than the lows of the previous two and next two candles.
Labels are plotted for every detected swing point, providing clear visualization of important market liquidity levels on any symbol and timeframe.
How to Use:
Liquidity levels marked by the indicator are potential price reversal zones. To optimize your entries, combine these levels with confirmation signals such as reversal candlestick patterns, order blocks, or fair value gaps (FVGs).
When you see a “BSL swing high” or “SSL swing low” label, observe the price action at that area—if a reliable reversal pattern or order block/FVG forms, it can signal a high-probability trade opportunity.
These marked liquidity swings are also excellent for locating confluence zones, setting stop losses, and identifying where institutional activity or smart money may trigger significant moves. Always use market structure and price action in conjunction with these levels for greater consistency and confidence in your trading.
Features:
Customizable label display for swing highs (BSL) and swing lows (SSL)
Automatic detection using robust 5-candle palm logic
Works with all symbols and chart timeframes
Lightweight, clear visual style—easy for manual and algorithmic traders
Notes:
The indicator requires at least two candles both before and after each swing point, so labels will start appearing after enough historical data is loaded.
For deeper historical analysis, simply scroll left or zoom out on your chart to load more candles—the indicator will automatically process and display swing points on all available data.

Dammu AI ADVANCED PRO1. Indicator Overview
Name: Dammu
Type: Overlay indicator (draws on price chart)
Purpose: Combines SuperTrend, SMA/EMA trends, Swing/Structure analysis, Order Blocks, Fair Value Gaps, High/Low levels, TP/SL labels, and alerts.
Pine Script Version: v5
2. SuperTrend Module
Computes SuperTrend line using ATR and sensitivity.
Signals:
Bullish: Price crosses above SuperTrend.
Bearish: Price crosses below SuperTrend.
Plots buy/sell labels 🚀🐻 based on SMA comparison and SuperTrend cross.
3. SMA/EMA Trend Components
SMA8 & SMA9: Used for additional trend confirmation.
EMA lines: Multiple EMAs with different multipliers for trend detection.
Trend Cloud: Uses Hull MA for trend smoothing.
4. Risk Management
TP/SL Levels: Automatic calculation of stop-loss and take-profit (TP1, TP2, TP3).
Configurable ATR-based risk percentage.
Lines and labels drawn for visual TP/SL.
5. Chart Features
Smooth Range Filter: Filters noise for trend detection.
Colored Trend Cloud: Upward trend = cyan, downward = red.
Sideways Market: ADX filter to color bars purple if trend is weak/sideways.
Bar Colors: Green/red based on SuperTrend signals.
6. Swing & Structure Analysis
Detects Swing Highs/Lows, labels as HH, LH, LL, HL.
Detects CHoCH (Change of Character) or BOS (Break of Structure).
Can show internal or swing structures with configurable label size and color.
7. Order Blocks (Smart Money Concepts)
Detects Internal Order Blocks (iOB) and Swing Order Blocks (OB).
Stores top/bottom/left/time/type in arrays.
Colors and shows boxes based on bullish/bearish type.
Automatically deletes OB if price breaks the block.
8. Fair Value Gaps (FVG)
Identifies gaps between candles as potential trading zones.
Configurable bullish/bearish colors and extension bars.
9. EQH/EQL (Equal Highs/Lows)
Detects equal highs/lows using a threshold.
Plots dotted lines and labels EQH/EQL.
10. High/Low Levels MTF
Optional plotting of previous daily, weekly, monthly highs/lows.
11. Premium/Discount Zones
Plots Premium, Discount, and Equilibrium Zones.
Colors: Premium = red, Discount = green, Equilibrium = gray.
12. Alerts
Buy/Sell alerts for:
SuperTrend crossover
BOS/CHoCH (swing/internal)
EQH/EQL triggers
13. Miscellaneous
Configurable visuals: line style, label size, transparency.
Adjustable volatility filters, ATR lengths, smoothing constants.
Integrated risk & reward visualization.
✅ In short:
This is an all-in-one Smart Money + Trend indicator with SuperTrend signals, swing/structure detection, order blocks, FVGs, EQH/EQL, TP/SL visualization, and optional alerts. It’s designed for both trend-following and order-block-based trading.
If you want, I can make a super-short 1-paragraph version that summarizes it even faster for quick reference.

Price Trendlines + Break Signals█ OVERVIEW
The "Price Trendlines + Break Signals" indicator is a technical analysis tool that automatically draws trendlines based on price pivot points and detects breakout signals. Designed for traders seeking precise market signals, the indicator identifies key pivot points, draws trendlines (resistance and support), and generates breakout signals with background highlighting. It offers flexible settings and alerts for breakout signals.
█ CONCEPTS
The indicator was created to provide traders with an alternative source of signals based on trendlines. Breakouts and bounces from trendlines can signal a trend change or the end of a correction. Combining these signals with other technical analysis tools can form the basis for building diverse trading strategies.
█ FEATURES
-Pivot Point Calculation: The indicator identifies pivot points (pivot high and pivot low) based on the closing price, with configurable left and right bars for pivot detection. Setting a higher number of bars results in fewer but more significant trendlines, with a delay corresponding to the specified length. Lower values generate more trendlines, but they are less significant. Crossovers are signaled only after the trendline is drawn, so sometimes no signals appear on crossed trendlines—this indicates the price passed through the line before it was detected.
- Trendlines: Draws trendlines connecting price pivot points—upper lines for downtrends (resistance) and lower lines for uptrends (support). Lines can be extended by a specified number of bars (default: 50).
- Tolerance Margin: Trendlines are widened by a tolerance margin, calculated using the average candle body size over a specified period and its multiplier. Reducing the multiplier to zero leaves only the trendline without a margin. Breaking this zone is a condition for generating signals.
- Breakout Signals: Generates signals when the price breaks through a trendline (bullish for upper lines, bearish for lower lines), with background highlighting for signal confirmation.
Alerts: Built-in alerts for:
- Upper trendline breakout (bullish signal).
- Lower trendline breakout (bearish signal).
Customization: Allows adjustment of pivot parameters, trendline extension length, tolerance margin, line colors, fills, and signal background transparency.
█ HOW TO USE
Adding the Indicator: Add the indicator to your TradingView chart via the Pine Editor or Indicators menu.
Configuring Settings:
- Left Bars for Pivot: Number of bars back for detecting pivots (default: 10).
- Right Bars for Pivot: Number of bars forward to confirm pivots (default: 10).
- Extend past 2nd pivot: Number of bars to extend the trendline after the second pivot (default: 50, 0 = no extension).
- Average Body Periods: Period for calculating the average candle body size used for the tolerance margin (default: 100).
- Tolerance Multiplier: Multiplier for the tolerance margin based on the average candle body size (default: 1.0).
Colors and Style:
- Upper trendline (resistance): default red.
- Lower trendline (support): default green.
- Line fills: colors with transparency (default 70).
- Signal background: green for bullish signals, red for bearish signals (default transparency 85).
Interpreting Signals:
- Trendlines: Upper lines (red) indicate a downtrend, lower lines (green) indicate an uptrend. Signals appear after a trendline breakout with the tolerance margin. Each trendline generates only one breakout signal, though it may still act as resistance or support for the price.
- Breakout Signals: Green background indicates an upper trendline breakout (bullish), red background indicates a lower trendline breakout (bearish).
- Alerts: Set up alerts in TradingView for trendline breakout signals.
Combining with Other Tools: Use with support/resistance levels, Fibonacci levels, RSI, pivot points, or FVG (Fair Value Gap) for signal confirmation.
█ APPLICATIONS
The "Price Trendlines + Break Signals" indicator is designed to identify trends and potential reversal points, supporting both trend-following and contrarian strategies:
- Trend Confirmation: Trendlines indicate the direction of the price trend, and bounces from them may signal the end of a correction.
- Reversal Strategies: Breakout signals can be used as cues to enter positions in anticipation of a trend change or correction.
- Noise Filtering: The tolerance margin reduces false signals, enhancing reliability.
█ NOTES
- Trendline crossovers are signaled only after the trendline is drawn, so sometimes no signals appear on crossed trendlines—this indicates the price passed through the line before it was detected.
- Each trendline generates only one breakout signal, though it may still act as a level of support or resistance for the price.
- Setting a higher number of bars for pivots results in fewer but more significant trendlines, with a delay corresponding to the specified length. Lower values generate more trendlines, but they are less significant.
- Adjust settings (e.g., number of bars for pivots, tolerance multiplier) to suit your trading style and timeframe.
- Combine with other technical analysis tools, such as RSI, pivot points, or FVG, to enhance signal accuracy.
- For high-volatility markets, consider increasing the tolerance margin to reduce false signals.

ULTIMATE Smart Trading Pro 🔥
## 🇬🇧 ENGLISH
### 📊 The Most Complete All-in-One Trading Indicator
**ULTIMATE Smart Trading Pro** combines the best technical analysis tools and Smart Money Concepts into a single powerful and intelligent indicator. Designed for serious traders who want a real edge in the markets.
---
### ✨ KEY FEATURES
#### 💰 **SMART MONEY CONCEPTS**
- **Order Blocks**: Automatically detects institutional zones where "smart money" enters positions
- **Break of Structure (BOS)**: Identifies structure breaks to confirm trend changes
- **Liquidity Zones**: Spots equal highs/lows areas where institutions hunt stops
- **Market Structure**: Visually displays bullish (green background) or bearish (red background) structure
#### 📈 **ADVANCED TECHNICAL INDICATORS**
- **RSI with Auto Divergences**: Classic RSI + automatic detection of bullish and bearish divergences
- **MACD with Signals**: Identifies bullish and bearish crossovers in real-time
- **Dynamic Support & Resistance**: Adaptive zones with intelligent scoring based on volume, multiple touches, and ATR
- **Fair Value Gaps (FVG)**: Detects unfilled price gaps (imbalance zones)
#### 📐 **AUTOMATIC TOOLS**
- **Auto Fibonacci**: Automatically calculates Fibonacci retracement levels on the last major trend
- **Pivot Points**: Daily, Weekly, or Monthly pivot points (PP, R1, R2, S1, S2)
- **Pattern Finder**: Automatically detects candlestick patterns (Hammer, Shooting Star, Engulfing, Morning/Evening Star) and chart patterns (Double Top/Bottom)
---
### 🎯 HOW TO USE IT
#### Quick Setup:
1. **Add the indicator** to your chart
2. **Open Settings** and enable/disable modules as needed
3. **Adjust parameters** for your trading style (scalping, swing, day trading)
#### Optimal Trading Setup:
🔥 **ULTRA STRONG Signal** when you have:
- An institutional **Order Block**
- Aligned with a **Support/Resistance** tested 3+ times
- An unfilled **FVG** nearby
- An **RSI divergence** confirming the reversal
- On a key **Fibonacci** level (50%, 61.8%, or 78.6%)
- Favorable market structure (green background for buys, red for sells)
---
### 💡 UNIQUE ADVANTAGES
✅ **Adaptive Intelligence**: Automatically adjusts to market volatility (ATR)
✅ **Volume Filters**: Validates important levels with volume confirmation
✅ **Multi-Timeframe Ready**: Works on all timeframes (1m to 1M)
✅ **Complete Alerts**: Notifications for all important signals
✅ **Clear Interface**: Emojis and colored labels for quick identification
✅ **Intelligent Scoring**: Levels ranked by importance (🔴🔴🔴 = very strong)
✅ **100% Customizable**: Enable only what you need
---
### 🎨 SYMBOL LEGEND
**Smart Money:**
- 🟢 OB = Bullish Order Block
- 🔴 OB = Bearish Order Block
- BOS ↑/↓ = Break of Structure
- 💧 LIQ = Liquidity Zone
**Candlestick Patterns:**
- 🔨 = Hammer (bullish signal)
- ⭐ = Shooting Star (bearish signal)
- 📈 = Bullish Engulfing
- 📉 = Bearish Engulfing
- 🌅 = Morning Star (bullish reversal)
- 🌆 = Evening Star (bearish reversal)
**Indicators:**
- 🚀 MACD ↑ = Bullish crossover
- 📉 MACD ↓ = Bearish crossover
- ⚠️ DIV = Bearish RSI divergence
- ✅ DIV = Bullish RSI divergence
**Support & Resistance:**
- 🟢/🔴 S1, R1 = Support/Resistance
- 🟢🟢🟢/🔴🔴🔴 = VERY strong level (3+ touches)
- (×N) = Number of times touched
---
### ⚙️ RECOMMENDED SETTINGS
**For Scalping (1m - 5m):**
- SR Lookback: 15
- Structure Strength: 3
- RSI: 14
- Volume Filter: ON
**For Day Trading (15m - 1H):**
- SR Lookback: 20
- Structure Strength: 5
- RSI: 14
- All filters: ON
**For Swing Trading (4H - Daily):**
- SR Lookback: 30
- Structure Strength: 7
- Pattern Lookback: 100
- Fibonacci: ON
---
### 🚨 DISCLAIMER
This indicator is a decision support tool. It does not guarantee profits and does not constitute financial advice. Always test on a demo account before real use. Trading involves significant risks.
---
## 📞 SUPPORT & UPDATES
For questions, suggestions, or bug reports, please comment below or contact the author.
**Version:** 1.0
**Last Updated:** October 2025
**Compatible:** TradingView Pine Script v6
---
### 🌟 If you find this indicator useful, please give it a 👍 and share it with other traders!
**Happy Trading! 🚀📈**

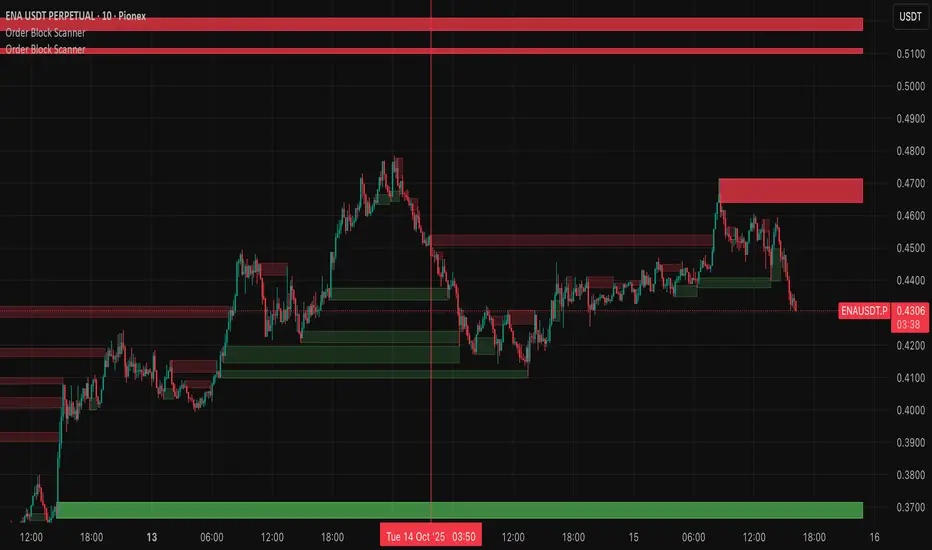
Wyckoff Order Block ScannerThis script scans for order blocks. An order block in the bullish case is a red candle that leads to two upward candles with a FVG inbetween, and in the bearish case, it's a bullish candle that leads to two downward candles with a FVG inbetween.
4H Sell Signals at Swing Highs/LowsThis shows only zones where a 4H FVG and a 4H OB overlap (i.e., true HPZ).
Uses strict filters (FVG size vs avg body, OB body multiplier) to reduce noise and show very few, high-quality zones.
Each HPZ is drawn once (box deleted/created only when the zone changes) to avoid chart spam.
Optional label appears when price is currently inside the HPZ so you can spot active opportunities quickly.
Hidden Liquidity Basic🟦 Hidden Liquidity Indicator – Basic Version
The Basic Version of the Hidden Liquidity Indicator expands on the Free version with advanced analytical features, full customization, and extended multi-timeframe capabilities.
Designed for professional and detail-oriented traders, it offers greater precision and control in identifying and interpreting Hidden Order Blocks (HOBs), Partial Hidden Order Blocks (PHOBs), and Partially Mitigated Hidden Order Blocks (PMHOBs).
🔍 Key Features
• Full Multi-Timeframe Analysis
Detect HOBs, PHOBs, and PMHOBs across up to 8 timeframes, allowing deep market structure comparison and multi-level confluence detection.
• Extended Visualization & Labelling Tools
• Extended boxes for clear structural mapping across larger chart areas.
• Merging labels to reduce clutter and improve readability.
• Multiple color schemes for clear differentiation between order block types.
• Advanced Customization Options
• Define individual ranges for each timeframe.
• Set a custom minimum HOB size to filter smaller or irrelevant zones.
• Adjust custom engulfing settings to fine-tune OB detection sensitivity.
• Create custom names for better chart management and strategy integration.
• Partial & Mitigation Analysis
The Basic version identifies and categorizes all hidden liquidity zones based on mitigation level:
• HOB (Hidden Order Block): Candle body fully within the FVG and untouched by wicks – a strong, valid liquidity block.
• PHOB (Partial Hidden Order Block): At least 50% of the candle body sits inside the FVG – representing partial liquidity presence.
• PMHOB (Partially Mitigated Hidden Order Block): Candle body mitigated by less than 50% – a partially weakened zone but still significant.
For all valid HOBs, the equilibrium (EQ) must be crossed by the corresponding FVG.
• Clustering Engine
Integrates a clustering system that automatically groups nearby or overlapping order blocks, creating a more organized and efficient visualization of liquidity concentrations.
🎨 Visual Consistency
All order blocks are color-coded for quick and intuitive recognition
⚙️ Summary
The Basic version is a professional-grade upgrade that combines advanced structure detection, customizable parameters, and a smart clustering engine for deeper liquidity insights.
With up to 8 timeframe support, extended visualization tools, and custom configuration options, it gives traders full control over how hidden liquidity is identified, displayed, and analyzed — empowering strategic precision and refined decision-making.

Kz GC1! ORBStrategy that trades breakouts on GC1! futures on the 5min timeframe. It also works on MGC1! for lower drawdown and to manage Apex and Top Step accounts with the lower risk.
Risk Disclaimer:
Past results as well as strategy tester reports do not indicate future performance. Guarantees do not exist in trading. By using this strategy you risk losing all your money.
Important:
It trades all days that markets are open. Set times may be seen on settings. Trades multiple times a day sometimes.
It works on the 5 and 15min timeframe only. Results are better on 5min timeframe.
The settings are optimized already for GC1! on the 5min timeframe.
How it works:
Every trading day it measures the range of the first 15min candle of pre-selected hours. As soon as price closes above or below on the 15min timeframe, it will trade the breakout targeting a set risk to reward ratio. SL on the opposite side of the range.
Settings:
Hourly Trading Hours: These are the times that worked best for this strategy. All boxes should be checked for best results. Excluded times were when it performed bad which is why those times have been left out.
ORB Formation Period: This setting determines on which timeframe candle has to close outside the opening range box in order to take a trade. It's set to 15min by default because this is what worked by far the best
Entry Type: Entries are immediate instead of waiting for a pull back to enter on a limit order.
Limit Orders: If enabled, the strategy will place a pending order x points from the current price, instead of a market order. Immediate orders are enabled by default for a better performance. Important: It doesn't actually place a limit order. The strategy will just wait for a pullback and then enter with a market order. It's more like a hidden limit order.
Limit Order Offset Points: If you have limit orders enabled, this setting determines how many points from the current price the limit order will be placed.
FVG Detection Type: How fast it detects the fair value gaps. Standard detection over immediate had better performance
Risk Type: You can chose either between Fixed USD Amount, Risk per Trade in % or Fixed Contract Size. By default it's set to fixed contract size.
Risk Amount (USD or Contracts): This setting is to set how many USD or how many contracts you want to risk per trade. Make sure to check which risk type you have selected before you choose the risk amount.
Take Profit Multiplier: This is simply the total SL size in points multiplied by x.
Example: If you put 2, you get a 2:1 Risk to Reward Ratio. By Default it's set to 2.5 because this gave the best results in backtests.
Stop Loss Padding: This is simply the buffer in points that is added to the SL for safety reasons. If you have it on 0, the SL will be at the exact price of the opposite side of the range. By default it's set to 5 because this is what delivered the best results in backtests.
Stop Loss Placement: This determines where the stop loss gets placed for the order. It has been set to ORB Range by default as this delivered the best results.
Max Trades Per Hour: This allows the user to decide how many trades are taken an hour. 1 is been set to default for best results
Visual Settings: Check boxes to show orb range, FVG's, Entry points, and trade visualization boxes.
Backtest Settings:
For the backtest the commissions were set to 1.29USD per contract and .35USD for micros which is the highest amount Tradovate charges Margin was not accounted for because typically on prop accounts you can use way more contracts than you need for the extremely low max drawdown. Margin would be important on personal accounts but even there typically it's not an issue at all especially because this strategy runs on the 15min timeframe so it won't use a lot of contracts anyways.
Why the source code is hidden:
The source code is hidden because I invested a lot of time and money into developing this strategy and optimizing it with paid 3rd party software.

HUNT_line [Dr.Forexy]HUNT_line Indicator
📊 **Category:** Price Action & Market Structure
⏰ **Recommended Timeframe:** 5-minute and higher
🎯 **Purpose:** Advanced market structure visualization for professional traders
⸻
⚡ **Key Features:**
• Break of Structure (BOS) and Change of Character (CHOCH) detection
• Internal & Swing Market Structure analysis
• Order Blocks identification with smart filtering
• Fair Value Gaps (FVG) visualization
• Premium/Discount Zones
• Multi-timeframe support
• Real-time structure alerts
⸻
🛠 **How to Use:**
1. Apply on 5M or higher timeframes for best results
2. Monitor BOS/CHOCH for trend direction changes
3. Use Order Blocks as potential support/resistance areas
4. Watch for FVG fills as price inefficiency zones
5. Combine multiple confluences for higher probability setups
⸻
⚠️ **Risk Disclaimer:**
This indicator is for educational purposes only.
Not financial advice. Always conduct your own research.
⸻
🔹 **Credits:**
Inspired by LuxAlgo's "Smart Money Concepts" with custom improvements

SMC 自動交易 - 4HR- BTC適用# SMC Automated Trading Strategy Whitepaper - Stepped Enhanced Edition
## 1. Strategy Overview
This strategy is designed based on the Smart Money Concept (SMC), integrating Order Block (OB), Change of Character (CHoCH), and strict pullback confirmation conditions. The goal is to enhance trading accuracy and strictly control risk, specifically tailored for trading competitions, meeting the requirements of stability and efficiency.
### Core Strategy Concepts:
- Precise identification of key trend reversal points.
- Strict pullback confirmation to avoid chasing tops or bottoms.
- Clear risk management and take-profit mechanisms to maintain stable risk-reward ratio.
- Supports trading time filtering (Kill Zone) to capture prime volatility windows.
- Multiple visual aids for quick in-trade signal recognition.
## 2. Strategy Logic Flow
### 1. Kill Zone (Optional Activation)
- Default trading time: Taiwan time 15:00 - 18:00.
- Purpose: Focus on high-volatility periods to reduce false signals in choppy markets.
### 2. Order Block Detection
- Current candle range exceeds the previous candle by a specified multiplier (default 0.8).
- Bullish OB: Bullish candle with expanded range.
- Bearish OB: Bearish candle with expanded range.
- Flexible OB sensitivity adjustment according to market volatility.
### 3. Change of Character (CHoCH)
- Initial trend reversal confirmation:
- Bullish CHoCH: Close above previous candle’s high.
- Bearish CHoCH: Close below previous candle’s low.
### 4. Pullback Confirmation (Core Condition)
- Avoid premature entries by requiring a pullback to the prior OB:
- Long: Pullback touches the previous Bullish OB high.
- Short: Pullback touches the previous Bearish OB low.
### 5. Fair Value Gap (FVG) Detection (Optional)
- Detect price imbalances as additional confirmation signals.
## 3. Entry Logic
### Long Position:
- Previous Bullish OB is formed.
- Current candle completes a pullback to the prior OB high.
- Current candle closes above the previous high (CHoCH confirmation).
- (Optional) Within Kill Zone.
### Short Position:
- Previous Bearish OB is formed.
- Current candle completes a pullback to the prior OB low.
- Current candle closes below the previous low (CHoCH confirmation).
- (Optional) Within Kill Zone.
## 4. Risk Management & Exit Strategy
### Stop Loss:
- Long: Current candle’s low minus buffer points (default 50 points).
- Short: Current candle’s high plus buffer points (default 50 points).
### Take Profit:
- Default Risk-Reward Ratio (RR): 2.0 (customizable).
- Automatically calculates target take-profit level.
### Full Automation:
- This is a fully automated strategy. Orders are placed automatically upon conditions being met, requiring no manual intervention.
## 5. Visual Aids
- Bullish OB: Green upward triangle.
- Bearish OB: Red downward triangle.
- Bullish CHoCH: Blue circle.
- Bearish CHoCH: Orange circle.
- FVG: Highlighted zones (optional).
> **Advantage:** Quick market status recognition during trades, improving strategy transparency.
## 6. Strategy Advantages
✅ Dual trend reversal confirmation: OB + CHoCH.
✅ Strict pullback requirement to reduce false breakouts.
✅ Clear risk control and stable risk-reward ratio.
✅ Visual aids + time filter for clear in-trade decisions.
✅ Fully automated trading reduces human error.
## 7. Application Scenarios
- Trading competitions: Designed for high win-rate and strict risk control.
- FTMO and similar evaluation challenges.
- Intraday or swing trading strategy frameworks.
- High-volatility assets: Crypto / Forex / Index CFDs.
## 8. Risk Warning
- Strategy is based on historical backtesting; live trading should consider slippage and liquidity risks.
- During high volatility periods, use proper money management tools and strictly execute stop losses.
## 9. Version Note
Version: Stepped Enhanced Edition (Updated April 2025)
Developer: natwad3000

SCTI - D14SCTI - D14 Comprehensive Technical Analysis Suite
English Description
SCTI D14 is an advanced multi-component technical analysis indicator designed for professional traders and analysts. This comprehensive suite combines multiple analytical tools into a single, powerful indicator that provides deep market insights across various timeframes and methodologies.
Core Components:
1. EMA System (Exponential Moving Averages)
13 customizable EMA lines with periods ranging from 8 to 2584
Fibonacci-based periods (8, 13, 21, 34, 55, 89, 144, 233, 377, 610, 987, 1597, 2584)
Color-coded visualization for easy trend identification
Individual toggle controls for each EMA line
2. TFMA (Multi-Timeframe Moving Averages)
Cross-timeframe analysis with 3 independent EMA calculations
Real-time labels showing trend direction and price relationships
Customizable timeframes for each moving average
Percentage deviation display from current price
3. PMA (Precision Moving Average Cloud)
7-layer moving average system with customizable periods
Fill areas between moving averages for trend visualization
Support and resistance zone identification
Dynamic color-coded trend clouds
4. VWAP (Volume Weighted Average Price)
Multiple anchor points (Session, Week, Month, Quarter, Year, Earnings, Dividends, Splits)
Standard deviation bands for volatility analysis
Automatic session detection and anchoring
Statistical price level identification
5. Advanced Divergence Detector
12 technical indicators for divergence analysis (MACD, RSI, Stochastic, CCI, Williams %R, Bias, Momentum, OBV, VW-MACD, CMF, MFI, External)
Regular and hidden divergences detection
Bullish and bearish signals with visual confirmation
Customizable sensitivity and filtering options
Real-time alerts for divergence formations
6. Volume Profile & Node Analysis
Comprehensive volume distribution analysis
Point of Control (POC) identification
Value Area High/Low (VAH/VAL) calculations
Volume peaks and troughs detection
Support and resistance levels based on volume
7. Smart Money Concepts
Market structure analysis with Break of Structure (BOS) and Change of Character (CHoCH)
Internal and swing structure detection
Equal highs and lows identification
Fair Value Gaps (FVG) detection and visualization
Liquidity zones and institutional flow analysis
8. Trading Sessions
9 major trading sessions (Asia, Sydney, Tokyo, Shanghai, Hong Kong, Europe, London, New York, NYSE)
Real-time session status and countdown timers
Session volume and performance tracking
Customizable session boxes and labels
Statistical session analysis table
Key Features:
Modular Design: Enable/disable any component independently
Real-time Analysis: Live updates with market data
Multi-timeframe Support: Works across all chart timeframes
Customizable Alerts: Set alerts for any detected pattern or signal
Professional Visualization: Clean, organized display with customizable colors
Performance Optimized: Efficient code for smooth chart performance
Use Cases:
Trend Analysis: Identify market direction using multiple EMA systems
Entry/Exit Points: Use divergences and structure breaks for timing
Risk Management: Utilize volume profiles and session analysis for better positioning
Multi-timeframe Analysis: Confirm signals across different timeframes
Institutional Analysis: Track smart money flows and market structure
Perfect For:
Day traders seeking comprehensive market analysis
Swing traders needing multi-timeframe confirmation
Professional analysts requiring detailed market structure insights
Algorithmic traders looking for systematic signal generation
---
中文描述
SCTI - D14是一个先进的多组件技术分析指标,专为专业交易者和分析师设计。这个综合套件将多种分析工具整合到一个强大的指标中,在各种时间框架和方法论中提供深度市场洞察。
核心组件:
1. EMA系统(指数移动平均线)
13条可定制EMA线,周期从8到2584
基于斐波那契的周期(8, 13, 21, 34, 55, 89, 144, 233, 377, 610, 987, 1597, 2584)
颜色编码可视化,便于趋势识别
每条EMA线的独立切换控制
2. TFMA(多时间框架移动平均线)
跨时间框架分析,包含3个独立的EMA计算
实时标签显示趋势方向和价格关系
每个移动平均线的可定制时间框架
显示与当前价格的百分比偏差
3. PMA(精密移动平均云)
7层移动平均系统,周期可定制
移动平均线间填充区域用于趋势可视化
支撑阻力区域识别
动态颜色编码趋势云
4. VWAP(成交量加权平均价格)
多个锚点(交易时段、周、月、季、年、财报、分红、拆股)
标准差带用于波动性分析
自动时段检测和锚定
统计价格水平识别
5. 高级背离检测器
12个技术指标用于背离分析(MACD、RSI、随机指标、CCI、威廉姆斯%R、Bias、动量、OBV、VW-MACD、CMF、MFI、外部指标)
常规和隐藏背离检测
看涨看跌信号配视觉确认
可定制敏感度和过滤选项
背离形成的实时警报
6. 成交量分布与节点分析
全面的成交量分布分析
控制点(POC)识别
价值区域高/低点(VAH/VAL)计算
成交量峰值和低谷检测
基于成交量的支撑阻力水平
7. 聪明钱概念
市场结构分析,包括结构突破(BOS)和结构转变(CHoCH)
内部和摆动结构检测
等高等低识别
公允价值缺口(FVG)检测和可视化
流动性区域和机构资金流分析
8. 交易时区
9个主要交易时段(亚洲、悉尼、东京、上海、香港、欧洲、伦敦、纽约、纽交所)
实时时段状态和倒计时器
时段成交量和表现跟踪
可定制时段框和标签
统计时段分析表格
主要特性:
模块化设计:可独立启用/禁用任何组件
实时分析:随市场数据实时更新
多时间框架支持:适用于所有图表时间框架
可定制警报:为任何检测到的模式或信号设置警报
专业可视化:清洁、有序的显示界面,颜色可定制
性能优化:高效代码确保图表流畅运行
使用场景:
趋势分析:使用多重EMA系统识别市场方向
入场/出场点:利用背离和结构突破进行时机选择
风险管理:利用成交量分布和时段分析进行更好定位
多时间框架分析:在不同时间框架间确认信号
机构分析:跟踪聪明钱流向和市场结构
适用于:
寻求全面市场分析的日内交易者
需要多时间框架确认的摆动交易者
需要详细市场结构洞察的专业分析师
寻求系统化信号生成的算法交易者

HTF SwingFind swing formations on HTF
See in a table which LTF FVG setups get unlocked
FVG color based on unlocked status of HTF swing
