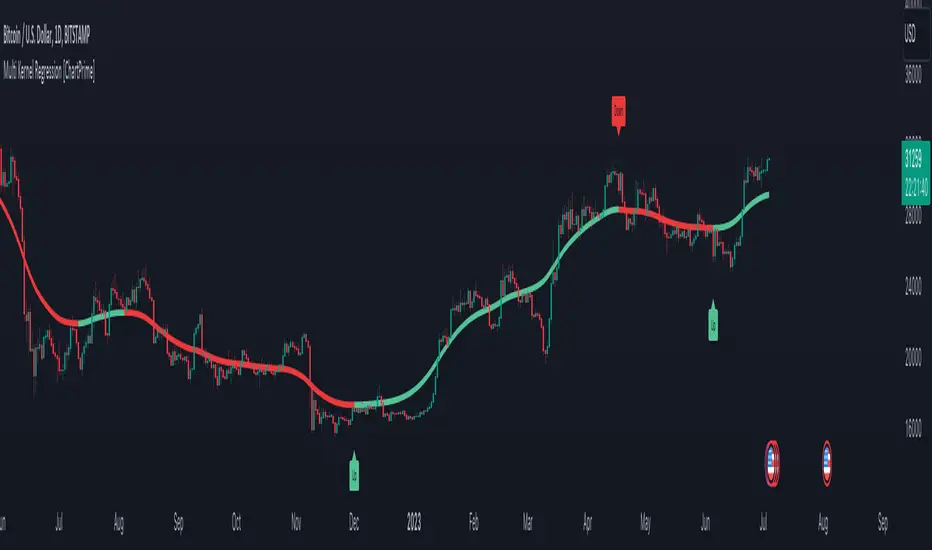
Multi Kernel Regression [ChartPrime]The "Multi Kernel Regression" is a versatile trading indicator that provides graphical interpretations of market trends by using different kernel regression methods. It's beneficial because it smoothes out price data, creating a clearer picture of price movements, and can be tailored according to the user's preference with various options.
What makes this indicator uniquely versatile is the 'Kernel Select' feature, which allows you to choose from a variety of regression kernel types, such as Gaussian, Logistic, Cosine, and many more. In fact, you have 17 options in total, making this an adaptable tool for diverse market contexts.
The bandwidth input parameter directly affects the smoothness of the regression line. While a lower value will make the line more sensitive to price changes by sticking closely to the actual prices, a higher value will smooth out the line even further by placing more emphasis on distant prices.
It's worth noting that the indicator's 'Repaint' function, which re-estimates work according to the most recent data, is not a deficiency or a flaw. Instead, it’s a crucial part of its functionality, updating the regression line with the most recent data, ensuring the indicator measurements remain as accurate as possible. We have however included a non-repaint feature that provides fixed calculations, creating a steady line that does not change once it has been plotted, for a different perspective on market trends.
This indicator also allows you to customize the line color, style, and width, allowing you to seamlessly integrate it into your existing chart setup. With labels indicating potential market turn points, you can stay on top of significant price movements.
Repaint : Enabling this allows the estimator to repaint to maintain accuracy as new data comes in.
Kernel Select : This option allows you to select from an array of kernel types such as Triangular, Gaussian, Logistic, etc. Each kernel has a unique weight function which influences how the regression line is calculated.
Bandwidth : This input, a scalar value, controls the regression line's sensitivity towards the price changes. A lower value makes the regression line more sensitive (closer to price) and higher value makes it smoother.
Source : Here you denote which price the indicator should consider for calculation. Traditionally, this is set as the close price.
Deviation : Adjust this to change the distance of the channel from the regression line. Higher values widen the channel, lower values make it smaller.
Line Style : This provides options to adjust the visual style of the regression lines. Options include Solid, Dotted, and Dashed.
Labels : Enabling this introduces markers at points where the market direction switches. Adjust the label size to suit your preference.
Colors : Customize color schemes for bullish and bearish trends along with the text color to match your chart setup.
Kernel regression, the technique behind the Multi Kernel Regression Indicator, has a rich history rooted in the world of statistical analysis and machine learning.
The origins of kernel regression are linked to the work of Emanuel Parzen in the 1960s. He was a pioneer in the development of nonparametric statistics, a domain where kernel regression plays a critical role. Although originally developed for the field of probability, these methods quickly found application in various other scientific disciplines, notably in econometrics and finance.
Kernel regression became really popular in the 1980s and 1990s along with the rise of other nonparametric techniques, like local regression and spline smoothing. It was during this time that kernel regression methods were extensively studied and widely applied in the fields of machine learning and data science.
What makes the kernel regression ideal for various statistical tasks, including financial market analysis, is its flexibility. Unlike linear regression, which assumes a specific functional form for the relationship between the independent and dependent variables, kernel regression makes no such assumptions. It creates a smooth curve fit to the data, which makes it extremely useful in capturing complex relationships in data.
In the context of stock market analysis, kernel regression techniques came into use in the late 20th century as computational power improved and these techniques could be more easily applied. Since then, they have played a fundamental role in financial market modeling, market prediction, and the development of trading indicators, like the Multi Kernel Regression Indicator.
Today, the use of kernel regression has solidified its place in the world of trading and market analysis, being widely recognized as one of the most effective methods for capturing and visualizing market trends.
The Multi Kernel Regression Indicator is built upon kernel regression, a versatile statistical method pioneered by Emanuel Parzen in the 1960s and subsequently refined for financial market analysis. It provides a robust and flexible approach to capturing complex market data relationships.
This indicator is more than just a charting tool; it reflects the power of computational trading methods, combining statistical robustness with visual versatility. It's an invaluable asset for traders, capturing and interpreting complex market trends while integrating seamlessly into diverse trading scenarios.
In summary, the Multi Kernel Regression Indicator stands as a testament to kernel regression's historic legacy, modern computational power, and contemporary trading insight.
Pesquisar nos scripts por "change"
[DisDev] D-I-Y Gridbot🟩 This script is a “do-it-yourself” Grid Bot Simulator, used for visualizing support and resistance levels. Prices are divided into grids, or trade zones, that will trigger signals each time a new zone is entered. During ranging markets, each transaction is followed by a “take profit.” As the market starts to trend, transactions are stacked (compare to DCA ), until the market consolidates. No signals are triggered above the upper gridline or below the lower gridline. Unlike the previous version, all grids may be adjusted in real-time by dragging the gridlines up and down to the desired support and resistance levels.
When adding the indicator to a new chart, you must choose six grid levels by clicking on the desired support or resistance price. You can change all of these levels at any time directly on the chart.
⚡ OVERVIEW ⚡
The D-I-Y Gridbot is an interactive tool designed for visualizing support and resistance levels. As a continuation of the original Gridbot Simulator , which has received significant recognition on TradingView, earning over 4000 boosts and an Editor's Pick status. This tool serves not only as an evolved version of its predecessor, but also as an open-source template for developing future gridbots. It aims to foster discussions and facilitate innovations around grid-trading strategies.
One of the new features of this gridbot is the real-time adjustability of all gridlines. Users can move these lines up and down to set their desired support and resistance levels in response to changing market conditions. Additionally, the D-I-Y Gridbot is compatible with multiple timeframes and can be used on most TradingView charts.
Drag gridlines up or down to desired price level.
Key Features 🔑
All gridlines are adjustable in real-time, directly on the chart
Signals can be filtered by a customizable moving average or by VWAP
Customizable support and resistance levels
Potentially increases profitability in ranging markets
Benefits 💸
Customizable Support and Resistance Levels : The D-I-Y Gridbot allows users to set their preferred support and resistance levels, which can be changed at any time directly on the chart. This provides users with the ability to customize their trading parameters based on their strategy and risk tolerance.
Various Trading Strategies : The D-I-Y Gridbot supports various trading strategies, including Mean Reversion, Ranging Markets, and Dollar-cost averaging (DCA). This allows users to capitalize on price reversals, execute buy and sell orders at predetermined levels, and buy more of an asset as the price falls, respectively.
Multi-Timeframe and Versatility : The D-I-Y Gridbot is compatible with multiple timeframes and can be used on any TradingView chart.
Experimental and Educational : The D-I-Y Gridbot is considered a proof-of-concept tool that is both experimental and educational. This can provide traders with a deeper understanding of grid trading strategies and the ability to experiment with different trading parameters and strategies.
⚙️ CONFIGURATION & SETTINGS ⚙️
Inputs 🔧
Trigger : Candle location to trigger the signal. "Wick" will use either high or low, depending on the signal direction. "Close" will use the close price. “MA” will use the selected moving average or VWAP.
Confirmation : Market direction to confirm the candle trigger. "Reverse" will confirm the signal when the price crosses back over the trigger. "Breakout" will confirm when the price breaks out of the trigger.
Number of Support/Resistance zones : 1 = Only Top Grid is Support/Only Bottom Grid is Resistance. 2 = Top two grids are Resistance/Bottom two grids are Support. 3 = Top three grids are Resistance/Bottom three grids are Support
MA Type : Exponential Moving Average (EMA), Hull Moving Average (HMA), Simple Moving Average (SMA), Triple Exponential Moving Average (TEMA), Volume Weighted Moving Average (VWMA), Volume Weighted Average Price (VWAP)
MA Filter : Use Moving Average as a reversion filter for signals. When enabled, no buys when above MA, no sells when below. Use in conjunction with S/R zones to reduce false signals.
Allow Repeat Signals . When enabled, signals will reset when nearest gridline is triggered. When disabled, only one signal will be triggered per gridline.
Line/Fill colors
Gridlines . Adjusts gridline prices manually.
Left : Trigger = Wick. Confirm = Breakout. Buys are signaled when LOW breaks below gridline. Sells are triggered when HIGH breaks above gridline.
Right : Trigger = Close. Confirm = Breakout. Buys are signaled when the candle CLOSES below the gridline. Sells are triggered when the candle CLOSES above the gridline.
Left : Confirm=Breakout. Signals on breaking through the next gridline.
Right : Confirm=Reverse. Signals only when crossing back from the gridline.
S/R Zones=1. Upper gridline is Resistance / Lower is Support. Middle 4 are neutral.
S/R Zones = 3. Upper three gridlines are Resistance / Lower three are Support
Notes:
If gridlines are dragged out of order on a live chart, they will auto-sort into the correct order.
Price levels may be entered in settings, or adjusted in real-time directly on the chart.
When changing symbols, remember to adjust the gridlines to accommodate the new symbol.
Alerts 🔔
Users can set alerts based on their chosen parameters for triggers, confirmations, number of support/resistance zones, and smoothing type, enabling precise control over alert conditions.
💡 USAGE & STRATEGY 💡
Trading Strategies 📈
Mean Reversion: The script can be used to capitalize on price reversals back to the mean.
Ranging Markets: The script excels in ranging markets, executing buy and sell orders at predetermined levels.
Dollar-cost averaging (DCA): The script can be used to execute DCA orders, buying more of an asset as the price falls, and lowering the average cost per unit.
Timeframes and Symbols ⌚
Multi-Timeframe: The indicator is compatible with multiple timeframes.
Versatile: Can be used on any crypto trading pair on TradingView.
🤖 DETAILS & METHODOLOGY 🤖
Algorithm and Calculation 🛡️
Grids are set and adjusted when loading the indicator on the chart and may be customized anytime afterward by clicking and dragging the gridlines on the chart.
Gridlines are updated, sorted, and stored in a float array.
Signals are calculated based on candle trigger, market direction, and previous price level.
📚 ADDITIONAL RESOURCES 📚
Chart Examples 📊
S/R Zones = 3: Three Support and Three Resistance. Filter = 50-period Triple Exponential Moving Average (TEMA)
S/R Zones = 1: One Support, One Resistance, and Four Neutral Zones. Support Zones: Buys only. Resistance Zones: Sells only. Neutral Zones: Grid-dependent
When MA filter is enabled, Buys are only triggered below Moving Average, and Sells are only triggered above.
Trigger = Wick. Confirmation = Breakout. Buys are signaled when Low breaks above the next grid level. Sells are signaled when High breaks below the next grid level.
🚀 CONCLUSION 🚀
The D-I-Y Gridbot is a proof-of-concept, emphasizing its experimental and educational nature. In future versions, we will aim to incorporate concepts such as auto-adjusting grids and angled grids for trending markets. The script is designed to evolve through user feedback and suggestions, shaping its future iterations.
Credit: This is a continuation of the Gridbot series by xxattaxx-DisDev . Explicit permission was granted by user xxattaxx-disdev to re-use all Gridbot code and all materials without restrictions.
⚠️ DISCLAIMER ⚠️
This indicator is a proof-of-concept and is considered experimental and educational. When gridlines are drawn in hindsight, signals appear to be predictive and valid. Future results may always vary when the trend direction changes. Comments and suggestions are encouraged.
This indicator is provided as a tool for traders and should not be used as the sole basis for making trading decisions. Always conduct your own research and consider your risk tolerance before entering any trades.

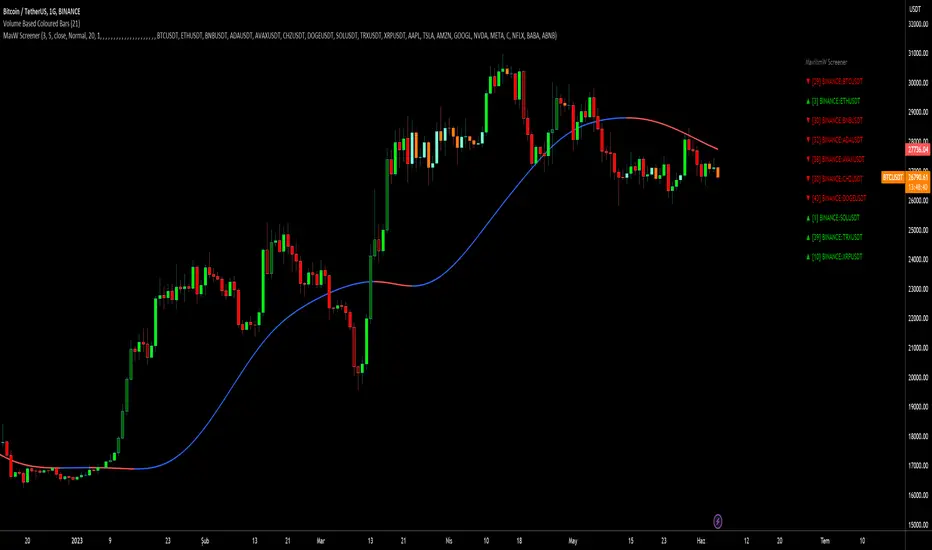
MavilimW ScreenerScreener version of MavilimW Moving Average :
Short-Term Examples (by decreasing 3 and 5 default values to have trading signals from color changes)
BUY when MavilimW turns blue from red.
SELL when MavW turns red from blue.
Long-Term Examples (with Default values 3 and 5)
BUY when the price crosses over the MavilimW line
SELL when the price crosses below the MavW line
MavilimW can also define significant SUPPORT and RESISTANCE levels in every period with its default values 3 and 5.
Screener Panel:
You can explore 20 different and user-defined tickers, which can be changed from the SETTINGS (shares, crypto, commodities...) on this screener version.
The screener panel shows up right after the bars on the right side of the chart.
Tickers seen in green are the ones that are in an uptrend, according to MavilimW.
The ones that appear in red are those in the SELL signal, in a downtrend.
The numbers in front of each Ticker indicate how many bars passed after the last BUY or SELL signal of MavW.
For example, according to the indicator, when BTCUSDT appears (3) in GREEN, Bitcoin switched to a BUY signal 3 bars ago.
-In this screener version of MavilimW, users can define the number of demanded tickers (symbols) from 1 to 20 by checking the relevant boxes on the settings tab.
-All selected tickers can be screened in different timeframes.
-Also, different timeframes of the same Ticker can be screened.
IMPORTANT NOTICE:
-Screener shows the information about the color changes of MavilimW Moving Average with default settings (as explained in the Short-Term Example section).
-Users can check the "Change Screener to show MavilimW & Price Flips" button to activate the screener as explained in the Short-Term Example section. Then the screener will give information about price flips.
BTC bottom top MACRO indicator based on: Cost per transaction(w)Predicting tops and bottoms in any market is a challenging task, and the Bitcoin market is no exception. Many traders and analysts use a combination of various indicators and models to help them make educated guesses about where the market might be heading. One such metric that can provide valuable insights is the Bitcoin cost per transaction indicator.
Here's how it could potentially be superior to just using price action for predicting macro tops and bottoms:
Transaction Cost as an Indicator of Network Activity: The cost per transaction on the Bitcoin network can give an indication of how much activity is taking place. When transaction costs are high, it may signal increased network usage, which often coincides with periods of market enthusiasm or FOMO (Fear of Missing Out) that can precede market tops. Conversely, lower transaction costs might indicate reduced network activity, potentially signaling a lack of investor interest that might precede market bottoms.
Reflects Real-World Use and Demand: Unlike price action, which can be influenced by speculative trading and may not always reflect the underlying fundamentals, the cost per transaction is directly tied to the use of the Bitcoin network. It offers a more fundamental approach to understanding market dynamics.
Complements Price Action Analysis: While price action can give signals about potential tops and bottoms based on historical price patterns and technical analysis, the cost per transaction can add an additional layer of information by reflecting network activity. In this way, the two can be used together to give a more complete picture of the market.
May Precede Price Changes: Changes in transaction costs could potentially precede price changes, giving advanced warning of tops and bottoms. For instance, a sudden increase in transaction costs might indicate a surge in network activity and investor interest, potentially signaling a market top. On the other hand, a decrease in transaction costs might suggest declining network activity and investor interest, potentially signaling a market bottom.
However, it's important to note that while the cost per transaction can provide valuable insights, it's not a foolproof method for predicting market tops and bottoms. Like all indicators, it should be used in conjunction with other tools and analysis methods, and traders should also consider the broader market context. As always, past performance is not indicative of future results, and all trading and investment strategies carry the risk of loss.

MomentumIndicatorsLibrary "MomentumIndicators"
This is a library of 'Momentum Indicators', also denominated as oscillators.
The purpose of this library is to organize momentum indicators in just one place, making it easy to access.
In addition, it aims to allow customized versions, not being restricted to just the price value.
An example of this use case is the popular Stochastic RSI.
# Indicators:
1. Relative Strength Index (RSI):
Measures the relative strength of recent price gains to recent price losses of an asset.
2. Rate of Change (ROC):
Measures the percentage change in price of an asset over a specified time period.
3. Stochastic Oscillator (Stoch):
Compares the current price of an asset to its price range over a specified time period.
4. True Strength Index (TSI):
Measures the price change, calculating the ratio of the price change (positive or negative) in relation to the
absolute price change.
The values of both are smoothed twice to reduce noise, and the final result is normalized
in a range between 100 and -100.
5. Stochastic Momentum Index (SMI):
Combination of the True Strength Index with a signal line to help identify turning points in the market.
6. Williams Percent Range (Williams %R):
Compares the current price of an asset to its highest high and lowest low over a specified time period.
7. Commodity Channel Index (CCI):
Measures the relationship between an asset's current price and its moving average.
8. Ultimate Oscillator (UO):
Combines three different time periods to help identify possible reversal points.
9. Moving Average Convergence/Divergence (MACD):
Shows the difference between short-term and long-term exponential moving averages.
10. Fisher Transform (FT):
Normalize prices into a Gaussian normal distribution.
11. Inverse Fisher Transform (IFT):
Transform the values of the Fisher Transform into a smaller and more easily interpretable scale is through the
application of an inverse transformation to the hyperbolic tangent function.
This transformation takes the values of the FT, which range from -infinity to +infinity, to a scale limited
between -1 and +1, allowing them to be more easily visualized and compared.
12. Premier Stochastic Oscillator (PSO):
Normalizes the standard stochastic oscillator by applying a five-period double exponential smoothing average of
the %K value, resulting in a symmetric scale of 1 to -1
# Indicators of indicators:
## Stochastic:
1. Stochastic of RSI (Relative Strengh Index)
2. Stochastic of ROC (Rate of Change)
3. Stochastic of UO (Ultimate Oscillator)
4. Stochastic of TSI (True Strengh Index)
5. Stochastic of Williams R%
6. Stochastic of CCI (Commodity Channel Index).
7. Stochastic of MACD (Moving Average Convergence/Divergence)
8. Stochastic of FT (Fisher Transform)
9. Stochastic of Volume
10. Stochastic of MFI (Money Flow Index)
11. Stochastic of On OBV (Balance Volume)
12. Stochastic of PVI (Positive Volume Index)
13. Stochastic of NVI (Negative Volume Index)
14. Stochastic of PVT (Price-Volume Trend)
15. Stochastic of VO (Volume Oscillator)
16. Stochastic of VROC (Volume Rate of Change)
## Inverse Fisher Transform:
1.Inverse Fisher Transform on RSI (Relative Strengh Index)
2.Inverse Fisher Transform on ROC (Rate of Change)
3.Inverse Fisher Transform on UO (Ultimate Oscillator)
4.Inverse Fisher Transform on Stochastic
5.Inverse Fisher Transform on TSI (True Strength Index)
6.Inverse Fisher Transform on CCI (Commodity Channel Index)
7.Inverse Fisher Transform on Fisher Transform (FT)
8.Inverse Fisher Transform on MACD (Moving Average Convergence/Divergence)
9.Inverse Fisher Transfor on Williams R% (Williams Percent Range)
10.Inverse Fisher Transfor on CMF (Chaikin Money Flow)
11.Inverse Fisher Transform on VO (Volume Oscillator)
12.Inverse Fisher Transform on VROC (Volume Rate of Change)
## Stochastic Momentum Index:
1.Stochastic Momentum Index of RSI (Relative Strength Index)
2.Stochastic Momentum Index of ROC (Rate of Change)
3.Stochastic Momentum Index of VROC (Volume Rate of Change)
4.Stochastic Momentum Index of Williams R% (Williams Percent Range)
5.Stochastic Momentum Index of FT (Fisher Transform)
6.Stochastic Momentum Index of CCI (Commodity Channel Index)
7.Stochastic Momentum Index of UO (Ultimate Oscillator)
8.Stochastic Momentum Index of MACD (Moving Average Convergence/Divergence)
9.Stochastic Momentum Index of Volume
10.Stochastic Momentum Index of MFI (Money Flow Index)
11.Stochastic Momentum Index of CMF (Chaikin Money Flow)
12.Stochastic Momentum Index of On Balance Volume (OBV)
13.Stochastic Momentum Index of Price-Volume Trend (PVT)
14.Stochastic Momentum Index of Volume Oscillator (VO)
15.Stochastic Momentum Index of Positive Volume Index (PVI)
16.Stochastic Momentum Index of Negative Volume Index (NVI)
## Relative Strength Index:
1. RSI for Volume
2. RSI for Moving Average
rsi(source, length)
RSI (Relative Strengh Index). Measures the relative strength of recent price gains to recent price losses of an asset.
Parameters:
source : (float) Source of series (close, high, low, etc.)
length : (int) Period of loopback
Returns: (float) Series of RSI
roc(source, length)
ROC (Rate of Change). Measures the percentage change in price of an asset over a specified time period.
Parameters:
source : (float) Source of series (close, high, low, etc.)
length : (int) Period of loopback
Returns: (float) Series of ROC
stoch(kLength, kSmoothing, dSmoothing, maTypeK, maTypeD, almaOffsetKD, almaSigmaKD, lsmaOffSetKD)
Stochastic Oscillator. Compares the current price of an asset to its price range over a specified time period.
Parameters:
kLength
kSmoothing : (int) Period for smoothig stochastic
dSmoothing : (int) Period for signal (moving average of stochastic)
maTypeK : (int) Type of Moving Average for Stochastic Oscillator
maTypeD : (int) Type of Moving Average for Stochastic Oscillator Signal
almaOffsetKD : (float) Offset for Arnaud Legoux Moving Average for Oscillator and Signal
almaSigmaKD : (float) Sigma for Arnaud Legoux Moving Average for Oscillator and Signal
lsmaOffSetKD : (int) Offset for Least Squares Moving Average for Oscillator and Signal
Returns: A tuple of Stochastic Oscillator and Moving Average of Stochastic Oscillator
stoch(source, kLength, kSmoothing, dSmoothing, maTypeK, maTypeD, almaOffsetKD, almaSigmaKD, lsmaOffSetKD)
Stochastic Oscillator. Customized source. Compares the current price of an asset to its price range over a specified time period.
Parameters:
source : (float) Source of series (close, high, low, etc.)
kLength : (int) Period of loopback to calculate the stochastic
kSmoothing : (int) Period for smoothig stochastic
dSmoothing : (int) Period for signal (moving average of stochastic)
maTypeK : (int) Type of Moving Average for Stochastic Oscillator
maTypeD : (int) Type of Moving Average for Stochastic Oscillator Signal
almaOffsetKD : (float) Offset for Arnaud Legoux Moving Average for Stoch and Signal
almaSigmaKD : (float) Sigma for Arnaud Legoux Moving Average for Stoch and Signal
lsmaOffSetKD : (int) Offset for Least Squares Moving Average for Stoch and Signal
Returns: A tuple of Stochastic Oscillator and Moving Average of Stochastic Oscillator
tsi(source, shortLength, longLength, maType, almaOffset, almaSigma, lsmaOffSet)
TSI (True Strengh Index). Measures the price change, calculating the ratio of the price change (positive or negative) in relation to the absolute price change.
The values of both are smoothed twice to reduce noise, and the final result is normalized in a range between 100 and -100.
Parameters:
source : (float) Source of series (close, high, low, etc.)
shortLength : (int) Short length
longLength : (int) Long length
maType : (int) Type of Moving Average for TSI
almaOffset : (float) Offset for Arnaud Legoux Moving Average
almaSigma : (float) Sigma for Arnaud Legoux Moving Average
lsmaOffSet : (int) Offset for Least Squares Moving Average
Returns: (float) TSI
smi(sourceTSI, shortLengthTSI, longLengthTSI, maTypeTSI, almaOffsetTSI, almaSigmaTSI, lsmaOffSetTSI, maTypeSignal, smoothingLengthSignal, almaOffsetSignal, almaSigmaSignal, lsmaOffSetSignal)
SMI (Stochastic Momentum Index). A TSI (True Strengh Index) plus a signal line.
Parameters:
sourceTSI : (float) Source of series for TSI (close, high, low, etc.)
shortLengthTSI : (int) Short length for TSI
longLengthTSI : (int) Long length for TSI
maTypeTSI : (int) Type of Moving Average for Signal of TSI
almaOffsetTSI : (float) Offset for Arnaud Legoux Moving Average
almaSigmaTSI : (float) Sigma for Arnaud Legoux Moving Average
lsmaOffSetTSI : (int) Offset for Least Squares Moving Average
maTypeSignal
smoothingLengthSignal
almaOffsetSignal
almaSigmaSignal
lsmaOffSetSignal
Returns: A tuple with TSI, signal of TSI and histogram of difference
wpr(source, length)
Williams R% (Williams Percent Range). Compares the current price of an asset to its highest high and lowest low over a specified time period.
Parameters:
source : (float) Source of series (close, high, low, etc.)
length : (int) Period of loopback
Returns: (float) Series of Williams R%
cci(source, length, maType, almaOffset, almaSigma, lsmaOffSet)
CCI (Commodity Channel Index). Measures the relationship between an asset's current price and its moving average.
Parameters:
source : (float) Source of series (close, high, low, etc.)
length : (int) Period of loopback
maType : (int) Type of Moving Average
almaOffset : (float) Offset for Arnaud Legoux Moving Average
almaSigma : (float) Sigma for Arnaud Legoux Moving Average
lsmaOffSet : (int) Offset for Least Squares Moving Average
Returns: (float) Series of CCI
ultimateOscillator(fastLength, middleLength, slowLength)
UO (Ultimate Oscilator). Combines three different time periods to help identify possible reversal points.
Parameters:
fastLength : (int) Fast period of loopback
middleLength : (int) Middle period of loopback
slowLength : (int) Slow period of loopback
Returns: (float) Series of Ultimate Oscilator
ultimateOscillator(source, fastLength, middleLength, slowLength)
UO (Ultimate Oscilator). Customized source. Combines three different time periods to help identify possible reversal points.
Parameters:
source : (float) Source of series (close, high, low, etc.)
fastLength : (int) Fast period of loopback
middleLength : (int) Middle period of loopback
slowLength : (int) Slow period of loopback
Returns: (float) Series of Ultimate Oscilator
macd(source, fastLength, slowLength, signalLength, maTypeFast, maTypeSlow, maTypeMACD, almaOffset, almaSigma, lsmaOffSet)
MACD (Moving Average Convergence/Divergence). Shows the difference between short-term and long-term exponential moving averages.
Parameters:
source : (float) Source of series (close, high, low, etc.)
fastLength : (int) Period for fast moving average
slowLength : (int) Period for slow moving average
signalLength : (int) Signal length
maTypeFast : (int) Type of fast moving average
maTypeSlow : (int) Type of slow moving average
maTypeMACD : (int) Type of MACD moving average
almaOffset : (float) Offset for Arnaud Legoux Moving Average
almaSigma : (float) Sigma for Arnaud Legoux Moving Average
lsmaOffSet : (int) Offset for Least Squares Moving Average
Returns: A tuple with MACD, Signal, and Histgram
fisher(length)
Fisher Transform. Normalize prices into a Gaussian normal distribution.
Parameters:
length
Returns: A tuple with Fisher Transform and signal
fisher(source, length)
Fisher Transform. Customized source. Normalize prices into a Gaussian normal distribution.
Parameters:
source : (float) Source of series (close, high, low, etc.)
length
Returns: A tuple with Fisher Transform and signal
inverseFisher(source, length, subtrahend, denominator)
Inverse Fisher Transform.
Transform the values of the Fisher Transform into a smaller and more easily interpretable scale is
through the application of an inverse transformation to the hyperbolic tangent function.
This transformation takes the values of the FT, which range from -infinity to +infinity,
to a scale limited between -1 and +1, allowing them to be more easily visualized and compared.
Parameters:
source : (float) Source of series (close, high, low, etc.)
length : (int) Period for loopback
subtrahend : (int) Denominator. Useful in unbounded indicators. For example, in CCI.
denominator
Returns: (float) Series of Inverse Fisher Transform
premierStoch(length, smoothlen)
Premier Stochastic Oscillator (PSO).
Normalizes the standard stochastic oscillator by applying a five-period double exponential smoothing
average of the %K value, resulting in a symmetric scale of 1 to -1.
Parameters:
length : (int) Period for loopback
smoothlen : (int) Period for smoothing
Returns: (float) Series of PSO
premierStoch(source, smoothlen, subtrahend, denominator)
Premier Stochastic Oscillator (PSO) of custom source.
Normalizes the source by applying a five-period double exponential smoothing average.
Parameters:
source : (float) Source of series (close, high, low, etc.)
smoothlen : (int) Period for smoothing
subtrahend : (int) Denominator. Useful in unbounded indicators. For example, in CCI.
denominator
Returns: (float) Series of PSO
stochRsi(sourceRSI, lengthRSI, kLength, kSmoothing, dSmoothing, maTypeK, maTypeD, almaOffsetKD, almaSigmaKD, lsmaOffSetKD)
Parameters:
sourceRSI
lengthRSI
kLength
kSmoothing
dSmoothing
maTypeK
maTypeD
almaOffsetKD
almaSigmaKD
lsmaOffSetKD
stochRoc(sourceROC, lengthROC, kLength, kSmoothing, dSmoothing, maTypeK, maTypeD, almaOffsetKD, almaSigmaKD, lsmaOffSetKD)
Parameters:
sourceROC
lengthROC
kLength
kSmoothing
dSmoothing
maTypeK
maTypeD
almaOffsetKD
almaSigmaKD
lsmaOffSetKD
stochUO(fastLength, middleLength, slowLength, kLength, kSmoothing, dSmoothing, maTypeK, maTypeD, almaOffsetKD, almaSigmaKD, lsmaOffSetKD)
Parameters:
fastLength
middleLength
slowLength
kLength
kSmoothing
dSmoothing
maTypeK
maTypeD
almaOffsetKD
almaSigmaKD
lsmaOffSetKD
stochTSI(source, shortLength, longLength, maType, almaOffset, almaSigma, lsmaOffSet, kLength, kSmoothing, dSmoothing, maTypeK, maTypeD, almaOffsetKD, almaSigmaKD, lsmaOffSetKD)
Parameters:
source
shortLength
longLength
maType
almaOffset
almaSigma
lsmaOffSet
kLength
kSmoothing
dSmoothing
maTypeK
maTypeD
almaOffsetKD
almaSigmaKD
lsmaOffSetKD
stochWPR(source, length, kLength, kSmoothing, dSmoothing, maTypeK, maTypeD, almaOffsetKD, almaSigmaKD, lsmaOffSetKD)
Parameters:
source
length
kLength
kSmoothing
dSmoothing
maTypeK
maTypeD
almaOffsetKD
almaSigmaKD
lsmaOffSetKD
stochCCI(source, length, maType, almaOffset, almaSigma, lsmaOffSet, kLength, kSmoothing, dSmoothing, maTypeK, maTypeD, almaOffsetKD, almaSigmaKD, lsmaOffSetKD)
Parameters:
source
length
maType
almaOffset
almaSigma
lsmaOffSet
kLength
kSmoothing
dSmoothing
maTypeK
maTypeD
almaOffsetKD
almaSigmaKD
lsmaOffSetKD
stochMACD(source, fastLength, slowLength, signalLength, maTypeFast, maTypeSlow, maTypeMACD, almaOffset, almaSigma, lsmaOffSet, kLength, kSmoothing, dSmoothing, maTypeK, maTypeD, almaOffsetKD, almaSigmaKD, lsmaOffSetKD)
Parameters:
source
fastLength
slowLength
signalLength
maTypeFast
maTypeSlow
maTypeMACD
almaOffset
almaSigma
lsmaOffSet
kLength
kSmoothing
dSmoothing
maTypeK
maTypeD
almaOffsetKD
almaSigmaKD
lsmaOffSetKD
stochFT(length, kLength, kSmoothing, dSmoothing, maTypeK, maTypeD, almaOffsetKD, almaSigmaKD, lsmaOffSetKD)
Parameters:
length
kLength
kSmoothing
dSmoothing
maTypeK
maTypeD
almaOffsetKD
almaSigmaKD
lsmaOffSetKD
stochVolume(kLength, kSmoothing, dSmoothing, maTypeK, maTypeD, almaOffsetKD, almaSigmaKD, lsmaOffSetKD)
Parameters:
kLength
kSmoothing
dSmoothing
maTypeK
maTypeD
almaOffsetKD
almaSigmaKD
lsmaOffSetKD
stochMFI(source, length, kLength, kSmoothing, dSmoothing, maTypeK, maTypeD, almaOffsetKD, almaSigmaKD, lsmaOffSetKD)
Parameters:
source
length
kLength
kSmoothing
dSmoothing
maTypeK
maTypeD
almaOffsetKD
almaSigmaKD
lsmaOffSetKD
stochOBV(source, kLength, kSmoothing, dSmoothing, maTypeK, maTypeD, almaOffsetKD, almaSigmaKD, lsmaOffSetKD)
Parameters:
source
kLength
kSmoothing
dSmoothing
maTypeK
maTypeD
almaOffsetKD
almaSigmaKD
lsmaOffSetKD
stochPVI(source, kLength, kSmoothing, dSmoothing, maTypeK, maTypeD, almaOffsetKD, almaSigmaKD, lsmaOffSetKD)
Parameters:
source
kLength
kSmoothing
dSmoothing
maTypeK
maTypeD
almaOffsetKD
almaSigmaKD
lsmaOffSetKD
stochNVI(source, kLength, kSmoothing, dSmoothing, maTypeK, maTypeD, almaOffsetKD, almaSigmaKD, lsmaOffSetKD)
Parameters:
source
kLength
kSmoothing
dSmoothing
maTypeK
maTypeD
almaOffsetKD
almaSigmaKD
lsmaOffSetKD
stochPVT(source, kLength, kSmoothing, dSmoothing, maTypeK, maTypeD, almaOffsetKD, almaSigmaKD, lsmaOffSetKD)
Parameters:
source
kLength
kSmoothing
dSmoothing
maTypeK
maTypeD
almaOffsetKD
almaSigmaKD
lsmaOffSetKD
stochVO(shortLen, longLen, maType, almaOffset, almaSigma, lsmaOffSet, kLength, kSmoothing, dSmoothing, maTypeK, maTypeD, almaOffsetKD, almaSigmaKD, lsmaOffSetKD)
Parameters:
shortLen
longLen
maType
almaOffset
almaSigma
lsmaOffSet
kLength
kSmoothing
dSmoothing
maTypeK
maTypeD
almaOffsetKD
almaSigmaKD
lsmaOffSetKD
stochVROC(length, kLength, kSmoothing, dSmoothing, maTypeK, maTypeD, almaOffsetKD, almaSigmaKD, lsmaOffSetKD)
Parameters:
length
kLength
kSmoothing
dSmoothing
maTypeK
maTypeD
almaOffsetKD
almaSigmaKD
lsmaOffSetKD
iftRSI(sourceRSI, lengthRSI, lengthIFT)
Parameters:
sourceRSI
lengthRSI
lengthIFT
iftROC(sourceROC, lengthROC, lengthIFT)
Parameters:
sourceROC
lengthROC
lengthIFT
iftUO(fastLength, middleLength, slowLength, lengthIFT)
Parameters:
fastLength
middleLength
slowLength
lengthIFT
iftStoch(kLength, kSmoothing, dSmoothing, maTypeK, maTypeD, almaOffsetKD, almaSigmaKD, lsmaOffSetKD, lengthIFT)
Parameters:
kLength
kSmoothing
dSmoothing
maTypeK
maTypeD
almaOffsetKD
almaSigmaKD
lsmaOffSetKD
lengthIFT
iftTSI(source, shortLength, longLength, maType, almaOffset, almaSigma, lsmaOffSet, lengthIFT)
Parameters:
source
shortLength
longLength
maType
almaOffset
almaSigma
lsmaOffSet
lengthIFT
iftCCI(source, length, maType, almaOffset, almaSigma, lsmaOffSet, lengthIFT)
Parameters:
source
length
maType
almaOffset
almaSigma
lsmaOffSet
lengthIFT
iftFisher(length, lengthIFT)
Parameters:
length
lengthIFT
iftMACD(source, fastLength, slowLength, signalLength, maTypeFast, maTypeSlow, maTypeMACD, almaOffset, almaSigma, lsmaOffSet, lengthIFT)
Parameters:
source
fastLength
slowLength
signalLength
maTypeFast
maTypeSlow
maTypeMACD
almaOffset
almaSigma
lsmaOffSet
lengthIFT
iftWPR(source, length, lengthIFT)
Parameters:
source
length
lengthIFT
iftMFI(source, length, lengthIFT)
Parameters:
source
length
lengthIFT
iftCMF(length, lengthIFT)
Parameters:
length
lengthIFT
iftVO(shortLen, longLen, maType, almaOffset, almaSigma, lsmaOffSet, lengthIFT)
Parameters:
shortLen
longLen
maType
almaOffset
almaSigma
lsmaOffSet
lengthIFT
iftVROC(length, lengthIFT)
Parameters:
length
lengthIFT
smiRSI(source, length, shortLengthTSI, longLengthTSI, maTypeTSI, almaOffsetTSI, almaSigmaTSI, lsmaOffSetTSI, maTypeSignal, smoothingLengthSignal, almaOffsetSignal, almaSigmaSignal, lsmaOffSetSignal)
Parameters:
source
length
shortLengthTSI
longLengthTSI
maTypeTSI
almaOffsetTSI
almaSigmaTSI
lsmaOffSetTSI
maTypeSignal
smoothingLengthSignal
almaOffsetSignal
almaSigmaSignal
lsmaOffSetSignal
smiROC(source, length, shortLengthTSI, longLengthTSI, maTypeTSI, almaOffsetTSI, almaSigmaTSI, lsmaOffSetTSI, maTypeSignal, smoothingLengthSignal, almaOffsetSignal, almaSigmaSignal, lsmaOffSetSignal)
Parameters:
source
length
shortLengthTSI
longLengthTSI
maTypeTSI
almaOffsetTSI
almaSigmaTSI
lsmaOffSetTSI
maTypeSignal
smoothingLengthSignal
almaOffsetSignal
almaSigmaSignal
lsmaOffSetSignal
smiVROC(length, shortLengthTSI, longLengthTSI, maTypeTSI, almaOffsetTSI, almaSigmaTSI, lsmaOffSetTSI, maTypeSignal, smoothingLengthSignal, almaOffsetSignal, almaSigmaSignal, lsmaOffSetSignal)
Parameters:
length
shortLengthTSI
longLengthTSI
maTypeTSI
almaOffsetTSI
almaSigmaTSI
lsmaOffSetTSI
maTypeSignal
smoothingLengthSignal
almaOffsetSignal
almaSigmaSignal
lsmaOffSetSignal
smiWPR(source, length, shortLengthTSI, longLengthTSI, maTypeTSI, almaOffsetTSI, almaSigmaTSI, lsmaOffSetTSI, maTypeSignal, smoothingLengthSignal, almaOffsetSignal, almaSigmaSignal, lsmaOffSetSignal)
Parameters:
source
length
shortLengthTSI
longLengthTSI
maTypeTSI
almaOffsetTSI
almaSigmaTSI
lsmaOffSetTSI
maTypeSignal
smoothingLengthSignal
almaOffsetSignal
almaSigmaSignal
lsmaOffSetSignal
smiFT(length, shortLengthTSI, longLengthTSI, maTypeTSI, almaOffsetTSI, almaSigmaTSI, lsmaOffSetTSI, maTypeSignal, smoothingLengthSignal, almaOffsetSignal, almaSigmaSignal, lsmaOffSetSignal)
Parameters:
length
shortLengthTSI
longLengthTSI
maTypeTSI
almaOffsetTSI
almaSigmaTSI
lsmaOffSetTSI
maTypeSignal
smoothingLengthSignal
almaOffsetSignal
almaSigmaSignal
lsmaOffSetSignal
smiFT(source, length, shortLengthTSI, longLengthTSI, maTypeTSI, almaOffsetTSI, almaSigmaTSI, lsmaOffSetTSI, maTypeSignal, smoothingLengthSignal, almaOffsetSignal, almaSigmaSignal, lsmaOffSetSignal)
Parameters:
source
length
shortLengthTSI
longLengthTSI
maTypeTSI
almaOffsetTSI
almaSigmaTSI
lsmaOffSetTSI
maTypeSignal
smoothingLengthSignal
almaOffsetSignal
almaSigmaSignal
lsmaOffSetSignal
smiCCI(source, length, maTypeCCI, almaOffsetCCI, almaSigmaCCI, lsmaOffSetCCI, shortLengthTSI, longLengthTSI, maTypeTSI, almaOffsetTSI, almaSigmaTSI, lsmaOffSetTSI, maTypeSignal, smoothingLengthSignal, almaOffsetSignal, almaSigmaSignal, lsmaOffSetSignal)
Parameters:
source
length
maTypeCCI
almaOffsetCCI
almaSigmaCCI
lsmaOffSetCCI
shortLengthTSI
longLengthTSI
maTypeTSI
almaOffsetTSI
almaSigmaTSI
lsmaOffSetTSI
maTypeSignal
smoothingLengthSignal
almaOffsetSignal
almaSigmaSignal
lsmaOffSetSignal
smiUO(fastLength, middleLength, slowLength, shortLengthTSI, longLengthTSI, maTypeTSI, almaOffsetTSI, almaSigmaTSI, lsmaOffSetTSI, maTypeSignal, smoothingLengthSignal, almaOffsetSignal, almaSigmaSignal, lsmaOffSetSignal)
Parameters:
fastLength
middleLength
slowLength
shortLengthTSI
longLengthTSI
maTypeTSI
almaOffsetTSI
almaSigmaTSI
lsmaOffSetTSI
maTypeSignal
smoothingLengthSignal
almaOffsetSignal
almaSigmaSignal
lsmaOffSetSignal
smiMACD(source, fastLength, slowLength, signalLength, maTypeFast, maTypeSlow, maTypeMACD, almaOffset, almaSigma, lsmaOffSet, shortLengthTSI, longLengthTSI, maTypeTSI, almaOffsetTSI, almaSigmaTSI, lsmaOffSetTSI, maTypeSignal, smoothingLengthSignal, almaOffsetSignal, almaSigmaSignal, lsmaOffSetSignal)
Parameters:
source
fastLength
slowLength
signalLength
maTypeFast
maTypeSlow
maTypeMACD
almaOffset
almaSigma
lsmaOffSet
shortLengthTSI
longLengthTSI
maTypeTSI
almaOffsetTSI
almaSigmaTSI
lsmaOffSetTSI
maTypeSignal
smoothingLengthSignal
almaOffsetSignal
almaSigmaSignal
lsmaOffSetSignal
smiVol(shortLengthTSI, longLengthTSI, maTypeTSI, almaOffsetTSI, almaSigmaTSI, lsmaOffSetTSI, maTypeSignal, smoothingLengthSignal, almaOffsetSignal, almaSigmaSignal, lsmaOffSetSignal)
Parameters:
shortLengthTSI
longLengthTSI
maTypeTSI
almaOffsetTSI
almaSigmaTSI
lsmaOffSetTSI
maTypeSignal
smoothingLengthSignal
almaOffsetSignal
almaSigmaSignal
lsmaOffSetSignal
smiMFI(source, length, shortLengthTSI, longLengthTSI, maTypeTSI, almaOffsetTSI, almaSigmaTSI, lsmaOffSetTSI, maTypeSignal, smoothingLengthSignal, almaOffsetSignal, almaSigmaSignal, lsmaOffSetSignal)
Parameters:
source
length
shortLengthTSI
longLengthTSI
maTypeTSI
almaOffsetTSI
almaSigmaTSI
lsmaOffSetTSI
maTypeSignal
smoothingLengthSignal
almaOffsetSignal
almaSigmaSignal
lsmaOffSetSignal
smiCMF(length, shortLengthTSI, longLengthTSI, maTypeTSI, almaOffsetTSI, almaSigmaTSI, lsmaOffSetTSI, maTypeSignal, smoothingLengthSignal, almaOffsetSignal, almaSigmaSignal, lsmaOffSetSignal)
Parameters:
length
shortLengthTSI
longLengthTSI
maTypeTSI
almaOffsetTSI
almaSigmaTSI
lsmaOffSetTSI
maTypeSignal
smoothingLengthSignal
almaOffsetSignal
almaSigmaSignal
lsmaOffSetSignal
smiOBV(source, shortLengthTSI, longLengthTSI, maTypeTSI, almaOffsetTSI, almaSigmaTSI, lsmaOffSetTSI, maTypeSignal, smoothingLengthSignal, almaOffsetSignal, almaSigmaSignal, lsmaOffSetSignal)
Parameters:
source
shortLengthTSI
longLengthTSI
maTypeTSI
almaOffsetTSI
almaSigmaTSI
lsmaOffSetTSI
maTypeSignal
smoothingLengthSignal
almaOffsetSignal
almaSigmaSignal
lsmaOffSetSignal
smiPVT(source, shortLengthTSI, longLengthTSI, maTypeTSI, almaOffsetTSI, almaSigmaTSI, lsmaOffSetTSI, maTypeSignal, smoothingLengthSignal, almaOffsetSignal, almaSigmaSignal, lsmaOffSetSignal)
Parameters:
source
shortLengthTSI
longLengthTSI
maTypeTSI
almaOffsetTSI
almaSigmaTSI
lsmaOffSetTSI
maTypeSignal
smoothingLengthSignal
almaOffsetSignal
almaSigmaSignal
lsmaOffSetSignal
smiVO(shortLen, longLen, maType, almaOffset, almaSigma, lsmaOffSet, shortLengthTSI, longLengthTSI, maTypeTSI, almaOffsetTSI, almaSigmaTSI, lsmaOffSetTSI, maTypeSignal, smoothingLengthSignal, almaOffsetSignal, almaSigmaSignal, lsmaOffSetSignal)
Parameters:
shortLen
longLen
maType
almaOffset
almaSigma
lsmaOffSet
shortLengthTSI
longLengthTSI
maTypeTSI
almaOffsetTSI
almaSigmaTSI
lsmaOffSetTSI
maTypeSignal
smoothingLengthSignal
almaOffsetSignal
almaSigmaSignal
lsmaOffSetSignal
smiPVI(source, shortLengthTSI, longLengthTSI, maTypeTSI, almaOffsetTSI, almaSigmaTSI, lsmaOffSetTSI, maTypeSignal, smoothingLengthSignal, almaOffsetSignal, almaSigmaSignal, lsmaOffSetSignal)
Parameters:
source
shortLengthTSI
longLengthTSI
maTypeTSI
almaOffsetTSI
almaSigmaTSI
lsmaOffSetTSI
maTypeSignal
smoothingLengthSignal
almaOffsetSignal
almaSigmaSignal
lsmaOffSetSignal
smiNVI(source, shortLengthTSI, longLengthTSI, maTypeTSI, almaOffsetTSI, almaSigmaTSI, lsmaOffSetTSI, maTypeSignal, smoothingLengthSignal, almaOffsetSignal, almaSigmaSignal, lsmaOffSetSignal)
Parameters:
source
shortLengthTSI
longLengthTSI
maTypeTSI
almaOffsetTSI
almaSigmaTSI
lsmaOffSetTSI
maTypeSignal
smoothingLengthSignal
almaOffsetSignal
almaSigmaSignal
lsmaOffSetSignal
rsiVolume(length)
Parameters:
length
rsiMA(sourceMA, lengthMA, maType, almaOffset, almaSigma, lsmaOffSet, lengthRSI)
Parameters:
sourceMA
lengthMA
maType
almaOffset
almaSigma
lsmaOffSet
lengthRSI

RedK EVEREX - Effort Versus Results ExplorerRedK EVEREX is an experimental indicator that explores "Volume Price Analysis" basic concepts and Wyckoff law "Effort versus Result" - by inspecting the relative volume (effort) and the associated (relative) price action (result) for each bar - showing the analysis as an easy to read "stacked bands" visual. From that analysis, we calculate a "Relative Rate of Flow" - an easy to use +100/-100 oscilator that can be used to trigger a signal when a bullish or bearish mode is detected for a certain user-selected length of bars.
Basic Concepts of VPA
-------------------------------
(The topics of VPA & Wyckoff Effort vs Results law are too comprehensive to cover here - So here's just a very basic summary - please review these topics in detail in various sources available here in TradingView or on the web)
* Volume Price Analysis (VPA) is the examination of the number of shares or contracts of a security that have been traded in a given period, and the associated price movement. By analyzing trends in volume in conjunction with price movements, traders can determine the significance of changes in price and what may unfold in the near future.
* Oftentimes, high volumes of trading can infer a lot about investors’ outlook on a market or security. A significant price increase along with a significant volume increase, for example, could be a credible sign of a continued bullish trend or a bullish reversal. Adversely, a significant price decrease with a significant volume increase can point to a continued bearish trend or a bearish trend reversal.
* Incorporating volume into a trading decision can help an investor to have a more balanced view of all the broad market factors that could be influencing a security’s price, which helps an investor to make a more informed decision.
* Wyckoff's law "Effort versus results" dictates that large effort is expected to be accompanied with big results - which means that we should expect to see a big price move (result) associated with a large relative volume (effort) for a certain trading period (bar).
* The way traders use this concept in chart analysis is to mainly look for imbalances or invalidation. for example, when we observe a large relative volume that is associated with very limited price change - that should trigger an early flag/warning sign that the current price trend is facing challenges and may be an early sign of "reversal" - this applies in both bearish and bullish conditions. on the other hand, when price starts to trend in a certain direction and that's associated with increasing volume, that can act as kind of validation, or a confirmation that the market supports that move.
How does EVEREX work
---------------------------------
* EVEREX inspects each bar and calculates a relative value for volume (effort) and "strength of price movement" (result) compared to a specified lookback period. The results are then visualized as stacked bands - the lower band represents the relative volume, the upper band represents the relative price strength - with clear color coding for easier analysis.
* The scale of the band is initially set to 100 (each band can occupy up to 50) - and that can be changed in the settings to 200 or 400 - mainly to allow a "zoom in" on the bands.
* Reading the resulting stacked bands makes it easier to see "balanced" volume/price action (where both bands are either equally strong, or equally weak), or when there's imbalance between volume and price (for example, a compression bar will show with high volume band and very small/tiny price action band) - another favorite pattern in VPA is the "Ease of Move", which will show as a relatively small volume band associated with a large "price action band" (either bullish or bearish) .. and so on.
* a bit of a techie piece: why the use of a custom "Normalize()" function to calculate "relative" values in EVEREX?
When we evaluate a certain value against an average (for example, volume) we need a mechanism to deal with "super high" values that largely exceed that average - I also needed a mechanism that mimics how a trader looks at a volume bar and decides that this volume value is super low, low, average, above average, high or super high -- the issue with using a stoch() function, which is the usual technique for comparing a data point against a lookback average, is that this function will produce a "zero" for low values, and cause a large distortion of the next few "ratios" when super large values occur in the data series - i researched multiple techniques here and decided to use the custom Normalize() function - and what i found is, as long as we're applying the same formula consistently to the data series, since it's all relative to itself, we can confidently use the result. Please feel free to play around with this part further if you like - the code is commented for those who would like to research this further.
* Overall, the hope is to make the bar-by-bar analysis easier and faster for traders who apply VPA concepts in their trading
What is RROF?
--------------------------
* Once we have the values of relative volume and relative price strength, it's easy from there to combine these values into a moving index that can be used to track overall strength and detect reversals in market direction - if you think about it this a very similar concept to a volume-weighted RSI. I call that index the "Relative Rate of Flow" - or RROF (cause we're not using the direct volume and price values in the calculation, but rather relative values that we calculated with the proprietary "Normalize" function in the script.
* You can show RROF as a single or double-period - and you can customize it in terms of smoothing, and signal line - and also utilize the basic alerts to get notified when a change in strength from one side to the other (bullish vs bearish) is detected
* In the chart above, you can see how the RROF was able to detect change in market condition from Bearsh to Bullish - then from Bullish to Bearish for TSLA with good accuracy.
Other Usage Options in EVEREX
------------------------------------
* I wrote EVEREX with a lot of flexibility and utilization in mind, while focusing on a clean and easy to use visual - EVEREX should work with any time frame and any instrument - in instruments with no volume data, only price data will be used.
* You can completely hide the "EVEREX bands" and use EVEREX as a single or dual period strength indicator (by exposing the Bias/Sentiment plot which is hidden by default) -
here's how this setup would look like - in this mode, you will basically be using EVEREX the same way you're using a volume-weighted RSI
* or you can hide the bias/sentiment, and expose the Bulls & Bears plots (using the indicator's "Style" tab), and trade it like a Bull/Bear Pressure Index like this
* you can choose Moving Average type for most plot elements in EVEREX, including how to deal with the Lookback averaging
* you can set EVEREX to a different time frame than the chart
* did i mention basic alerts in this v1.0 ?? There's room to add more VPA-specific alerts in future version (for example, when Ease-of-Move or Compression bars are detected...etc) - let me know if the comments what you want to see
Final Thoughts
--------------------
* EVEREX can be used for bar-by-bar VPA analysis - There are so much literature out there about VPA and it's highly recommended that traders read more about what VPA is and how it works - as it adds an interesting (and critical) dimension to technical analysis and will improve decision making
* RROF is a "strength indicator" - it does not track price values (levels) or momentum - as you will see when you use it, the price can be moving up, while the RROF signal line starts moving down, reflecting decreasing strength (or otherwise, increasing bear strength) - So if you incorporate EVEREX in your trading you will need to use it alongside other momentum and price value indicators (like MACD, MA's, Trend Channels, Support & Resistance Lines, Fib / Donchian..etc) - to use for trade confirmation

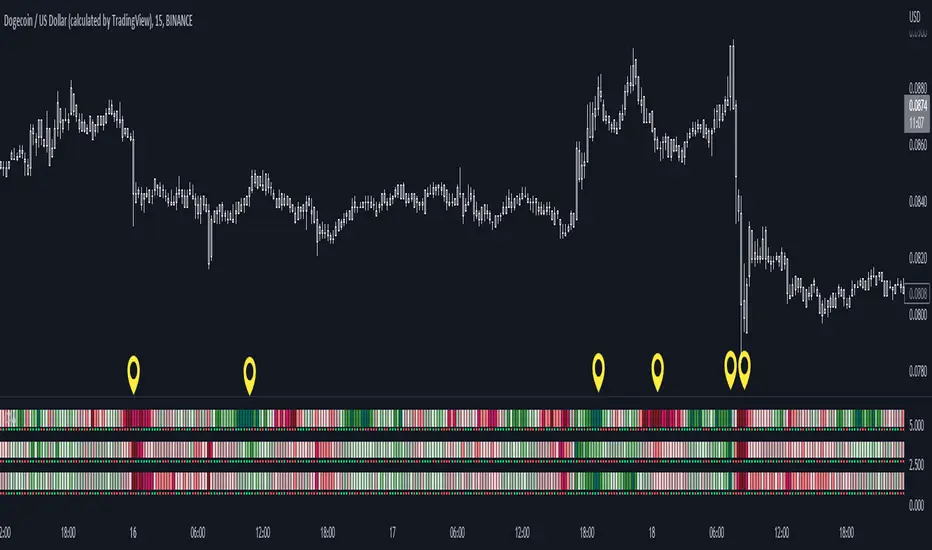
Color Agreement Aggregate (CAA)This indicator helps finding patterns within market structure in a highly intuitive manner.
It does this by painting a picture instead of presenting numerical values.
It greatly reduces noise in trend/structure analysis.
----- HOW TO USE IT -----
1) Zoom out of chart to get a clearer picture of overall color patterns.
2) Consider areas of intense reds and greens as areas of interest.
3) There is always a pattern of intense reds followed by intense greens. Consider this pattern as the start of a new cycle.
4) Key spikes and dips are shown when all 3 bands are matching of intense colors.
5) Turn on Precision in the Style tab to get more information on decisive spikes in price (See "Precision" below).
Reach (top band):
This is the fast and more volatile movement of the market. It shows the direction in which the recent price action is reaching towards.
Energy (middle band):
This is the medium speed of market movement. It shows the energy of the Reach and how influential it is to market change.
Frequent and intense change of color in this band can be a precursor of change within the Basis.
Basis (bottom band):
This is the slower, broader movement of the market. It is the basis on which the Reach and Energy sit on.
Intense colors in this band show major changes in price levels and market structure.
Precision:
Precision shows the weaker levels of colors. It does this by making bars in a band half its size.
For example, if there is a light green bar that is half, it means that the current bar is on the weaker level of the light green level.
Precision helps in identifying where there are influential moves in price action. Note, there will never be a half-sized bar in the highest and lowest levels.
This is because these levels are the limits and don't have a weaker half.
See notes in chart for more information. Note, you can turn off the labels in the Style tab.
----- HOW THIS INDICATOR IS ORIGINAL; WHAT IT DOES AND HOW IT DOES IT -----
This indicator has an original, unique ability to paint the overall market structure in a highly intuitive manner. It "paints" an image instead of showing numbers.
It does this by color-coding different levels of varying speeds of market movement. It then presents these levels as simple bars.
Finally, it stacks them all and creates an overall image of clear breaks and/or repeats within market structure.
This greatly reduces noise in pattern finding, finding breaks in market structure, and in confirming repeated patterns.
----- VERSION -----
The only significant information from this indicator are the colors themselves and the patterns, agreement, and aggregate of the colors.
This indicator does not provide any numerical information of the underlying, mathematical calculations.
The levels for the Reach are made by the KPAM; for the Energy, the CCI; and for the Basis, the RSI.
However, this indicator is not a variant, replacement, or presentation of the KPAM, CCI, or the RSI in any way, shape, or form -- this indicator does not present itself as such.
The 3 indicators are only useful to this indicator in as much as they are what the colors are derived from -- nothing more.
They are needed in order to obtain, visualize, and create the overall aggregate and agreement of colors.
Thus, the KPAM, CCI, and RSI cannot be adjust nor are they plotted. They are not, in any way, a focus of this indicator.
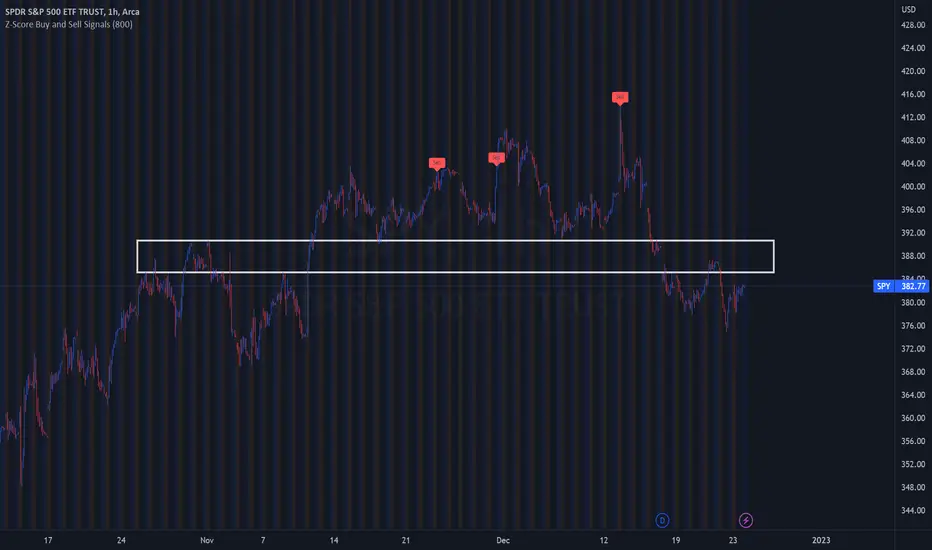
Z-Score Buy and Sell SignalsHello everyone!
Happy Holidays, Merry/Happy Christmas!
Here is my Christmas gift to you to show my appreciation of your support and engagement over the past year!
This is the Z-Score Buy and Sell Signal indicator!
How it works:
It works by looking at the Z-Score of an equities close price and looking for previous areas over reversals over the defined period of time.
It also looks at areas that are overbought or oversold (manifested by Z-Scores greater than or less than 2 Standard Deviations away) and displays them as bar colour changes.
Historic reversals are signaled with buy and/or sell signals.
Oversold is signaled with a green bar colour change (colour can be customaized).
Overbought is signaled with an orange bar colour change.
How to use it:
You can use it with support resistance or other indicators. You can use this on both the larger and small timeframes, depending on the style of trader you are.
You can modify the input length to look back on shorter or longer periods.
As a general rule from my experience using it, if you are using the shorter timeframes (i.e. 1 minute tfs), its best to look back between 50 and 75 candles for most equities.
If you are looking at the larger timeframes (i.e. Daily, 1 to 2 hour, etc.) its best to set the input value to between 500 to 800.
But, as always, you should check to ensure the indicator is providing correct signals by reviewing the previous signals to ensure that they adequate identified reversals.
It is also best not to use this alone as your sole indicator. It is meant to be supplementary to other indicators/support resistance/chart patterns you are using to guide your trades. This will not replace good TA and a good understand of the stock and its likely trajectory.
As always, please feel free to share your comments/feedback/questions and recommendations below.
As always, I do customary tutorial videos for my indicators, so please see below for an in-depth video tutorial should you want to see it in action:
Otherwise, happy holidays everyone! And all of the best over this Christmas weekend to you and your loved ones!
TPO Market Profile [Kioseff Trading]REPOST; SCRIPT WORKS!!
Due to technical error, this script was republished! Thank you for your support (:
Hello!
This indicator comprises a real time TPO Market Profile!
The script works on any timeframe 1 second or greater - the script calculates relative to the timeframe selected for your chart.
The image above shows the 1-minute BTCUSD chart; 650 +/- tick levels are set.
To see the script in full functionality - try using bar replay on a cryptocurrency 1-minute chart (start at the beginning of a regular hours session). Be sure to adjust the tick spread if necessary (:
So far, the script's held up in real time - I've not had any array loop errors or timeouts. The TPO profile updates accordingly with changes in time / high and low prices. Letters are appended to the profile in real time.
The image above shows configurations for the indicator. I plan to update the indicator quite a bit over the coming days - more to come.
You can select the timeframe change the indicator accounts for. For instance, you can have set the indicator to reset every day, every 30 minutes, every 5 minutes, every week, month, etc.
In the image above, I configured the indicator to recalculate every 3 months. Consequently, the indicator will record a TPO profile for three consecutive, reset, then record a TPO profile for the next 3 months. This setting makes the indicator compatible with any timeframe greater than 1 minute.
You can also use a drag & drop time-start bar to modify the starting point for the market profile TPO calculation.
The indicator hosts an option to auto calculate the tick spread between levels. However, as you switch timeframes and assets, sometimes, you'll have to manually set the tick range (:
Thanks for checking it out; more to come!
Sep 4
Release Notes: UPDATE: The indicator can work on seconds-based charts.
The image above shows the indicator working on the 1-second chart.
(Screenshot is old; characters are now numbered instead of strange unicode)
Release Notes: Added value area + vah + val. Font update. Changed characters to numbered once the alphabet is exhausted. POC, VAH, and VAL label located left of the first bar of the interval. Initial balance range can be toggled. Spaced the characters (more legible). Quite a bit of aesthetic changes so check it out!
Soon, I'll release a version of the script that shows VAH, POC, VAL, and TPO letters from previous sessions. I coded this feature into this indicator; however, it was removed due to load time complications. This feature will be its own script (:
If the script has trouble loading please let me know (:

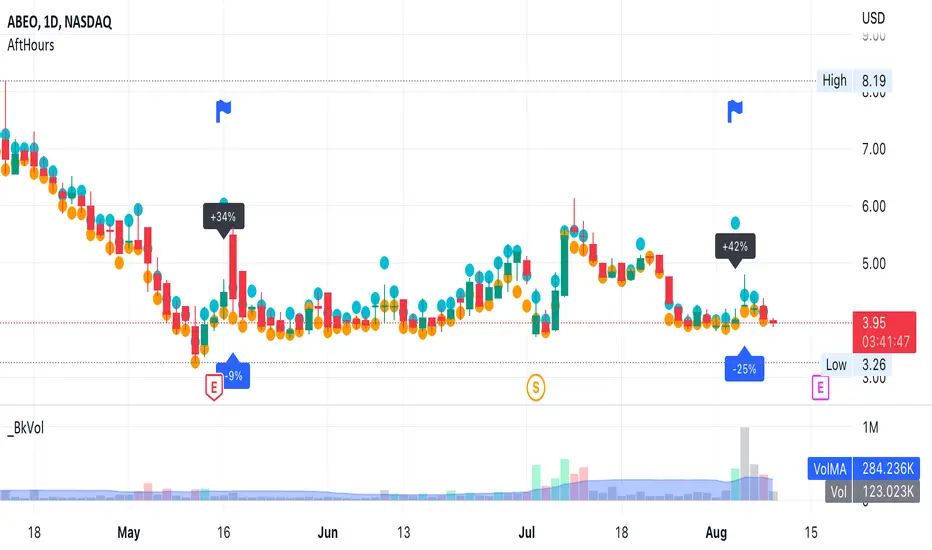
AfterHours Spike DetectorThe script pulls Lower Timeframe (30min) data to draw High/Low of Out-of-hours/AfterHours session (post-market session & next day pre-market session) on the Daily regular session chart. It then identifies significant AfterHours price changes and what happens to these price Spikes by the Open of the next day regular session.
You can change:
wether to show AfterHours High/Lows
wether to show AfterHours price Spikes
the AfterHours price Spike threshold (default = +/- 10%)
Jurik CFB Adaptive QQE [Loxx]Jurik CFB Adaptive QQE is a Double Jurik-Filtered, Composite Fractal Behavior (CFB) adaptive, Qualitative Quantitative Estimation indicator. This indicator includes both fixed and the CFB adaptive calculations as well as three different types of RSI calculations including Jurik's RSX.
What is Qualitative Quantitative Estimation (QQE)?
The Qualitative Quantitative Estimation (QQE) indicator works like a smoother version of the popular Relative Strength Index ( RSI ) indicator. QQE expands on RSI by adding two volatility based trailing stop lines. These trailing stop lines are composed of a fast and a slow moving Average True Range (ATR).
There are many indicators for many purposes. Some of them are complex and some are comparatively easy to handle. The QQE indicator is a really useful analytical tool and one of the most accurate indicators. It offers numerous strategies for using the buy and sell signals. Essentially, it can help detect trend reversal and enter the trade at the most optimal positions.
What is Wilders' RSI?
The Relative Strength Index ( RSI ) is a well versed momentum based oscillator which is used to measure the speed (velocity) as well as the change (magnitude) of directional price movements. Essentially RSI , when graphed, provides a visual mean to monitor both the current, as well as historical, strength and weakness of a particular market. The strength or weakness is based on closing prices over the duration of a specified trading period creating a reliable metric of price and momentum changes. Given the popularity of cash settled instruments (stock indexes) and leveraged financial products (the entire field of derivatives); RSI has proven to be a viable indicator of price movements.
What is RSX RSI?
RSI is a very popular technical indicator, because it takes into consideration market speed, direction and trend uniformity. However, the its widely criticized drawback is its noisy (jittery) appearance. The Jurk RSX retains all the useful features of RSI , but with one important exception: the noise is gone with no added lag.
What is Rapid RSI?
Rapid RSI Indicator, from Ian Copsey's article in the October 2006 issue of Stocks & Commodities magazine.
RapidRSI resembles Wilder's RSI , but uses a SMA instead of a WilderMA for internal smoothing of price change accumulators.
What is Composite Fractal Behavior (CFB)?
All around you mechanisms adjust themselves to their environment. From simple thermostats that react to air temperature to computer chips in modern cars that respond to changes in engine temperature, r.p.m.'s, torque, and throttle position. It was only a matter of time before fast desktop computers applied the mathematics of self-adjustment to systems that trade the financial markets.
Unlike basic systems with fixed formulas, an adaptive system adjusts its own equations. For example, start with a basic channel breakout system that uses the highest closing price of the last N bars as a threshold for detecting breakouts on the up side. An adaptive and improved version of this system would adjust N according to market conditions, such as momentum, price volatility or acceleration.
Since many systems are based directly or indirectly on cycles, another useful measure of market condition is the periodic length of a price chart's dominant cycle, (DC), that cycle with the greatest influence on price action.
The utility of this new DC measure was noted by author Murray Ruggiero in the January '96 issue of Futures Magazine. In it. Mr. Ruggiero used it to adaptive adjust the value of N in a channel breakout system. He then simulated trading 15 years of D-Mark futures in order to compare its performance to a similar system that had a fixed optimal value of N. The adaptive version produced 20% more profit!
This DC index utilized the popular MESA algorithm (a formulation by John Ehlers adapted from Burg's maximum entropy algorithm, MEM). Unfortunately, the DC approach is problematic when the market has no real dominant cycle momentum, because the mathematics will produce a value whether or not one actually exists! Therefore, we developed a proprietary indicator that does not presuppose the presence of market cycles. It's called CFB (Composite Fractal Behavior) and it works well whether or not the market is cyclic.
CFB examines price action for a particular fractal pattern, categorizes them by size, and then outputs a composite fractal size index. This index is smooth, timely and accurate
Essentially, CFB reveals the length of the market's trending action time frame. Long trending activity produces a large CFB index and short choppy action produces a small index value. Investors have found many applications for CFB which involve scaling other existing technical indicators adaptively, on a bar-to-bar basis.
What is Jurik Volty used in the Juirk Filter?
One of the lesser known qualities of Juirk smoothing is that the Jurik smoothing process is adaptive. "Jurik Volty" (a sort of market volatility ) is what makes Jurik smoothing adaptive. The Jurik Volty calculation can be used as both a standalone indicator and to smooth other indicators that you wish to make adaptive.
What is the Jurik Moving Average?
Have you noticed how moving averages add some lag (delay) to your signals? ... especially when price gaps up or down in a big move, and you are waiting for your moving average to catch up? Wait no more! JMA eliminates this problem forever and gives you the best of both worlds: low lag and smooth lines.
Ideally, you would like a filtered signal to be both smooth and lag-free. Lag causes delays in your trades, and increasing lag in your indicators typically result in lower profits. In other words, late comers get what's left on the table after the feast has already begun.
Included
-Toggle bar color on/off

Delta Volume by SiddWolfDelta Volume is Difference between Buying Volume and Selling Volume. This indicator gives the Delta Volume based on Lower TimeFrame Candles. It utilizes security_lower_tf() function, a function that provides Lower TF candle data in Higher TF Chart.
security_lower_tf() is a new function provided by TradingView yesterday. If you are a PineScript Programmer, I suggest you to read about it, as it is a very powerful function that can extremely improve your trading strategy.
How this indicator works:
This indicator checks volume data on lower TimeFrame Candles and Shows it's delta in the current Chart Timeframe. For example: If you open 4 hours chart, this indicator checks volume of 1 minute chart and separates Buying-Selling volume. Then it subtracts Candle's Selling volume from Candle's Buying volume, finally calculating the Delta Volume.
This indicator also provides a Smooth Delta Volume, which is moving average of Delta Volume. As Delta Volume changes a lot, Smooth Delta Volume can be very helpful for identifying Trends . Goto settings and in "Show" section select "Smooth Delta Volume" to lay it on the chart.
Settings is the Key:
Settings are key to all of my indicators. Play around with it a bit. You can change what to show on the chart from settings. Smooth Delta Volume moving average length can be changed from the settings. You can also select "Show as Percentage", which shows Delta Volume as Percentage of Overall Candle's Volume. If you use Weekly or Monthly Timeframe, change increase lower timeframe from settings. Read the tooltips to understand what each settings mean. Tooltips are the (i) button in-front of each settings.
FAQs:
Q. Does the indicator Repaint ?
--- No. None of my indicators repaints. What you see now is what's drawn in real time.
Q. What TimeFrame is Best for this Indicator ?
--- It can be used on timeframes from 5 minutes to higher. But I would prefer to use it from timeframes higher than 30 minutes, as it gathers data from 1 minute TF.
Q. Indicator doesn't show anything ?
--- This indicator only works on security with Volume data. Also use it from higher timeframe than specified in Settings, because Volume Delta is calculated using Data from Lower TimeFrame.
Q. Delta volume is not provided by TradingView, So how exactly does this indicator work?
--- This indicator takes advantage of new pinescript function security_lower_tf(), and calculates volume for smaller timeframe data and calculates delta on higher timeframe.
Q. Does this indicator give financial advice?
--- No. Nope. Nein. Não. नहीं.
Conclusion:
This indicator is very basic but if used correctly it can be very powerful. If you have any questions or suggestions feel free to comment below. I'd love to connect with you. Thank you.
~ @SiddWolf

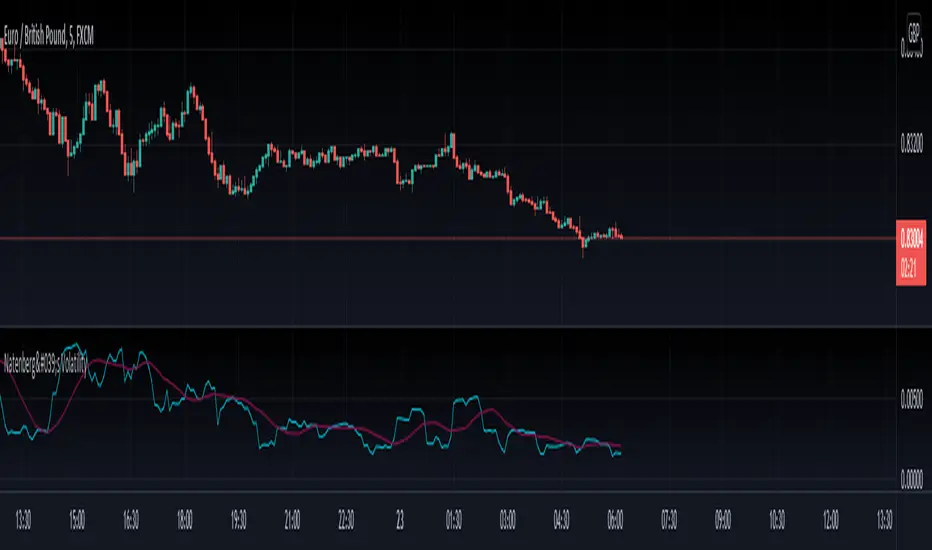
Natenberg's VolatilityThis indicator is historical volatility indicator created by Sheldon Natenberg , as the standard deviation of the logarithmic price changes measured at regular intervals of time.
In Mr. Natenberg's book, Option Volatility & Pricing, he covers volatility in detail and gives the formula for computing historical volatility.
My changes :
I didn't changed formula, i just added smooth version of volatility it can be used as trigger when cross(over/under) non-smoothed volatility.
Note:
There is two formulas for daily and weekly. Indicator showing only daily formula !
Who wants to display the weekly formula change line 17, namely remove "//"
Enjoy!
Kirill ChannelThis indicator shows overbought and oversold zones. Can be used on all time frames. I personally use 15m - 30m.
How to apply ?:
- There can be many strategies for use! I use this indicator to buy an asset in the green zone and then sell it in the middle of the channel or in the red zone.
- I strongly advise against entering counter-trend positions in a growing market if you have little trading experience and understanding of price action.
How do I place orders ?:
- I place orders in a grid.
- If the price is very close to the edge, but it is difficult to reach it, then it is better to open a position on the market and place orders deep into the grid.
- If the price is at the edge of the channel for a very long time, then you need to look at a higher timeframe.
Algorithm composition:
- ALMA
- Keltner Channel
- Fibonacci Retracement
- Custom price percent offset calculations and manipulations.
Settings:
- I strongly do not recommend changing ALMA. These numbers have been specially calculated.
- It's better not to change Borders either. The current algorithm dynamically changes the width of the extreme channels depending on the price movement.
- The Keltner Channel was specially selected.
- Fibonacci Retracement can be changed. This part of the algorithm can be modified to suit your needs. At the moment, there are settings for aggressive trading.
Channel type:
- Conservative: Fibonacci Retracement settings (100 ma, 100 atr, 8 mult, 100 smooth)
- Aggressive: Fibonacci Retracement settings (25 ma, 25 atr, 3.5 mult, 100 smooth)
Сonservative channel does not allow a large number of points to enter positions, however, it is more straightforward and safer for very large movements.
I prefer aggressive settings because they allow me to make more profit on the number of trades.
Try to use both modes and choose what is preferable for you.

Doji Hunter█ OVERVIEW
This script is built to search for 8 different Doji candlestick patterns in markets and makes them appear on screen with bar coloring and creating color-coded labels/shapes. It will identify the following variants based upon user input for various rules to abide by:
Gapping Up
Gapping Down
Gravestone
Dragonfly
Long-Legged
Rickshaw Man
Northern (Doji in uptrend)
Southern (Doji in downtrend)
Note: for the remainder of this description, the types for inputs will be marked by italic text.
█ OPTIONS
This script features a wide range of options available to the user to modify how it functions. The first set of inputs dictate how the trend analysis is done with moving averages. The second and third sets of inputs dictate specific rules for how Doji candles are analyzed and the colors used for when they appear.
█ INPUTS (short)
1 — Moving Average Rules:
The Northern and Southern Doji variants require some trend analysis which will be done by Moving Averages. The inputs in this section change various things about the moving average(s) to be used. In the second section of inputs, there is one boolean option that will nullify the need for trend detection and consolidates the Northern and Southern Doji variants into one.
2/3 — Doji Rules and Colors:
The next two sections of inputs correspond to the various rules that dictate how various doji variants will be analyzed, as well as the colors that correspond to each variant. The colors will also apply to each of the labels/shapes used.
4 — Diagnostics:
The last boolean will allow the user to see extra detail with regards to how and when dojis are detected. Note: This is not a part of any prior section and is simply included as a last functional item to the list of all inputs.
An example of multiple labels being shown on screen for various types of Dojis (DJI 1D chart):
█ INPUTS (extended)
1 — Moving Average Rules:
This section consists of 10 different inputs specific to the rules on how the moving average functions for trend analysis.
"Trend Rule" ( string list) determines which Moving Average will be used for trend detection. It has 3 options: "MA 1", "MA 2", or "BOTH". The second input "Trend Source" determines which OHLC (or combination) value to use in comparison to either MA 1 or MA 2 (EX: Trend Rule -> "MA 1" and Trend Source -> "close": if close > MA 1 -> uptrend, downtrend otherwise). If "BOTH" is selected then "Trend Source" is ignored and added nuance in the script ensures that the shorter MA being above the longer MA yields an uptrend (downtrend otherwise).
The next 8 inputs focus on 4 different parts of both MA 1 and 2.
Length ( integer(s) )
Color
Switch between SMA/EMA ( boolean(s) )
Source for MA
Note: Additional attention to detail has been made here as trend direction is ignored if "BOTH" is selected for the MA Rules and the lengths of both Moving Averages are set to be the same.
2/3 — Doji Rules and Colors:
The next two sections include 19 inputs that are related to how this script will analyze and identify the different variants of Doji candles.
"Identify Pattern On Close" ( boolean ) modifies which candles are to be used for determining when Doji candles are recognized. This changes an offset used for historical reference on some global variables which will force the script to only identify patterns after the current candle has closed.
"Doji Body Tolerance" ( float ) tells the script the maximum % the candle body may be of the high-low range to be considered a Doji candle.
"Doji Wick Sample" ( integer ) defines how many prior candles to sample from in calculating the current average upper and lower wick sizes.
"Simplify Northern/Southern Dojis" ( boolean ) makes this script ignore trend direction for Doji detection and consolidates Northern and Southern Dojis into being recognized as the same. This has an added effect of removing the plotted moving averages from the screen.
"Northern/Southern Display" ( string list ) that has multiple options for how Northern and Southern Dojis will be displayed on screen. Because of how labels may be extremely taxing on TradingView's servers to display, the default setting is "shapes" where Northern and Southern (N/S) Dojis will be marked with a colored triangle at the top of the candle. If "Simplify Northern/Southern Dojis" is true, all N/S Dojis will be marked with an x-cross instead. Other options include "labels" which enables the use of labels accompanied by their respective tooltip and color, or "none" where N/S Dojis will be only noticeable by their changed barcolor.
"Allow Gravestone/Dragonfly Shadows" ( boolean ) allows a bit of additional nuance to the definition of Gravestone or Dragonfly Dojis with small shadows.
"Gravestone/Dragonfly Shadow Tolerance" ( float ) defines the maximum % that the lower wick/upper wick (respectively) may be relative to the high-low range for Gravestone or Dragonfly Dojis to still be considered valid.
"Doji Long Wick Setting" ( string list) is a list of settings for three different ways of confirming if a Doji is Long-Legged. The settings are "one", "two", and "average". These define how many wick lengths of a candle need to exceed the calculated average wick lengths (EX: "both" -> upper wick length > upper wick average and lower wick length > lower wick average). The "average" setting will combine the lengths of both wicks and both prior wick averages, divide both of these sums by 2 and compare them instead.
"Doji Long Wick Tolerance" ( float ) defines how large compared to the averages that wick lengths need to be in order for them to be considered "Long-Legged" (EX: 1.50 -> upper/lower wick needs to exceed 150% the average of previous upper/lower wicks).
"Rickshaw Man Body Placement Tolerance" ( float ) defines how close to the high-low range's midpoint the candle body's midpoint needs to be in order for it to be considered a Rickshaw Man Doji candle instead.
The remaining 9 inputs define the colors to use for differentiating between all Doji variants this script will recognize.
█ USAGE
My hope for this script is that users find this easy to use/understand and will tinker with the input values to better identify Doji candlesticks across a wide range of markets.
Suggestions for changes in the future are welcome.
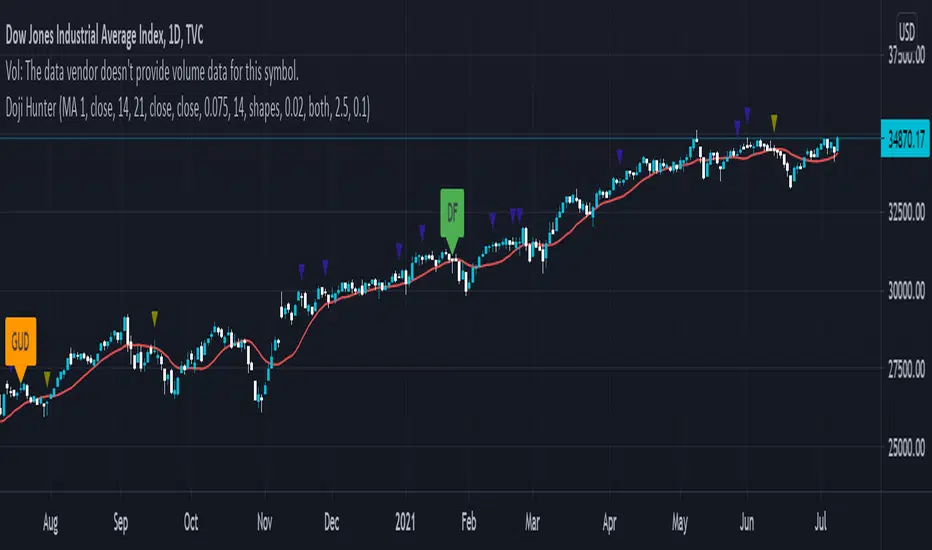
max rangeThe indicator shows statistics of price changes.
Blue bars - price change for a given period
black line - the specified price level for which statistics will be calculated.
The red line is the probability in% of exceeding the price change.
Индикатор показывает статистику изменения цены.
Синие столбики - изменение цены за заданный период
черная линия - заданный уровень цены, для которого будет вычеслена статистика.
Красная линия - вероятность в % превышения изменения цены.
