Bullseye NYSE 1st5mThis script, "BullseyeNYSE1st5m," is a TradingView indicator designed to highlight the high and low price levels during the first 5 minutes of the NYSE trading session. It works as follows:
1. **Identify NYSE Trading Hours**: The script identifies bars that fall within NYSE trading hours, specifically focusing on the first five minutes after the market opens.
2. **Calculate First 5-Minute High and Low**: During the first five minutes of the trading day, the script captures and updates the high and low prices, storing these values for the remainder of the session.
3. **Plot High and Low Levels**: The high and low values from the first five minutes are plotted as lines on the chart in yellow. This helps traders quickly identify the initial range set by the market.
4. **Fill the Area Between High and Low**: The area between the high and low levels is filled with a translucent yellow color to visually emphasize the first five-minute range.
5. **Alerts for Breakouts**: Alerts are set to notify the user when the price closes above or below the first five-minute range. This helps traders stay informed of potential breakout opportunities beyond this key opening range.
This indicator is useful for day traders looking to leverage the first few minutes of NYSE trading to identify early support and resistance levels and to spot breakout opportunities.
Pesquisar nos scripts por "breakout"
Swing Data - Optimized SK60
v. 1.83
indicator adjust to time frame.
This Pine Script code generates a trading indicator that calculates and displays various data points on a stock, including Average Daily Range (ADR%), Market Cap, Current Volume, Free Cash Flow (FCF) Yield %, Float %, whether moving averages (MA) are inline, and the moving averages of certain indexes like the Russell 2000, Nasdaq 100, and S&P 500. Here’s a breakdown of the script and how to use it.
Key Concepts and Functionality
Indicator Definition: The script begins by defining the indicator with a title (Swing Data - Optimized ADR%...) and short title (Optimized Swing Data), which will appear on the chart. The overlay=true command ensures that the indicator is drawn on the main price chart rather than in a separate pane.
Sector and Ticker:
s = syminfo.tickerid: This stores the ticker ID of the stock being analyzed.
sector = syminfo.sector: This retrieves the sector to which the stock belongs. If the sector information is unavailable, it assigns the value "N/A".
Dynamic Inputs: Several input parameters allow you to customize the indicator:
adrp_len: Defines the length for ADR% calculation.
len: Defines the moving average length for volume.
tbl_size, bg_col, and txt_col: Control the table's appearance, including the size of the text, background color, and text color.
posTable: Allows positioning of the table on the chart. Options include top-left, top-right, bottom-left, and bottom-right.
show_empty_row: Adds an empty row above the displayed values if set to true.
Volume Unit Handling (f_vol_unit): This function converts volume into appropriate units, like thousands (K), millions (M), or billions (B), to make volume easier to read. It’s applied to both the current volume and the average daily volume.
Moving Averages for Indexes (f_ma_indexes): This function calculates the 10-day, 20-day, 50-day, and 200-day simple moving averages (SMAs) for an index (such as Russell 2000 or Nasdaq 100). It also checks whether the MAs are inline, meaning if shorter MAs are above longer MAs, which is usually a bullish sign. It returns the result as "YES" or "NO" and assigns a color (green for yes, red for no).
Volume and Price Data: The script fetches several important data points:
vol_display: Current volume in human-readable units.
avgDaVol: Average daily volume.
adrp: Average Daily Range (ADR%) over a specified length.
fcf_yield_percent: Free Cash Flow Yield percentage.
ADR Calculation: The ADR% is calculated using the formula 100 * (ta.sma(high / low, adrp_len) - 1) and is fetched for the daily timeframe.
FCF Yield Color Logic: The Free Cash Flow yield is classified into three categories:
Green: Undervalued if FCF yield is over 5%.
Yellow: Neutral between 2-5%.
Red: Overvalued if below 2%.
MA's Inline Check for the Stock: The script checks if the stock's 10-day, 20-day, 50-day, and 200-day moving averages are inline (i.e., in a bullish alignment where shorter MAs are higher than longer MAs).
Float % Calculation: The float percentage is calculated as the ratio of float shares outstanding (FSO) to total shares outstanding (TSO). The color is set based on its breakout potential:
Red: Below 20% (manipulation risk).
Green: 20-50% (ideal breakout range).
Yellow: Above 50%.
Price Change %: The script calculates the percentage change in price between the current and previous close.
Volume Color Logic: The color of the "Current Volume" is based on whether it indicates buying or selling pressure:
Green: Volume is higher than average, and the price increased more than ADR%.
Red: Volume is higher than average, and the price decreased more than ADR%.
Yellow: Default color if neither condition is met.
Market Cap: The market cap is calculated by multiplying the total shares outstanding (TSO) by the current close price, and it’s displayed in a human-readable unit (K, M, or B).
Display Table:
A table is created to display all the calculated data in an organized manner. It includes fields for Market Cap, Avg Volume, ADR%, Current Volume, FCF Yield %, Float %, MA's Inline status, and Sector. Additionally, it shows the inline status for the Russell 2000, Nasdaq 100, and S&P 500.
How to Use:
Customization: Users can customize the inputs, including the length of ADR% and volume moving averages, and adjust the table size, text color, and position.
Visualization: The indicator provides a comprehensive table on the chart showing key data points for technical analysis, including whether moving averages are inline for both the stock and major indexes.
This indicator is particularly useful for swing traders or technical analysts who want a clear overview of a stock’s volume, volatility (via ADR%), and the alignment of moving averages, combined with fundamental metrics like market cap and free cash flow yield.

The real breakout indicator CCI + Money Flow + Buy / SellComponents of the indicator
1. CCI (Commodity Channel Index)
The CCI component measures the deviation of the price from its statistical average. It is used to identify overbought or oversold conditions and is integrated into the trend logic to determine potential trend reversals. High values may indicate overbought conditions, while low values could signify oversold situations.
Detailed
The CCI (Commodity Channel Index) used in "The Real Breakout Indicator Hawk" is an enhanced version compared to the traditional CCI, offering several advantages:
1. Weighting and Smoothing Mechanism
In this version, the CCI values are weighted and smoothed using custom parameters (c1, c2, c3), which allows for greater flexibility in adjusting the sensitivity of the CCI to market conditions. This smoothing reduces noise and provides clearer signals compared to the standard CCI, which can be prone to whipsaws in volatile markets.
2. Multi-level Calculation
The indicator uses an array-based approach to calculate multiple variations of CCI values (with p as the parameter for different levels of calculation), which is then combined to create a more robust signal. This multi-level approach allows for capturing different market cycles, unlike the traditional CCI that only uses a single period for calculation.
3. Integration with Moving Averages and Trend Detection
Unlike the original CCI, which is often used in isolation, this version integrates with the trend detection logic by combining it with moving averages and money flow. The enhanced CCI contributes to the broader trend analysis, ensuring that buy/sell signals are not just based on CCI overbought/oversold levels but also validated by moving averages and slope calculations.
4. Trend-Weighted CCI
This version adds weight to recent price action trends, making it more adaptive to current market momentum. The CCI values are influenced by recent high and low prices, adding a trend-following aspect that is missing from the original CCI, which treats all price deviations equally.
This image of EURAD shows for example that when CCI component is green a strong trend is detected which can hold for up to 10 days in this example, ideal for swing trades;
EURAUD 2H
5. Improved Overbought/Oversold Detection
The script incorporates a dynamic overbought/oversold detection zone based on the enhanced CCI. It accounts for market volatility, allowing it to adjust its thresholds (such as the 200 level) more effectively in different market environments. This makes the enhanced CCI better suited for varying market conditions compared to the fixed thresholds of the original CCI.
You can see that the red diamond signal is generated at the absolute top of the price range after which price started to reverse, the detection is based on a cross over value together with Money Flow strength
BTCUSDT 2H
6. Strong Buy/Sell Confirmation
The enhanced CCI works in tandem with other components like Money Flow and Moving Averages to confirm buy or sell signals. This cross-validation makes the indicator less reliant on CCI alone and ensures that the signals generated are stronger and less prone to false positives, which is a common issue with the standalone CCI.
The green diamond buy signal in a strong downtrend is mostly a short retrace of price before continuing down further, yo can use this as an entry signal after the bounce up into an FVG for example. However when price is at a support, meaning price is not moving down further and this occurs this could be a potential reversal signal as shown on the right side on the chart below. FVG is not respected, retested and price continues up.
BTCUSDT 2H
Summary:
In summary, the enhanced CCI in this indicator improves over the original CCI by providing better noise reduction, multi-level analysis, trend integration, and adaptability to different market conditions. These improvements lead to more reliable and actionable trading signals.
2. Money Flow (MF) www.tradingview.com
The Money Flow component tracks the flow of capital in and out of an asset. Positive values indicate strong buying pressure, while negative values show selling pressure. This is smoothed to avoid noise and is used to confirm strong buy or sell conditions.
The Money Flow (MF) in "The Real Breakout Indicator Hawk" measures the flow of capital into or out of an asset, helping to assess the underlying buying or selling pressure in the market.
1. Positive Money Flow (Buying Pressure)
When the MF is positive, it indicates that more money is flowing into the asset, which suggests strong buying interest. This helps confirm that a price increase or breakout to the upside is supported by demand.
2. Negative Money Flow (Selling Pressure)
A negative MF indicates that capital is leaving the asset, reflecting selling pressure. This is a sign that the market is under bearish conditions, and prices are likely to decline or break down.
3. Confirmation of Buy and Sell Signals
The MF is used to confirm buy and sell signals generated by other components of the indicator. When the MF aligns with other bullish signals, it strengthens the buy condition, and similarly, when the MF shows strong selling pressure, it reinforces a sell signal.
4. Filtering Noise
The MF is smoothed to filter out noise, ensuring that only significant movements in buying or selling pressure are considered. This helps avoid false signals and makes the MF a reliable tool for detecting true market strength.
5. Range Sensitivity
The MF operates within defined ranges, ensuring that buy or sell signals are only triggered when the flow of money is strong enough, adding precision to signal generation.
In summary, the Money Flow component is crucial for validating market direction, enhancing signal reliability, and helping traders make more informed decisions based on the underlying capital movement in the market.
3. Moving Averages (MA)
Multiple types of moving averages (SMA, EMA, HMA, etc.) are used to smooth price action and highlight the trend direction. The script supports different types of moving averages, and their slopes are calculated to assist in identifying changes in trend momentum.
The Moving Averages (MA) section of "The Real Breakout Indicator Hawk" plays a critical role in smoothing price data, identifying trends, and generating buy/sell signals. Here’s a breakdown of what it does and how you can use it effectively without diving into the script:
1. Moving Average Types
This section allows the user to choose from different types of moving averages, each with unique characteristics:
SMA (Simple Moving Average): Takes the average of closing prices over a specific period. It’s slower and better suited for detecting long-term trends.
EMA (Exponential Moving Average): Gives more weight to recent prices, making it more responsive to new price action and suitable for short-term trading.
HMA (Hull Moving Average): A smoother and faster moving average, useful for reducing lag in fast-moving markets.
LVMA (Linear Weighted Moving Average): Places the most weight on recent prices, making it even more responsive than EMA.
Alma (Arnaud Legoux Moving Average): A smoother version that reduces noise while maintaining responsiveness to recent price action.
2. Smoothing and Trend Detection
The moving average smooths out price data to remove small fluctuations and focuses on the overall trend. When prices are trading above the moving average, it suggests that the market is in an uptrend. When prices are below the moving average, it indicates a downtrend.
3. Trend Confirmation
The moving average serves as a confirmation tool. When the price crosses above the moving average, it could signal the start of a bullish trend, and when the price crosses below, it may indicate the beginning of a bearish trend.
4. Buy and Sell Signals
Buy Signal: The system detects a buy signal when:
The moving average crosses above 0, indicating a potential upward momentum.
Other indicators like Money Flow and CCI align to confirm the trend.
Sell Signal: A sell signal is triggered when:
The moving average crosses below 0, signaling a potential downtrend.
This signal is further validated by other components such as Money Flow and CCI to reduce false signals.
5. Using Moving Averages in Trading
Crossover Strategy: One of the simplest ways to use moving averages is by employing a crossover strategy. For instance:
When the shorter-term moving average (e.g., 20-period) crosses above a longer-term moving average (e.g., 50-period), this is a bullish crossover, indicating a buy signal.
Conversely, when the shorter-term moving average crosses below the longer-term moving average, this is a bearish crossover, indicating a sell signal.
Trend Following: If you’re trading with the trend, you can use a moving average to stay in the trade as long as the price remains above (for long positions) or below (for short positions) the moving average.
Support and Resistance: Moving averages can also act as dynamic support or resistance levels. For example, in an uptrend, the CCI might bounce off the moving average, offering a good entry point for a long position. In a downtrend, the moving average could act as resistance where prices may reverse, offering a shorting opportunity.
To use the MA section effectively:
Choose the right type of moving average based on your trading style (e.g., use EMA for faster response or SMA for long-term trends).
Watch for crossovers as buy/sell signals, especially in combination with other indicators.
Follow the trend by observing whether the price is above or below the moving average.
Use the moving average as a dynamic support/resistance level to find optimal entry/exit points.
This approach makes the moving average a versatile tool for identifying trends, refining entry and exit points, and confirming overall market direction.
an example when MA crosses below 0, keep in mind that when it it starts curving up and turning green there is a reversal brewing, this could take time...
BTCUSDT 2H
4. Buy Signals
Buy signals are generated when the moving average crosses up, and the Money Flow and other trend-based conditions are met, including CCI levels confirming the strength of the breakout. Additionally, slope calculations and other momentum indicators provide extra confirmation for entries.
5. Sell Signals
Sell signals occur when the moving average crosses down, combined with negative Money Flow, confirming downward pressure. Other trend-based conditions, including the CCI, must also align to validate the signal, and slope calculations ensure that momentum is on the sell side.
6. Slope and Trend Detection
The script includes calculations for the slope of price action over a lookback period to measure trend strength and direction. The slope is normalized to help identify when the market is gaining or losing momentum. This slope is used in conjunction with the moving averages and Money Flow to give more accurate trend signals.
The Slope and Trend Detection component in "The Real Breakout Indicator Hawk" is designed to measure the direction and strength of the market’s trend by calculating the slope of the price action over a specific period. This helps to identify whether the market is gaining or losing momentum, and it is a key element in refining buy/sell signals.
Here’s how the Slope and Trend Detection works and how you can use it effectively without diving into the script:
1. Slope Calculation
Slope is essentially the rate of change of the moving average (or price) over a given number of bars. It measures how steeply the price is moving up or down.
The script calculates the slope by measuring the difference between the moving average over a defined number of bars (e.g., 12 bars in this case). A larger slope indicates a stronger trend, while a smaller slope suggests a weaker or consolidating trend.
2. Normalized Slope
The slope is normalized, meaning it is adjusted to fall within a range that makes it easier to compare across different time frames and markets. This normalization helps to gauge whether the slope is strong or weak relative to historical data.
Positive slopes (above 0) indicate an uptrend or rising price momentum, while negative slopes (below 0) indicate a downtrend or falling price momentum.
3. Trend Detection
The slope of the moving average is used to detect the current trend:
If the slope is positive, the market is in an uptrend.
If the slope is negative, the market is in a downtrend.
The stronger the slope (the steeper it is), the stronger the trend. A small slope indicates a weak trend or consolidation.
4. Slope Thresholds
The system uses thresholds to determine the significance of the slope. These thresholds are set as upper and lower bounds:
Upper Threshold: If the slope exceeds this threshold, the trend is considered strong, and it could trigger a buy signal.
Lower Threshold: If the slope falls below this threshold (into the negative range), it indicates a strong downtrend, and it could trigger a sell signal.
These thresholds help filter out weak or false signals that occur in sideways or low-momentum markets.
5. Positive and Negative Slope Arrays
The system keeps track of both positive and negative slopes over a defined lookback period (e.g., 500 bars). By storing these values, it creates a historical context that helps to assess the current slope in relation to past price movements.
It calculates the standard deviation and the average of these slopes to dynamically adjust the thresholds for each market condition, making the trend detection more adaptive to different types of assets or market phases.
6. Using Slope and Trend Detection in Trading
Buy Signal with Positive Slope: When the slope is positive and exceeds a certain threshold, it confirms that the market is in a strong uptrend. This can be used as a signal to enter a long position or add to existing long trades.
Sell Signal with Negative Slope: When the slope turns negative and falls below the lower threshold, it signals a strong downtrend, indicating a potential short-selling opportunity or the time to exit long positions.
Avoiding Flat Markets: If the slope remains close to zero (neither strongly positive nor negative), it suggests a lack of clear trend or a consolidating market. In these conditions, it might be better to avoid taking new trades or use additional filters to confirm signals.
7. Slope-Based Trend Strength Indicator
You can also use the slope as a measure of trend strength:
Strong Trend: When the slope is steep (either positive or negative), it indicates strong momentum, and you can be more confident in holding a trade in that direction.
Weak Trend or Consolidation: When the slope is flat, it indicates weak price momentum, which may signal a period of consolidation or indecision in the market.
8. Visual Representation
The slope is often visually represented as a gradient or line that fluctuates around a central point (usually zero). Positive values are shown in one color (e.g., green for an uptrend), while negative values are shown in another color (e.g., red for a downtrend). This allows traders to quickly identify the current trend direction and its strength.
Summary:
To use Slope and Trend Detection effectively:
Monitor the slope to determine the trend direction (positive = uptrend, negative = downtrend).
Look for thresholds to identify strong trends. For instance, a steep positive slope signals a strong uptrend, while a steep negative slope signals a strong downtrend.
Use slope changes to confirm buy/sell signals. For example, if you receive a buy signal and the slope is positive and increasing, it confirms that momentum is behind the trade.
Avoid low-slope periods when the slope is close to zero, indicating a lack of trend or sideways market conditions.
This approach helps traders stay on the right side of the trend while avoiding periods of low momentum, enhancing the accuracy of trade signals.
7. Banker Fund Flow Trend
This component identifies potential large institutional moves by tracking specific patterns in price and volume data. When the institutional or "banker" entry or exit conditions are met, it highlights these moments with candles and generates alerts.
The Banker Fund Flow Trend in "The Real Breakout Indicator Hawk" helps detect the flow of institutional (or "smart money") into and out of the market by tracking price trends and large player activity. It uses red and yellow candles to signal when institutional money is influencing the market.
Key Points:
Yellow Candles (Banker Entry):
A yellow candle is plotted when institutional money starts flowing into the market.
This signals a potential buy opportunity, as large market players are likely pushing prices upward.
Red Candles (Banker Exit):
A red candle appears when institutional money starts exiting the market.
This is a signal to consider selling or exiting long positions, as institutional selling could drive prices lower.
Usage:
Yellow candles: Use these as signals to enter long trades or add to existing positions, confirming upward momentum driven by institutional buyers.
Red candles: Treat these as signals to exit long trades or consider short positions, as institutional selling may lead to further downside.
BTCUSDT 2H
The yellow and red candles provide clear, actionable signals for aligning trades with institutional flows, ensuring you’re following the "smart money."
8. Dynamic Buy/Sell Calculations
A dynamic component is designed to refine the buy and sell signals further based on additional conditions like price patterns, volatility, and Money Flow. This ensures that signals are more responsive to changing market conditions.
The Dynamic Buy/Sell Calculations in "The Real Breakout Indicator Hawk" are designed to refine entry and exit points for trades by using additional conditions beyond simple crossovers. These calculations adapt to the current market conditions, making them more responsive to changes in volatility, trend strength, and momentum.
Key Features:
Dynamic Buy Calculation:
The indicator generates a buy signal when multiple conditions align. These conditions include the money flow (MF) being within a favorable range, the moving average (MA) confirming upward momentum, and the CCI and other trend components indicating strength.
This makes the buy signal more reliable, as it considers multiple aspects of market behavior (price, momentum, and money flow) to avoid false entries.
Dynamic Sell Calculation:
Similarly, the sell signal is triggered when the dynamic conditions indicate downward momentum.
This includes:
The moving average crossing down.
Negative money flow, suggesting selling pressure.
Other trend signals confirming a bearish move.
The dynamic nature of these conditions ensures that sell signals are only generated when there’s a high probability of continued downside movement.
Adaptive to Market Conditions:
The dynamic nature of these calculations means that the buy/sell signals adapt to market changes, like volatility spikes or sudden trend reversals. Instead of relying on static conditions, the system adjusts to current price movements and volatility.
Avoiding Noise:
By adding multiple filters like MF thresholds, slope, and moving averages, the dynamic calculations help reduce false signals that occur in noisy, sideways markets. This helps traders avoid entering trades during periods of low momentum or unclear trends.
How to Use:
Buy Signals: Use these signals to enter long trades when the dynamic conditions align, confirming that upward momentum is strong and backed by institutional flows.
BTCUSDT 2H
Aqua marker/cross signals (price manipulation/continuation)
BTCUSDT 2H
Sell Signals: Use the sell signals to exit long positions or enter short trades when the market shows signs of bearish momentum, confirmed by multiple conditions like MA crossovers and negative money flow.
BTCUSDT 2H
In summary, the Dynamic Buy/Sell Calculations provide a more sophisticated approach to generating trade signals by combining various trend and momentum indicators, helping traders make more informed decisions in different market conditions.
This part of the code is identifying two key trading signals: moments to buy and moments to sell based on the behavior of a calculated trend line.
Buy Condition:
The system looks for a situation where the trend has been moving downward but has started to reverse upward. Specifically, it checks if the trend was declining a little while ago, then stopped falling, and is now starting to rise. If these conditions are met and the trend is still below a certain level, the system considers this a possible time to buy.
Sell Condition:
The opposite happens for selling. The system monitors for a situation where the trend has been moving upward but starts to turn downward. It checks if the trend was rising, leveled off, and now seems to be starting to fall. If these conditions are met and the trend is above a certain level, this could indicate a good time to sell.
Visual Markers:
To help the user easily see these signals on a chart, the system places symbols at specific points. A marker appears on the chart where the conditions for buying or selling are met, allowing the trader to quickly spot potential entry or exit points in the market.
In summary, this logic is designed to detect possible changes in trend direction and signal appropriate times to consider buying or selling, with clear visual markers on the chart for quick identification.
9. Alerts for Buy and Sell
The indicator provides built-in alert conditions for both buy and sell signals. When these conditions are met, the system generates alerts, making it suitable for automated monitoring.
Each of these components works together to detect potential breakout opportunities, trend continuations, and reversals, making the indicator suitable for both short-term and long-term trading strategies.

20-day High BreakoutOverview:
The 20-day High Breakout Indicator is a very simple yet powerful tool designed for traders seeking to capitalize on significant price movements in the stock market. This indicator identifies potential buy and sell signals based on a stock's 20-day high breakout levels, making it an essential addition to your trading strategy.
Key Features:
Swing Period Input: Customize the swing period to your preferred number of days, with a default of 20 days, allowing flexibility based on your trading style.
Trailing Stop Level: Automatically calculates the trailing stop level based on the highest high and lowest low within the defined swing period, helping to manage risk and lock in profits.
Buy and Sell Signals: Generates clear buy signals when the price crosses above the trailing stop level and sell signals when the price crosses below, enabling timely entries and exits.
Visual Indicators: Plots buy signals as green upward triangles below the bars and sell signals as red downward triangles above the bars, providing easy-to-interpret visual cues directly on the chart.
How It Works:
Resistance and Support Levels: The indicator calculates the highest high (resistance) and lowest low (support) over the defined swing period.
Swing Direction: It determines the market direction by comparing the current closing price to the previous resistance and support levels.
Trailing Stop Calculation: Depending on the market direction, the trailing stop level is set to either the support or resistance level.
Signal Generation: Buy and sell signals are generated based on the crossover of the closing price and the trailing stop level, filtered to ensure only valid signals are displayed.
Visual Representation: The trailing stop level is plotted as a line, and buy/sell signals are marked with respective shapes for easy identification.
Usage:
Trend Following: Ideal for traders looking to follow trends and catch significant breakouts in the stock price.
Risk Management: Helps in managing risk by providing a trailing stop level that adjusts with market movements.
Visual Clarity: The clear visual signals make it easy for traders to interpret and act upon the indicator's signals.
Add the 20-day High Breakout Indicator to your TradingView charts to enhance your trading strategy and gain an edge in identifying profitable trading opportunities.

KillZones + ACD Fisher [TradingFinder] Sessions + Reversal Level🔵 Introduction
🟣 ACD Method
"The Logical Trader" opens with a thorough exploration of the ACD Methodology, which focuses on pinpointing particular price levels associated with the opening range.
This approach enables traders to establish reference points for their trades, using "A" and "C" points as entry markers. Additionally, the book covers the concept of the "Pivot Range" and how integrating it with the ACD method can help maximize position size while minimizing risk.
🟣 Session
The forex market is operational 24 hours a day, five days a week, closing only on Saturdays and Sundays. Typically, traders prefer to concentrate on one specific forex trading session rather than attempting to trade around the clock.
Trading sessions are defined time periods when a particular financial market is active, allowing for the execution of trades.
The most crucial trading sessions within the 24-hour cycle are the Asia, London, and New York sessions, as these are when substantial money flows and liquidity enter the market.
🟣 Kill Zone
Traders in financial markets earn profits by capitalizing on the difference between their buy/sell prices and the prevailing market prices.
Traders vary in their trading timelines.Some traders engage in daily or even hourly trading, necessitating activity during periods with optimal trading volumes and notable price movements.
Kill zones refer to parts of a session characterized by higher trading volumes and increased price volatility compared to the rest of the session.
🔵 How to Use
🟣 Session Times
The "Asia Session" comprises two parts: "Sydney" and "Tokyo." This session begins at 23:00 and ends at 06:00 UTC. The "Asia KillZone" starts at 23:00 and ends at 03:55 UTC.
The "London Session" includes "Frankfurt" and "London," starting at 07:00 and ending at 14:25 UTC. The "London KillZone" runs from 07:00 to 09:55 UTC.
The "New York" session starts at 14:30 and ends at 19:25 UTC, with the "New York am KillZone" beginning at 14:30 and ending at 22:55 UTC.
🟣 ACD Methodology
The ACD strategy is versatile, applicable to various markets such as stocks, commodities, and forex, providing clear buy and sell signals to set price targets and stop losses.
This strategy operates on the premise that the opening range of trades holds statistical significance daily, suggesting that initial market movements impact the market's behavior throughout the day.
Known as a breakout strategy, the ACD method thrives in volatile or strongly trending markets like crude oil and stocks.
Some key rules for employing the ACD strategy include :
Utilize points A and C as critical reference points, continually monitoring these during trades as they act as entry and exit markers.
Analyze daily and multi-day pivot ranges to understand market trends. Prices above the pivots indicate an upward trend, while prices below signal a downward trend.
In forex trading, the ACD strategy can be implemented using the ACD indicator, a technical tool that gauges the market's supply and demand balance. By evaluating trading volume and price, this indicator assists traders in identifying trend strength and optimal entry and exit points.
To effectively use the ACD indicator, consider the following :
Identifying robust trends: The ACD indicator can help pinpoint strong, consistent market trends.
Determining entry and exit points: ACD generates buy and sell signals to optimize trade timing.
Bullish Setup :
When the "A up" line is breached, it’s wise to wait briefly to confirm it’s not a "Fake Breakout" and that the price stabilizes above this line.
Upon entering the trade, the most effective stop loss is positioned below the "A down" line. It's advisable to backtest this to ensure the best outcomes. The recommended reward-to-risk ratio for this strategy is 1, which should also be verified through backtesting.
Bearish Setup :
When the "A down" line is breached, it’s prudent to wait briefly to ensure it’s not a "Fake Breakout" and that the price stabilizes below this line.
Upon entering the trade, the most effective stop loss is positioned above the "A up" line. Backtesting is recommended to confirm the best results. The recommended reward-to-risk ratio for this strategy is 1, which should also be validated through backtesting.
Advantages of Combining Kill Zone and ACD Method in Market Analysis :
Precise Trade Timing : Integrating the Kill Zone strategy with the ACD Method enhances precision in trade entries and exits. The ACD Method identifies key points for trading, while the Kill Zone focuses on high-activity periods, together ensuring optimal timing for trades.
Better Trend Identification : The ACD Method’s pivot ranges help spot market trends, and when combined with the Kill Zone’s emphasis on periods of significant price movement, traders can more effectively identify and follow strong market trends.
Maximized Profits and Minimized Risks : The ACD Method's structured approach to setting price targets and stop losses, coupled with the Kill Zone's high-volume trading periods, helps maximize profit potential while reducing risk.
Robust Risk Management : Combining these methods provides a comprehensive risk management strategy, strategically placing stop losses and protecting capital during volatile periods.
Versatility Across Markets : Both methods are applicable to various markets, including stocks, commodities, and forex, offering flexibility and adaptability in different trading environments.
Enhanced Confidence : Using the combined insights of the Kill Zone and ACD Method, traders gain confidence in their decision-making process, reducing emotional trading and improving consistency.
By merging the Kill Zone’s focus on trading volumes and the ACD Method’s structured breakout strategy, traders benefit from a synergistic approach that enhances precision, trend identification, and risk management across multiple markets.

ICT KillZones + Pivot Points [TradingFinder] Support/Resistance 🟣 Introduction
Pivot Points are critical levels on a price chart where trading activity is notably high. These points are derived from the prior day's price data and serve as key reference markers for traders' decision-making processes.
Types of Pivot Points :
Floor
Woodie
Camarilla
Fibonacci
🔵 Floor Pivot Points
Widely utilized in technical analysis, floor pivot points are essential in identifying support and resistance levels. The central pivot point (PP) acts as the primary level, suggesting the trend's likely direction.
The additional resistance levels (R1, R2, R3) and support levels (S1, S2, S3) offer further insight into potential trend reversals or continuations.
🔵 Camarilla Pivot Points
Featuring eight distinct levels, Camarilla pivot points closely correspond with support and resistance, making them highly effective for setting stop-loss orders and profit targets.
🔵 Woodie Pivot Points
Similar to floor pivot points, Woodie pivot points differ by placing greater emphasis on the closing price, often resulting in different pivot levels compared to the floor method.
🔵 Fibonacci Pivot Points
Fibonacci pivot points combine the standard floor pivot points with Fibonacci retracement levels applied to the previous trading period's range. Common retracement levels used are 38.2%, 61.8%, and 100%.
🟣 Sessions
Financial markets are divided into specific time segments, known as sessions, each with unique characteristics and activity levels. These sessions are active at different times throughout the day.
The primary sessions in financial markets include :
Asian Session
European Session
New York Session
The timing of these major sessions in UTC is as follows :
Asian Session: 23:00 to 06:00
European Session: 07:00 to 14:25
New York Session: 14:30 to 22:55
🟣 Kill Zones
Kill zones are periods within a session marked by heightened trading activity. During these times, trading volume surges and price movements become more pronounced.
The timing of the major kill zones in UTC is :
Asian Kill Zone: 23:00 to 03:55
European Kill Zone: 07:00 to 09:55
New York Kill Zone: 14:30 to 16:55
Combining kill zones and pivot points in financial market analysis provides several advantages :
Enhanced Market Sentiment Analysis : Aligns key price levels with high-activity periods for a clearer market sentiment.
Improved Timing for Trade Entries and Exits : Helps better time trades based on when price movements are most likely.
Higher Probability of Successful Trades : Increases the accuracy of predicting market movements and placing profitable trades.
Strategic Stop-Loss and Profit Target Placement : Allows for precise risk management by strategically setting stop-loss and profit targets.
Versatility Across Different Time Frames : Effective in both short and long time frames, suitable for various trading strategies.
Enhanced Trend Identification and Confirmation : Confirms trends using both pivot levels and high-activity periods, ensuring stronger trend validation.
In essence, this integrated approach enhances decision-making, optimizes trading performance, and improves risk management.
🟣 How to Use
🔵 Two Approaches to Trading Pivot Points
There are two main strategies for trading pivot points: utilizing "pivot point breakouts" and "price reversals."
🔵 Pivot Point Breakout
When the price breaks through pivot lines, it signals a shift in market sentiment to the trader. In the case of an upward breakout, where the price crosses these pivot lines, a trader might enter a long position, placing their stop-loss just below the pivot point (P).
Conversely, if the price breaks downward, a short position can be initiated below the pivot point. When using the pivot point breakout strategy, the first and second support levels can serve as profit targets in an upward trend. In a downward trend, these roles are filled by the first and second resistance levels.
🔵 Price Reversal
An alternative method involves waiting for the price to reverse at the support and resistance levels. To implement this strategy, traders should take positions opposite to the prevailing trend as the price rebounds from the pivot point.
While this tool is commonly used in higher time frames, it tends to produce better results in shorter time frames, such as 1-hour, 30-minute, and 15-minute intervals.
Three Strategies for Trading the Kill Zone
There are three principal strategies for trading within the kill zone :
Kill Zone Hunt
Breakout and Pullback to Kill Zone
Trading in the Trend of the Kill Zone
🔵 Kill Zone Hunt
This strategy involves waiting until the kill zone concludes and its high and low lines are established. If the price reaches one of these lines within the same session and is strongly rejected, a trade can be executed.
🔵 Breakout and Pullback to Kill Zone
In this approach, once the kill zone ends and its high and low lines stabilize, a trade can be made if the price breaks one of these lines decisively within the same session and then pulls back to that level.
🔵 Trading in the Trend of the Kill Zone
Kill zones are characterized by high trading volumes and strong trends. Therefore, trades can be placed in the direction of the prevailing trend. For instance, if an upward trend dominates this area, a buy trade can be entered when the price reaches a demand order block.

Break of Structure with trend table by GadatasThis indicator is designed to identify and track swing highs and lows in a given market on chart timeframe. It plots these swing highs and lows as solid lines on the chart. The indicator allows for customization of the line color and width. The selected timeframe trend is visually represented in a table located in the upper right corner of the chart. To enhance consistency, the background color of the timeframe column now elegantly matches the color of the BOS line.
The indicator follows specific rules to determine when a new high or low is created. If the current range is considered bullish (meaning the most recent breakout was to the topside), the indicator will only update the low if a candle's body falls below the current low. However, if the current range is bearish (most recent breakout to the downside), the indicator will only update the high if a candle's body rises above the current high.
When a range is identified as bullish, the indicator will continue updating the high until a swing high is formed, denoting the high of the range. The high will only change if a candle's body surpasses the previous high. The low, on the other hand, will be updated based on the last time a candle's body falls below a previous candle's low. The lowest low after this condition is met will be assigned as the low of the range.
Conversely, when a range is identified as bearish, the indicator will continue updating the low until a swing low is formed, denoting the low of the range. The low will only change if a candle's body falls below the previous low. The high, in this case, will be updated based on the last time a candle's body rises above a previous candle's high. The highest high after this condition is met will be assigned as the high of the range.
Swing highs are determined by having lower highs to the left and right, while swing lows have higher lows to the left and right. These swings are used to determine the final high or low of a bullish or bearish range, respectively.
Tis Indicator differs from other indicators by incorporating this concept to track market structure. The indicator assumes that significant market players sell before making heavy purchases in bullish ranges and buy before selling heavily in bearish ranges. The lines on the chart represent prior highs and lows, as well as the current updated highs and lows based on this theory. By using this indicator, one can gain insights into the structure of price movement and potentially identify bullish or bearish continuations. It can also provide confluence when analyzing multiple timeframes to validate trend-following strategies.
Open-source script.
It now displays both short and long condition changes along with their respective arguments:
1. In the case of a high Bos line break followed by a fall, a very long condition change is made when at least three breaks of Bos Low are observed, transitioning from very short to short then distribution , and after that to long.
2. Short conditions are indicated when a high Bos falls and the condition changes from very long to long and then accumulation, short, and very short with each break.
Additionally, the break counter column now shows positive numbers for long situations, indicating each low Bos break, and negative numbers for short situations, indicating each high Bos break.
The background color of the break counter column now changes to green for positive numbers and red for negative numbers.

Market Structure (Breakers) [LuxAlgo]The Market Structure (Breakers) indicator aims to detect "Breaker Market Structures", an original concept inspired by breaker blocks, and extend on the original concept of market structures by extending existing MS levels, providing supports/resistances as a result.
Various graphical elements are included that highlight the interactions between price and Breaker structures.
🔶 USAGE
Breaker structures occur when a market structure is confirmed (price breaking a previous swing level). The broken swing point is extended by a dotted line which can be used as potential support or resistance.
After a market structure, the price can eventually reverse and break one or multiple breaker structures at the same time, allowing for the detection of new trends in the price.
A market structure closer to the top/bottom of a trend can return Breaker structures breakouts more indicative of potential reversals.
Breakers MS breakouts can also be useful as exits for entries done using market market structures.
The script additionally highlights support/resistance events by highlighting candle borders, with a border using a green color indicating support events while a red color is indicative of a resistance event.
🔹 Breaker Structure Lifespan
The "lifespan" of Breaker structures, that is the amount of time the script will extend/evaluate them is determined by various user settings.
The Maximum Breaks setting determines the maximum amount of breaks a breaker structure can withstand before it is broken.
For example, a maximum amount of breaks of 3 for a bearish breaker structure would require the price to cross under that precise breaker structure level three times. Using higher values of this setting will also highlight more Breakers MS.
The Breaker Maximum Duration setting on the other hand determines how many bars a breaker structure can be evaluated without being broken. If a breaker structure is not broken after this amount of bars then it will stop being evaluated and will be removed.
🔶 SETTINGS
Swings Period: Period used for the swing detection, with higher values returning longer term markter structures.
Maximum Breaks: Amount of break required for a breaker block to be considered broken.
Breaker Maximum Duration: Maximum duration of a breaker block (in bars).

Consolidation Spotter Multi Time FrameThis tool is designed for traders looking to spot areas of consolidation on their charts across various time frames. It highlights these consolidation areas using visually appealing boxes, making it easier to identify potential breakout or breakdown zones.
How To Use:
Spotting Consolidation: When you see a box form on your chart, this represents a consolidation zone. Within this zone, the price is moving sideways without a strong upward or downward trend.
Anticipating Breakouts & Breakdowns: Watch the price as it approaches the edges of the box. A movement outside the box can signal a potential breakout (if above the box) or a breakdown (if below the box). This is where momentum shifts can happen.
Momentum Confirmation: Once the price clearly moves out of the box, it indicates a momentum shift. If the price moves upwards out of the box, this can be seen as bullish momentum. Conversely, if the price moves downwards out of the box, this can be seen as bearish momentum.
To use the tool effectively, adjust the settings to suit your trading style, choose your preferred visual theme, and watch as the script highlights key consolidation areas on your chart.
Tip: To visualize fractals, consider using multiple instances of the "Consolidation Spotter" indicator, each set to a different timeframe. This approach allows you to observe consolidations nested within larger consolidations, offering deeper insights into market structures. 😉

PDHL levels with INTRADAY Auto FIBThe present script includes Previous day High/low levels and once the PDH or PDL breaks the present bar's background changes color according to the direction of price breakout.
It's helpful when working on lower timeframe charts with small screen space, so that the user can know that the PDHL has been taken out in one glance at the chart instead of scrolling all around to find out whether the PDH or PDL are broken or not.
The high and low of day before yesterday are also plotted for reference.
The intraday fib levels get drawn taking present day's high and low into account, useful to mark support/retest levels.
The color of the intraday AUTO FIB high and low lines also change from gray to respective assigned colors once the present day price crosses PDH or PDL this is helpful while viewing charts on mobile app.
Disclaimer: Only for studying price movement ideas, trading is not advised.

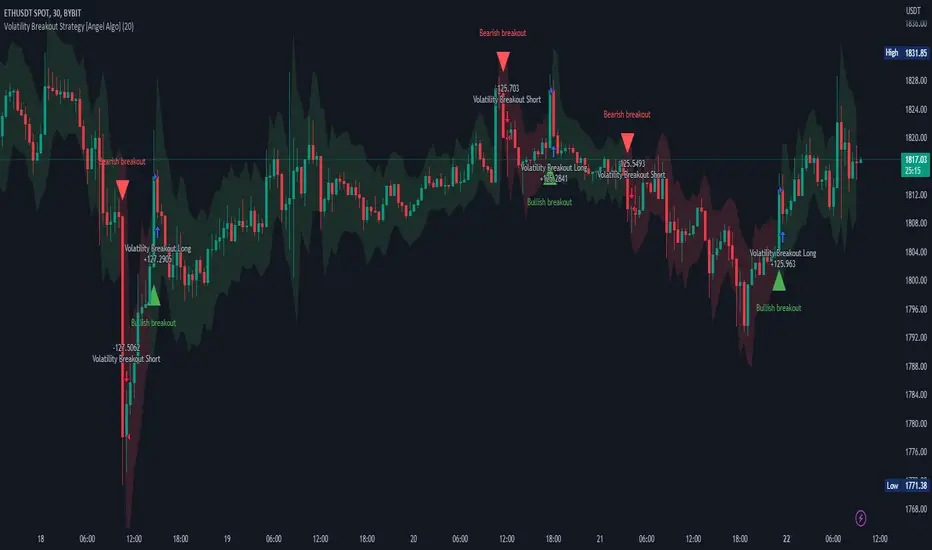
Volatility Breakout Strategy [Angel Algo]As traders, we're always looking for opportunities to profit from sudden price breakouts, and the Volatility Breakout Strategy aims to do just that.
This script is the perfect starting point for traders who want to experiment with capturing price movements resulting from increased volatility. The script plots the Average True Range (ATR) on the chart, which is a measure of the asset's volatility over a specified period. By setting the "Length" parameter, you can customize the period over which the volatility is measured.
Using the ATR, the strategy calculates upper and lower breakout levels and plots them on the chart. The signals for long and short positions are generated when the price crosses above the upper breakout level or below the lower breakout level, respectively. They are confirmed by checking the current bar state.
The strategy also fills the space between the upper and lower breakout levels with a color that indicates the latest signal direction. This feature helps traders quickly identify the prevailing trend.
The strategy uses the generated signals to enter trades. When a long or short signal is confirmed, and there is no open position in the direction of the signal, the strategy enters a long or short trade, respectively.
Choice of parameters.
Choosing the right value for the Length input parameter is crucial for tailoring the Volatility Breakout Strategy to suit your trading preferences. In general, a higher Length value implies a focus on capturing longer price moves. For instance, in this script, we have set the Length value to 20, resulting in trades that span approximately 100 candles. These trades encompass price trends consisting of multiple swings.
However, if your goal is to trade individual swings rather than longer trends, it's advisable to experiment with smaller values for the Length parameter. By reducing the Length, you can target shorter-term price movements and potentially increase the frequency of trades.
It's important to note that while a higher Length value tends to lead to longer trades, there is no strict correlation between the Length parameter and the average length of trades. This can vary across different markets. Therefore, it's essential to conduct thorough experimentation with various Length values and closely observe the length of trades they generate. Comparing these trade lengths with the average trend or swing length in the specific market can provide valuable insights.
Ideally, you should aim to select a Length value that aligns with the average trend or swing length observed in the market you are trading. This way, you can optimize the strategy to capture price movements that closely match the prevailing market conditions.
Remember, finding the optimal Length value is a process of trial and error, combined with careful observation of trade lengths and their correlation with market trends. So, don't be afraid to experiment and refine the Length parameter to maximize the effectiveness of the Volatility Breakout Strategy in your chosen market.
Disclaimer: This trading strategy is provided for educational and informational purposes only.Trading involves risk, and past performance is not indicative of future results.
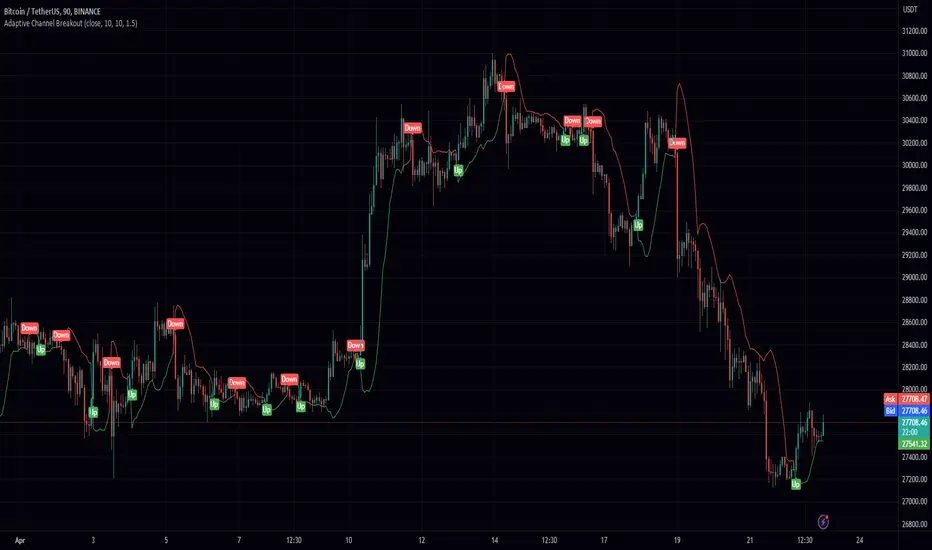
Adaptive Channel BreakoutIntroducing the "Adaptive Channel Breakout" indicator, an advanced charting tool that employs the acb function from the PeacefulIndicators library. This powerful indicator helps traders detect potential breakouts and trends by displaying an adaptive channel on the chart.
Key features of the Adaptive Channel Breakout indicator include:
Customizable input parameters: Adjust the moving average length, volatility length, and multiplier to suit your trading preferences and strategy.
Utilizes the acb function from the PeacefulIndicators library, which calculates the adaptive channel using a simple moving average (SMA) and standard deviation to measure volatility. The function also tracks the trend direction based on price crossovers and crossunders.
Clear visual representation: The adaptive channel is displayed as a linebr plot, with the color indicating the current trend direction (green for uptrends and red for downtrends).
Trend signals: The indicator includes up and down arrow labels that signify potential trend reversals, providing traders with valuable entry and exit points.
Overlay functionality: Designed to be displayed directly on the price chart for easy analysis and correlation with price action.
To use the Adaptive Channel Breakout indicator, simply add the script to your chart and customize the input parameters as needed.
GKD-C Momentum Breakout Bands [Loxx]Giga Kaleidoscope Momentum Breakout Bands is a Confirmation module included in Loxx's "Giga Kaleidoscope Modularized Trading System".
█ Giga Kaleidoscope Modularized Trading System
What is Loxx's "Giga Kaleidoscope Modularized Trading System"?
The Giga Kaleidoscope Modularized Trading System is a trading system built on the philosophy of the NNFX (No Nonsense Forex) algorithmic trading.
What is an NNFX algorithmic trading strategy?
The NNFX algorithm is built on the principles of trend, momentum, and volatility. There are six core components in the NNFX trading algorithm:
1. Volatility - price volatility; e.g., Average True Range, True Range Double, Close-to-Close, etc.
2. Baseline - a moving average to identify price trend
3. Confirmation 1 - a technical indicator used to identify trends
4. Confirmation 2 - a technical indicator used to identify trends
5. Continuation - a technical indicator used to identify trends
6. Volatility/Volume - a technical indicator used to identify volatility/volume breakouts/breakdown
7. Exit - a technical indicator used to determine when a trend is exhausted
How does Loxx's GKD (Giga Kaleidoscope Modularized Trading System) implement the NNFX algorithm outlined above?
Loxx's GKD v1.0 system has five types of modules (indicators/strategies). These modules are:
1. GKD-BT - Backtesting module (Volatility, Number 1 in the NNFX algorithm)
2. GKD-B - Baseline module (Baseline and Volatility/Volume, Numbers 1 and 2 in the NNFX algorithm)
3. GKD-C - Confirmation 1/2 and Continuation module (Confirmation 1/2 and Continuation, Numbers 3, 4, and 5 in the NNFX algorithm)
4. GKD-V - Volatility/Volume module (Confirmation 1/2, Number 6 in the NNFX algorithm)
5. GKD-E - Exit module (Exit, Number 7 in the NNFX algorithm)
(additional module types will added in future releases)
Each module interacts with every module by passing data between modules. Data is passed between each module as described below:
GKD-B => GKD-V => GKD-C(1) => GKD-C(2) => GKD-C(Continuation) => GKD-E => GKD-BT
That is, the Baseline indicator passes its data to Volatility/Volume. The Volatility/Volume indicator passes its values to the Confirmation 1 indicator. The Confirmation 1 indicator passes its values to the Confirmation 2 indicator. The Confirmation 2 indicator passes its values to the Continuation indicator. The Continuation indicator passes its values to the Exit indicator, and finally, the Exit indicator passes its values to the Backtest strategy.
This chaining of indicators requires that each module conform to Loxx's GKD protocol, therefore allowing for the testing of every possible combination of technical indicators that make up the six components of the NNFX algorithm.
What does the application of the GKD trading system look like?
Example trading system:
Backtest: Strategy with 1-3 take profits, trailing stop loss, multiple types of PnL volatility, and 2 backtesting styles
Baseline: Hull Moving Average as shown on the chart above
Volatility/Volume: Volatility Ratio as shown on the chart above
Confirmation 1: Momentum Breakout Bands as shown on the chart above
Confirmation 2: Williams Percent Range
Continuation: Fisher Transform
Exit: Rex Oscillator
Each GKD indicator is denoted with a module identifier of either: GKD-BT, GKD-B, GKD-C, GKD-V, or GKD-E. This allows traders to understand to which module each indicator belongs and where each indicator fits into the GKD protocol chain.
Giga Kaleidoscope Modularized Trading System Signals (based on the NNFX algorithm)
Standard Entry
1. GKD-C Confirmation 1 Signal
2. GKD-B Baseline agrees
3. Price is within a range of 0.2x Volatility and 1.0x Volatility of the Goldie Locks Mean
4. GKD-C Confirmation 2 agrees
5. GKD-V Volatility/Volume agrees
Baseline Entry
1. GKD-B Baseline signal
2. GKD-C Confirmation 1 agrees
3. Price is within a range of 0.2x Volatility and 1.0x Volatility of the Goldie Locks Mean
4. GKD-C Confirmation 2 agrees
5. GKD-V Volatility/Volume agrees
6. GKD-C Confirmation 1 signal was less than 7 candles prior
Continuation Entry
1. Standard Entry, Baseline Entry, or Pullback; entry triggered previously
2. GKD-B Baseline hasn't crossed since entry signal trigger
3. GKD-C Confirmation Continuation Indicator signals
4. GKD-C Confirmation 1 agrees
5. GKD-B Baseline agrees
6. GKD-C Confirmation 2 agrees
1-Candle Rule Standard Entry
1. GKD-C Confirmation 1 signal
2. GKD-B Baseline agrees
3. Price is within a range of 0.2x Volatility and 1.0x Volatility of the Goldie Locks Mean
Next Candle:
1. Price retraced (Long: close < close or Short: close > close )
2. GKD-B Baseline agrees
3. GKD-C Confirmation 1 agrees
4. GKD-C Confirmation 2 agrees
5. GKD-V Volatility/Volume agrees
1-Candle Rule Baseline Entry
1. GKD-B Baseline signal
2. GKD-C Confirmation 1 agrees
3. Price is within a range of 0.2x Volatility and 1.0x Volatility of the Goldie Locks Mean
4. GKD-C Confirmation 1 signal was less than 7 candles prior
Next Candle:
1. Price retraced (Long: close < close or Short: close > close )
2. GKD-B Baseline agrees
3. GKD-C Confirmation 1 agrees
4. GKD-C Confirmation 2 agrees
5. GKD-V Volatility/Volume Agrees
PullBack Entry
1. GKD-B Baseline signal
2. GKD-C Confirmation 1 agrees
3. Price is beyond 1.0x Volatility of Baseline
Next Candle:
1. Price is within a range of 0.2x Volatility and 1.0x Volatility of the Goldie Locks Mean
3. GKD-C Confirmation 1 agrees
4. GKD-C Confirmation 2 agrees
5. GKD-V Volatility/Volume Agrees
█ Momentum Breakout Bands
What is Momentum Breakout Bands?
Momentum Breakout Bands is a momentum oscillator with Bollinger Bands to filter noise by standard deviation. This is used for breakout trading and can be used on lower timeframes.
Requirements
Inputs
Confirmation 1 and Solo Confirmation: GKD-V Volatility / Volume indicator
Confirmation 2: GKD-C Confirmation indicator
Outputs
Confirmation 2 and Solo Confirmation: GKD-E Exit indicator
Confirmation 1: GKD-C Confirmation indicator
Continuation: GKD-E Exit indicator
Additional features will be added in future releases.
Auto Trend Lines Breakouts and Bounces Signals and AlertsAuto Trend Lines Breakout with Confirmation Bounce Signals and Alerts
This indicator draws trend lines automatically based on the 2 pivot points, which are calculated based on the specified number of bars (length), which is of course customizable. The indicator then shows you when these trend lines get touched (potential bounce) or “almost touched” (Yes! The script can do that as well!) by the current price of the instrument or broken and then confirmed by the “after break come back touch” – classic! Everything is shown on the chart, and for everything - alarms can be set up with just a few clicks!
Now there are 2 modes here (you can hide all signals as well and just use the trend lines):
1) Current/recent trend lines only: will only show 2 current upper/lower trend lines as well as previous 2 for reference.
2) All time (historical) trend lines: will show 2 current upper/lower trend lines as well as the historical lines from the past and these lines are often very respected by the price!
Besides that, you can set the indicator to show you exactly what you want: Just the trend lines touches/bounces, breaks with confirmation touches/bounces or BOTH.
In addition to that, you can set the indicator to only show you these touches/bounces and breaks with additional confirmations, only if confirmed by :
- Moving Average (customizable length): LONG signals based off the trend lines will only be shown if above EMA, SHORT if below.
- Signals where the candle color confirms the direction of the trade, but the candle type is opposite (like a green colored bearish hammer for example) will be avoided (such candles can be very uncertain/deceptive)
- Signals where the signal candle is doji will be avoided (uncertain)
- Signals will only be shown if supported by the trend line slope (for example, with this feature turned on, if there is an upper line trend line, but the line is actually above, touching the top of the candles and the price touches/crosses it or it gets broken – there will be no signal as even though the trend line is an upper line above candles, it’s slope is positive (going up), if the slope would be down, like a classical down/bearish trend line and the price touches/bounces off it or the line gets broken, only then the indicator will show the signal/alert.
- OFFSET: this one is really cool! With this feature you can hunt these conditions when the price comes very near the trend line, but never touches it. With this setting turned on, with a correct offset amount – you will be able to catch these! You will need to play around with the offset amount, depending on the timeframe/instrument, be quick-n-easy!
The indicator also includes Round Number lines on the chart, which are customizable for any instrument. As you know round numbers are appreciated by the price and can be very nicely used with this indicator looking for combos or using trend lines for signals, while round numbers as partial profit price targets or stop-loss areas.
Important economic events are also shown on the chart as red vertical lines (during these events, volatility can suddenly spike, so it’s best to stay away from trading!)
This is a very powerful indicator with plenty of customizations to find the best approaches, can be used for any instrument and on any timeframe! Awesome for scalping and could be used with swing trading as well! Enjoy!
To add the alerts
-Right-click anywhere on the TradingView chart
-Click on Add alert
-Condition: Auto Trend Lines Breakout with Confirmation Bounce Signals and Alerts
-Alert name: DO NOT TOUCH THIS
-Hit “Create”
-Note: If you change ANY Settings within the indicator – you must DELETE the current alert and create a new one per steps above, otherwise it will continue triggering alerts per old Settings!
A few strategies how this indicator can be used (these were actually tested and showed awesome results!):
1) Bounce Scalping: Simply hunting bounces off the trend lines. Often the price will slightly cross the trend line and then immediately bounces from it for nice little price move, which is great for scalping or if you for example take 2/3s off the position and leave the remaining, often with such bounces – the price may reverse from the trend line and go in the opposite direction considerably.
2) Break-Bounce-Confirm: this is the “Breaks with Confirmation Bounce” option of the script which fully automates the classical trend lines break confirmation, where the trend line is broken (which could be a fake out), so you wait for a touch/bounce of that trend line back from the initial break and open the position right there or wait and see if after the touch/bounce back, the price once again goes into the direction of the break.
For stop-loss and take-profit areas, you can use:
1) Pivots (these are marked with red and green crosses on the chart), which are used to draw the actual trend lines.
2) The actual trend lines themselves (if one gets broken + confirmation, you can set your stop-loss if that same line gets broken again in the opposite direction | similar for take-profit, you can take profit or partial profit at next trend line on the chart if the price reaches it.
3) Use the Round Numbers included, for example: use the closest round number as a visual soft stop-loss and the furthest one away as a visual soft take-profit.
You can try combining this indicator with divergence, stochastic, Bollinger bands, pretty much anything!
If you wish to try this out for a week or so – please reach out and I will give you access.

DB CCI Breakout MTFDB CCI Breakout MTF
What does the indicator do?
The indicator will display crypto breakout and fallouts based on 4 timeframe CCI values. By default the current chart timeframe is used and the user may chose 3 other timeframes in the settings. Additionally, the symbol may be configured in the indicator settings. Default is Coinbase:ETHUSD.
The indicator will monitor the CCI levels on 4 timeframes and will alert to any CCI activity over 100 or under -100 which would indicate a breakout or fallout is present.
A green diamond is displayed when a breakout is detected on one or more of the timeframes for the selected symbol.
How should this indicator be used?
The indicator is a secondary alert system for the presence of breakouts or fallout conditions as under those scenarios position exit or entry strategies may be different.
Does the indicator include any alerts?
Not in this version. But I could add some if desired.
Use at your own risk and do your own diligence.
Enjoy!

TTP Kent Strat PROKent Strat PRO trades breakouts using Bollinger Bands together with SuperTrend.
PRO features:
- 3commas bot alerts for long/short bots
- Custom JSON bots alerts
Features:
- Risk/reward ratio parameter
- Longs, shorts and combined positions.
- Breakout settings
- Trailing SL, trailing TP
- Use of latest candles to place the SL using a lookback parameter (how many candles to look back for a low/high price)
- Select your SL between the ATR trendline and the latest candle: the closest or furthest away value
- Show the trendline
- Backtest mode for accurate backtests
- Signal mode for live price accurate signals
- Date range backtesting
Filters:
- EMA 200 filter and timeframe selector. This filter can be used to trade with the trend: open longs on an uptrend and shorts on a downtrend.
- ADX filter using threshold. This filter can be used to filter entries where the trend is not very strong.
- ADX pointing up. ADX values pointing up and above certain threshold can improve entries.
- Relative volume filter based on the volume being X% above the MA of the Volume. Trading with volume can help filtering out bad trades.
Example setup:
1) pick BINANCE:ETHUSDT chart, 15 min chart
2) trade longs + shorts
3) pick ratio 3
4) trailing SL checked
5) trailing TP unchecked
7) stop loss "furthest"
8) candle loopback 30
9) BB period 21, dev 1, ATR filter on, atr period 5
10) EMA filter on, 15 min
11) ADX off
12) Volume filter on set to 60%

Fake breakHi Traders,
I've developed an indicator which can detect fake-breaks on the chart.
In the following you'll find the definition of the fake break candles and also you will find how to recognize it on the chart with practical examples.
What is the fake break pattern?
Sometimes support and resistance lines broke with a full body and strong candles that gives us the idea of sharp movements on the chart but suddenly the next candle returns all the path of the previous candle. in this case we can say fake break is happening on the chart.
This indicator detect fake break patterns based on two criteria:
1. It uses AverageTrueRange indicator to measure the strength of the pattern.
2. The returning candle should engulf minimum 75% of the break candle.
This indicator plot 2 terms in the name of "FB-D" and "FB-U" that are abbreviations of the "Fake Break Down" and "Fake Break Up".
You can also set alerts to get notified when fake breakout happens on the chart.
Notice: This pattern is only acceptable in valid support and resistance zones and you can not rely on it everywhere on the chart (specially in the middle of the waves).
Notice: The source code of this indicator is open and you are allowed to use it on your scripts by mentioning the name of author.
Disclaimer: This is not a financial advice or any signal to buy or sell, the goal of developing such an indicator is to use for educational purposes.

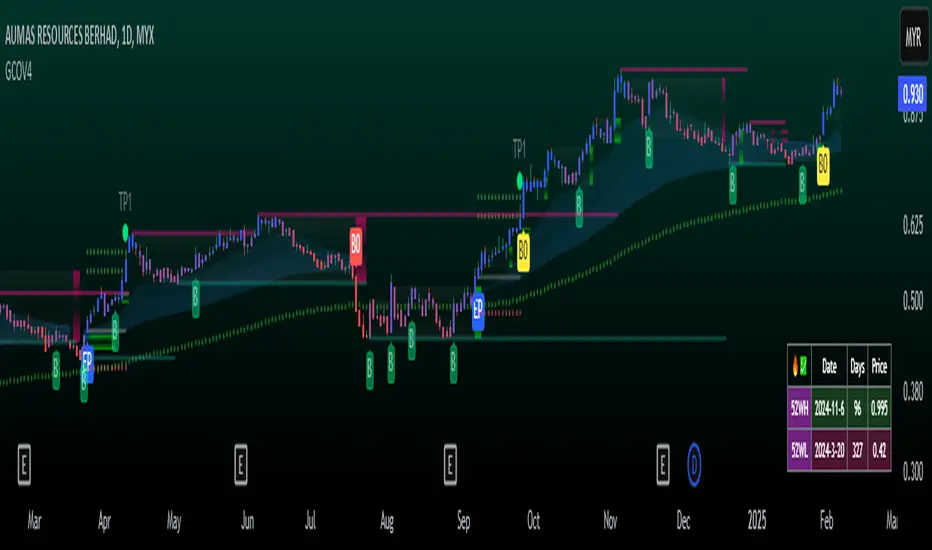
GCOV4 PROTECH GCOV4 PROTECH SYSTEM
This indicator is built specifically for SWING, PULLBACK and BREAKOUT strategy trading in the stocks/equity market. It uses an indicator instrument consisting of ATR TRAILING STOP (ATR), EXPONENTIAL MOVING AVERAGE(EMA), PIVOT POINT and VOLUME ANALYSIS.
The parameters that have been upgraded are to meet the needs of trading strategies whether short or long term trading. In addition, it is built to reduce the risk of trading activities and help traders to adhere to the best trading plan.
This transformation involves 3 trading strategy modes namely SWING PRO, PULL & BOUND and BREAKOUT STRATEGY.
Rebuild of Instrument & Parameter
This indicator is also an upgraded instrument that is sourced from the previous indicator, the GOLDENCO AIE2 INDICATOR.
This R&D of course to make trading activities more effective, dynamic and to increase the confidence of traders in current trading activities. The indicator has been upgraded in terms of parameters as well as additional instruments. Among them are;
1. ATR Trailing Stop
2. Exponential Moving Average – fastMA/slowMA Length
3. Label@Entry Price/Stoploss/Takeprofit line;
>The take profit and stop loss rates are based on percentages. However
traders can change the percentage rate according to their respective
trading plans.
>existing percentage rates have been set(build-in) for standard rate.
So you have to reset based on the type of stock/market cap either penny
stock or blue chip stock.
>The candle/bars have been colored to make it easier for traders to see price
trends whether in bullish or bearish conditions.
Hopefully with the upgrading of these indicators will make traders more successful in trading activities, especially in the equity markets.
DISCLAIMER;
ALL NOTES AND INDICATING TOOLS ARE FOR EDUCATIONAL ONLY AND AS A FACILITATOR AND PREPARATION IN TRADING ACTIVITIES. ADMIN IS NOT RESPONSIBLE FOR ANY RISKS IN YOUR TRADING ACTIVITIES. TAKE AT YOUR OWN RISK.
FunTrader/Aieyee @2022
WhaleCrew VolumeThis indicator aims to provide a deeper insight into market events by using volume data.
Features
Aggregating volume data across multiple exchanges (only for built-in crypto pairs, e.g. BTC and ETH)
Detection of volume spikes (customizable size)
Alerts for volume spikes (breakouts/mass liquidation events)
Configurable moving average type
Custom moving average multiplier
Usage
The composition of the aggregated volume data can be visualized to show the respective volume of each exchange.
Identify which exchanges (and their traders) fueled price movement. Was their share in the total aggregated volume higher/lower than previously?
Pay attention to exchanges that are notorious for a lot of beginner/retail traders to make more informed decisions.
The volume spike detection is ideal for getting alerted whenever a breakout (in price action and/or volume) or mass liquidation takes place.
(Spikes are detected relative to the set moving average.)
Access to this indicator can be obtained through our website.

NEXT Trend Delta Moving AverageOverview:
Trend Delta Moving Average (TDMA) is a composite moving average, driven by an algorithm that tracks real-time trends in price, volume, and various changes (delta) between the two. TDMA is low lagging but filtered (smoothed) MA type, with a sometimes predictive slope (via price divergence). This indicator allows you to plot one or two TDMA lines, as well as their crossovers, expressed in the form of long/short signals.
NASDAQ 100 Futures ( CME_MINI:NQ1! ) 1-minute
This Nasdaq futures example shows both TDMA lines and their crossover signals.
Tesla ( NASDAQ:TSLA ) 1-minute
If you trade price / MA crossovers or use moving averages as part of a broader trading system, you have the option of displaying a single TDMA line without any crossover signals (arrows) by ticking Plot TDMA1 Only checkbox and unticking Plot TDMA Crossovers . Great for breakout stocks like TSLA.
TDMA vs Other Moving Averages
We spent a good amount of effort developing and differentiating Trend Delta Moving Average (TDMA) from other moving averages. We wanted a responsive MA algo that considered price and action, and that incoporated user-controlled lagless filtering (smoothing). Below is a comparison between TDMA (purple) and several popular MA types, including Exponential (blue), Simple (red), and Hull (teal). All MA lengths set to 50.
Lagless Smoothing
You may use the Trendiness input parameter to control the amount of smoothing applied to individual or both TDMA lines. Lower values (emphasis on more recent trends) produce vertically tighter slopes, with TDMA following price action more closely, while higher values (emphasis on more longer term trends) relax the slope, without introducing horizontal (time) lag.
Input Parameters:
Length TDMA1 - length of the first Trend Delta Moving Average (TDMA)
Length TDMA2 - length of the second TDMA
Trendiness TDMA1 - the amount of trend weighting added to the first TDMA line (lower = more recent trend, higher = longer term trend)
Trendiness TDMA2 - the amount of trend weighting added to the second TDMA line (lower = more recent trend, higher = longer term trend)
Source - data used for calculating the MAs, typically Close, but can be used with other price formats and data sources as well.
Offset - shifting of the TDMA lines forward (+) or backward (-).
Plot TDMA1 Only - when checked, will only plot a single TDMA line (TDMA1)
Plot TDMA Crossovers - when checked, will plot an up arrow (long signal) when TDMA1 crosses over TDMA2, and a down arrow (short signal) when TDMA1 crosses under TDMA2.
Alerts
Here is how to set price crossing TDMA1 (or TDMA2) alerts: open a TradingView chart, attach NEXT Trend Delta Moving Average (TDMA), right-click on chart -> Add Alert. Condition: Symbol (e.g. NQ) >> Crossing >> NEXT Trend Delta Moving Average (TDMA) >> TDMA1 >> Once Per Bar Close.
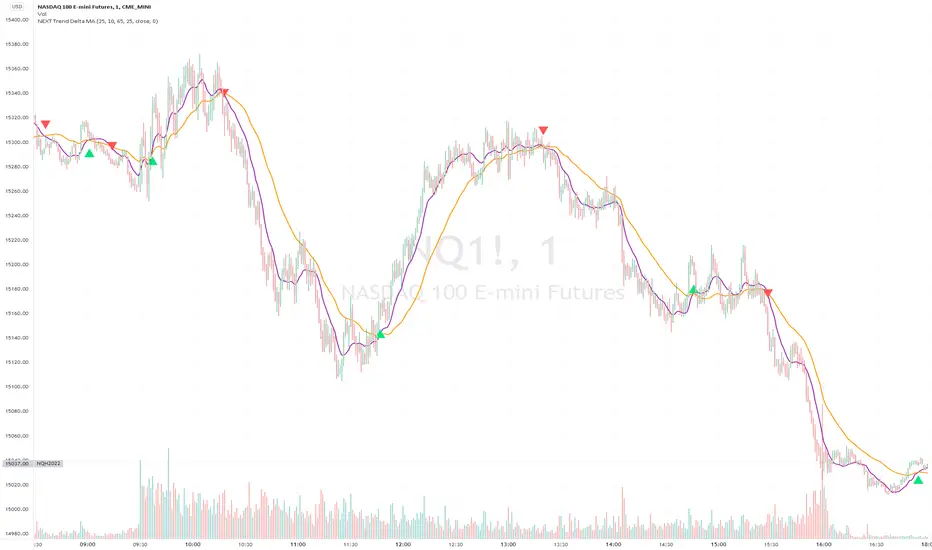
Nearest Percentile Moving Average BandsWhile coding some filters into another indicator for Long/Short I noticed that ta.nearest.percentile might be the most useful tool in pinescript I've ever encountered.
While percentile_nearest can be used for all kind of things I decided to code moving averages from it and made bands for bottom percentage and top percentage.
The indicator will calculate the top % price of the given bar length.
Example settings:
length: 150
percentile: 99
So when using 99% it will draw a green line when price is moving above the top 1% price of the last 150 candles. It then calculates if the price is below the bottom 1% of the last 150 candles.
Trading use:
Use this indicator to check if the market is leaving normal territory. This signals a breakout move for example the dogecoin pump or the top of the range. I use this indicator to catch bull/bear moves for botting purposes. An other use would be to countertrend trade after the move has ended. With price being in top 1% for a while it is very probable that we see a large correction.
Below example of dogecoin pumps:

Multi-Purpose All in One [SignalCave]Multi-Purpose All in One Indicator Functions
1) Technical Analysis, Technical Ratings
2) Pivots, Primary & Secondary Trends
3) Swings, Engulfs, Golden & Death Crosses, Price Squeezes, Pullbacks, Breakout & Breakdowns, Volume Rushes
4) Momentum Strength
1) Technical Analysis, Technical Ratings
Technical analysis display real-time ratings. It based on the most popular technical indicators such as RSI, Stochastic, CCI, ADX, AO, Momentum, MACD, Stochastic RSI, Williams %, Ichimoku Cloud, SMA, EMA, VWMA and HMA.
Technical analysis is a built-in function on TradingView. You can access any asset’s technical analysis page and see it’s performance in real time.
"Multi-Purpose All in One" indicator brings this function into your TradingView charting screen. Indicator allows you to see the same output without visiting any external web page in TradingView. Indicator also works on every timeframe and asset class.
Technical Ratings is a technical analysis tool that combines the ratings of several technical indicators to make it easier for traders and investors to find profitable trades.
Technical Ratings can be a valuable technical analysis tool for many analysts or traders. Many traders use a selection of complementary indicators to make better decisions. Technical Ratings simplifies this task by combining the most popular indicators and their signals.
2) Pivots, Primary & Secondary Trends
Helps you to identify primary and secondary trends and potential support/resistance zones.
Trend detection have three modes which are “Aggressive, Moderate and Conservative” . You can customize the mode on settings screen.
3) Swings, Engulfs, Golden & Death Crosses, Price Squeezes, Pullbacks, Breakout & Breakdowns, Volume Rushes
A swing low is when price makes a low and is immediately followed by consecutive higher lows. Likewise, a swing high is when price makes a high and is followed by consecutive lower highs.
Swing Failure Pattern (SFP) is a type of reversal pattern that can be used as buy or sell signals.
Engulfing candles tend to signal a reversal of the current trend in the market. This specific pattern involves two candles with the latter candle 'engulfing' the entire body of the candle before it.
On this indicator, bullish engulfs visible only on downtrend and oversold conditions. Bearish engulfs visible only on uptrend and overbought conditions.
The death cross and golden cross are technical analysis terms for when a moving average (MA) intersects with another from either above or below.
The cross, depending on which it is, can signal the start of a new trend or the end of one.
Squeeze signs signifies low volatility, market preparing itself for an explosive move up or down direction.
Bullish Pullbacks are widely seen as buying opportunities after an asset has experienced a large upward price movement. Most pullbacks involve an asset's price moving to an area of technical support , such as a moving average, before resuming their uptrend.
Bearish Pullbacks are widely seen as selling opportunities after an asset has experienced a large downward price movement. Most pullbacks involve an asset's price moving to an area of technical resistance , such as a moving average, before resuming their downtrend.
A breakout refers to when the price of an asset moves above a resistance area, breakdown refers to when the price of an asset moves below a support area.
Breakouts/breakdowns indicate the potential for the price to start trending in the breakout direction.
For example, a breakout to the upside from a chart pattern could indicate the price will start trending higher.
Volume rush signs appears when the trading volume increases more then a usual period. It can be useful with combining breakout signals as a confirmation.
4) Momentum Strength
Momentum Indicator helps you to identify potential reversal areas .
Calculation done with using Relative Strength Index (RSI), Money Flow Index (MFI) and Average Directional Movement Index (ADX) indicators.
On full strength bearish movement bars paints as light red , full strength bullish movement bars paints as light green color.
They indicates that trend can be change to opposite direction in a short period of time.
Momentum Strength have three modes which are "Aggressive, Moderate and Conservative" . You can customize the mode on settings screen.
Boom Hunter XLBoom Hunter XL is a professional trading tool designed to expose perfect entries and incredible exits. This complete ground up rebuild of Boom Hunter Pro is an absolute essential for any professional trader or anyone serious about trading. Boom Hunter XL includes many upgrades to the Pro version such as volume pressure analysis, improved pressure dots, two new support and resistance lines and volume breakout detection. It also has options to display current volume and average volume it the top right corner.
A new and improved Volume Pressure Analysis exclusive to Boom Hunter XL can be turned on or off in the settings. This provides relative volume information highlighting anomalies and key movements. It also shows volume pressure. Sometimes when crossing a support or resistance line it takes a lot of volume to move price just a little. When price action crosses or bounces off a SR line it requires very little volume to move the price a lot. What this means is traders can visually see price action getting pulled in or pushed away from a SR line. The current bar shows live directional pressure. Volume pressure is used to confirm entries and continuations.
Red wave is the main support resistance line dictating short term trend direction. Enter trades after the oscillator crosses through or even better with pressure dots or volume pressure. If the oscillator is above the red wave it is an up trend and if it is below its a down trend.
The gray wave shows medium term support/resistance and general trend. This line is much harder to cross. Price action can easily bounce within this wave or get rejected.
The strongest SR lines are the top and bottom gray lines. The resistance line will bottom out under pressure and expose a low point. Likewise the support line will roof and expose a high point.
When there is extreme pressure the gray line will drag. This signal suggests that price action will will pullback and retest and push again. Avoid entering trades in these moments as the true bottom/top has not been exposed. Following price action along longer timeframe charts will help find the true low/high.
Tracking traditional patterns makes it easy to find the next breakout and direction.
Bear patterns
Bull patterns
Volume breakouts
Drawing support and resistance lines
Example of some of the signals: