CDC Action Zone - 3Commas AlertCDC Action Zone, The well know indicator using EMA 12 and EMA 26.
When EMA 12 crosses EMA 26 will be a signal to trade.
You can change EMA that you want from settings.
This indicator work with 3Commas - Crypto DCA Bot . (Tradingview custom signal)
You can get a "BOT ID" and "Email token" from 3Commas when you create a bot.
Add into text box in indicator's settings.
After that create alert in Tradingview
Check webhook and using Url below for send signals to 3Commas bot.
3commas.io
This indicator will alert 40 Symbols at one time. (Tradingview set max symbols at 40)
If you want to alert more than 40 symbols, you can change symbols from settings and create new alert.
Pesquisar nos scripts por "bot"

DiscordWebhookFunctionLibrary "DiscordWebhookFunction"
discordMarkdown(_str, _italic, _bold, _code, _strike, _under) Convert string to markdown formatting User can combine any function at the same time.
Parameters:
_str : String input
_italic : Italic
_bold : Bold
_code : Code markdown
_strike : Strikethrough
_under : Underline
Returns: string Markdown formatted string.
discordWebhookJSON(_username, _avatarImgUrl, _contentText, _bodyTitle, _descText, _bodyUrl, _embedCol, _timestamp, _authorName, _authorUrl, _authorIconUrl, _footerText, _footerIconUrl, _thumbImgUrl, _imageUrl) Convert data to JSON format for Discord Webhook Integration.
Parameters:
_username : Override bot (webhook) username string / name,
_avatarImgUrl : Override bot (webhook) avatar by image URL,
_contentText : Main content page message,
_bodyTitle : Custom Webhook's embed message body title,
_descText : Webhook's embed message body description,
_bodyUrl : Webhook's embed body direct link URL,
_embedCol : Webhook's embed color,
_timestamp : Timestamp,
_authorName : Webhook's embed author name / title,
_authorUrl : Webhook's embed author direct link URL,
_authorIconUrl : Webhook's embed author icon by image URL,
_footerText : Webhook's embed footer text / title,
_footerIconUrl : Webhook's embed footer icon by image URL,
_thumbImgUrl : Webhook's embed thumbnail image URL,
_imageUrl : Webhook's embed body image URL.
Returns: string Single-line JSON format

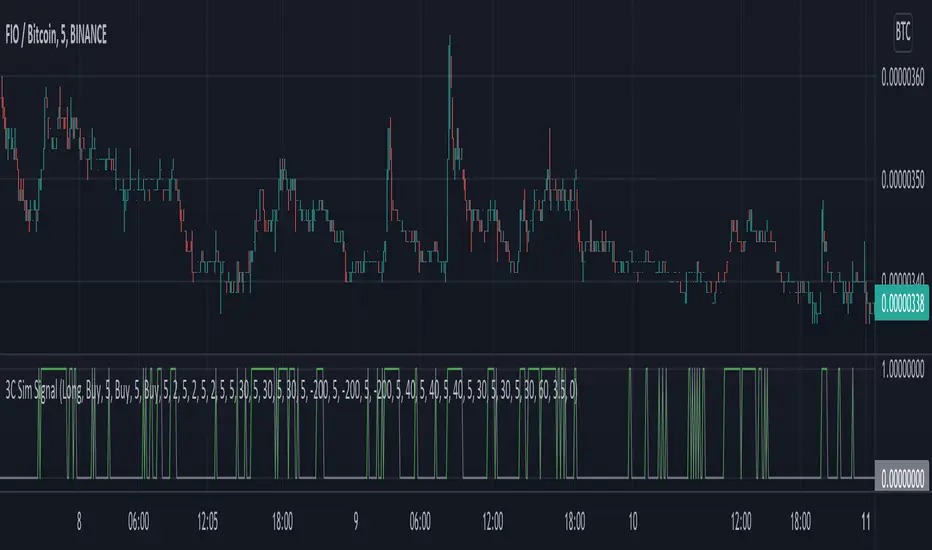
3C Sim SignalThis indicator offers the same deal start conditions available on Backtest script but now as an external signal so you can not only backtest but also set up alerts.
You can use the backtest script to backtest this indicator as an external signal and then once happy with the backtest results send directly tradingview alerts to your own bots on any exchange.
It supports most of the deal start conditions currently available for DCA bots on binance.com for example:
- TV technical ratings: buy, sell, strong buy, strong sell.
- RSI
- MFI
- CCI
- Ultimate Oscilator
- QFL
- min volume filter
Once added to the chart it will plot one when the deal start condition is true and zero when is not.
The conditions can be used in long or short strategy mode.
The biggest advantage compared to using it separately from the DSC already available in the backtest script is that because this is a separated study it will perform faster than the backtest and it resolves repainting issues. This two aspects make these indicator better suited for real time trading while still being able to connect to the backtest as an external indicator therefore still backtestable.
Now you can backtest symbols on any exchange and once your strategy is ready you then can send alerts directly to your bots.
GEMA-Indicador por Neil-------------------
DESCRIPTION
GEMA-INDICATOR is a indicator based on SMA, EMA, WMA, RMA that considers elements such as ADX, DMI, RSI, stochastic, Stoploss, Takeprofit, angles and values at present point.
HOW DOES IT WORK
The component works as an assistant to which you configure the previous elements and you see the performance that it offers you, in such a way that you pass that configuration to GEMA-INDICATOR so that you can receive alerts and do visual trading with notifications or automated trading by sending messages to platforms like 3Commas.
WHY USE IT
The resource operates with one of the most important strategies in the market, which is the price tracking line, which means that if prices go up, we follow it, if prices go down, we follow it; in this way you do not need to make large investments as is often the case with pure BOTs, which require large reserves for security orders.
HOW TO USE IT
Press the "Indicators" option, go to the "Public Library" segment, write the name "GEMA-Indicador por Neil", double click on the record in question and you will have it added in your work panel, now, it only remains to use it and configure its parameters.
-------------------
DESCRIPCIÓN
GEMA-INDICADOR en un indicador basado en SMA, EMA, WMA, RMA que considera elementos como ADX, DMI, RSI, Estocastico, Stoploss, Takeprofit, ángulos y valores a punto presente.
COMO FUNCIONA
El componente funciona como un asistente al que vas configurando lo elementos anteriores y vas viendo el rendimiento que te ofrece, de manera tal, que pases esa configuración a GEMA-INDICADOR para que puedas recibir alertas y hagas trading visual con notificaciones o trading automatizado enviando mensajes a plataformas como 3Commas.
POR QUÉ USARLO
El recurso opera con una de las estrategias mas importantes del mercado, que es la linea de seguimiento de precio, lo que significa que si los precios suben, lo seguimos, si los precios bajan, lo seguimos; de esta manera no necesita realizar grandes inversiones como suele ocurrir con los BOT puros, que exigen grandes reservas para las ordenes de seguridad.
COMO USARLO
Presione la opción "Indicadores", ubíquese en el segmento "Libreria Publica", escriba el nombre "GEMA-Indicador por Neil", haga doble clic sobre el registro en cuestión y lo tendrá agregado en su panel de trabajo, ahora, solo resta usarlo y configurar sus paramertos.

GEMA-Estrategia por neil-------------------
DESCRIPTION
GEMA-STRATEGY is a strategy generator based on SMA, EMA, WMA, RMA that considers elements such as ADX, DMI, RSI, stochastic, Stoploss, Takeprofit, angles and values at present point.
HOW DOES IT WORK
The component works as an assistant to which you configure the previous elements and you see the performance that it offers you, in such a way that you pass that configuration to GEMA-INDICATOR so that you can receive alerts and do visual trading with notifications or automated trading by sending messages to platforms like 3Commas.
WHY USE IT
The resource operates with one of the most important strategies in the market, which is the price tracking line, which means that if prices go up, we follow it, if prices go down, we follow it; in this way you do not need to make large investments as is often the case with pure BOTs, which require large reserves for security orders.
HOW TO USE IT
Press the "Indicators" option, go to the "Public Library" segment, write the name "GEMA-Estategia por Neil", double click on the record in question and you will have it added in your work panel, now, it only remains to use it and configure its parameters.
-------------------
DESCRIPCIÓN
GEMA-ESTRATEGIA en un generador de estrategias basado en SMA, EMA, WMA, RMA que considera elementos como ADX, DMI, RSI, Estocastico, Stoploss, Takeprofit, ángulos y valores a punto presente.
COMO FUNCIONA
El componente funciona como un asistente al que vas configurando lo elementos anteriores y vas viendo el rendimiento que te ofrece, de manera tal, que pases esa configuración a GEMA-INDICADOR para que puedas recibir alertas y hagas trading visual con notificaciones o trading automatizado enviando mensajes a plataformas como 3Commas.
POR QUÉ USARLO
El recurso opera con una de las estrategias mas importantes del mercado, que es la linea de seguimiento de precio, lo que significa que si los precios suben, lo seguimos, si los precios bajan, lo seguimos; de esta manera no necesita realizar grandes inversiones como suele ocurrir con los BOT puros, que exigen grandes reservas para las ordenes de seguridad.
COMO USARLO
Presione la opción "Indicadores", ubíquese en el segmento "Libreria Publica", escriba el nombre "GEMA-Estrategia por Neil", haga doble clic sobre el registro en cuestión y lo tendrá agregado en su panel de trabajo, ahora, solo resta usarlo y configurar sus paramertos.

Mid to High daily % - MA & ThresholdPurpose of this script is to provide a metric for comparing crypto volatility in terms of the % gain that can be garnished if you buy the midpoint price of the day and sell the high***. I'm specifically using bots that buy non-stop. This metric makes it easy to compare crypto coins while also providing insight on what a take profit % should be if I want to be sure it closes often instead of getting stuck in a position.
Added a few moving averages of (Mid-range to High Daily %). When these lines starts to trend down, it's time to lower the take profit % or move on to the next coin.
Decided to add a threshold so I could easily mark where I think the (Mid-range to High Daily %) is for most days.
Ex. I can mark 10% threshold and can eyeball roughly ~75% of the days in the past month or so were at or above that level. Then I know I have plenty volatility for a bot taking 5% profit. Also if you have plenty of periodic poke-through that month (let's say once a week) you might argue that you can set it to 7% if you're willing to wait about that long. Either way this metric is conservative because it is only the middle of the range to the high, a less conservative version might provide the % gain if you bought the day low and sold the day high.
***Since this calculation only takes the middle of the range and the high of the day into account, red days are volatile against a buyer but to your advantage if you are a seller. BUT if you have plenty of safety buy orders this volatility in price only means your total purchase volume increases and when/if you reach a take profit level you sell more there.
Would like to upgrade and add a separate MA line for green days and a separate MA line for red days to discern if that particular coin has a bias. Also would like to include some statistics on how many candles are above or below threshold for a certain period instead of eyeballing.

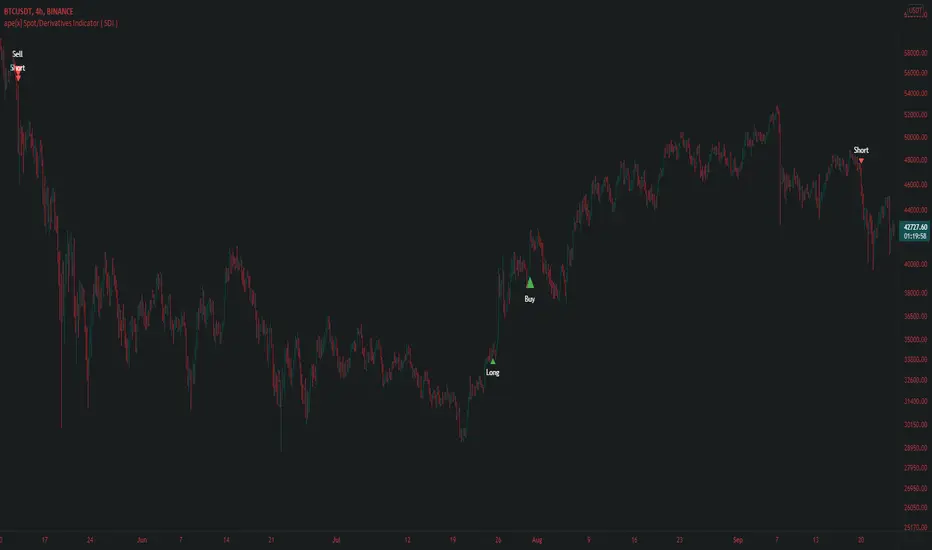
ape[x] Spot/Derivatives Indicator ( SDI )Apex spot and derivatives indicator is the latest generation of volume based algorithmic volatility trend Indicator developed by Quantdegen group.
It is a confluence of multiple modified legacy indicators to suit trader's ease to understand in which direction market is headed.
This generation of apex SDI is also developed with a vision to automate the trades with external third party bots/self scripted bots with the help of trading view alert system.
As we all know market usually outperforms legacy Indicators because they are evolved enough to attack liquidity and take stop loss of those who have poor risk management.
Apex SDI makes sure such attacks do not affect the signals by considering the most important factors like volume and expected volatility. It also confluences higher time frame arrays with lower time frame arrays to filter out the noise which might cause because of LFT volatility.
Quantdegen group is glad to announce this breakthrough in algorithmic trading indicators and make it available for public use.
Price Change Scalping Indicator v1.0 - 3Commas EditionIntroduction
This indicator implements the Price Change Scalping (PCS) strategy specifically for the 3Commas platform. The Input settings have been redesigned to match the same inputs as the 3Commas My Bot Settings page. Only the "Deal Start Condition" section will echo the required PCS-related settings found in the original Price Change Scalping Indicator v1.0 to successfully implement the strategy.
The indicator uses a price rate of change (ROC) momentum calculation to determine the percent change in price between a defined range of bars. The calculated ROC value is then compared to the Upper Threshold and Lower Threshold values to determine if a trade setup is to be activated. If the threshold is crossed, a trade setup will occur based on the indicator settings. Entry, Take Profit, and Stop Loss prices are calculated and displayed on the chart. Once the Entry Price is crossed, a long or short position is created (depending on the direction) and once the Take Profit price is crossed, the position is closed. If the Entry Price is not crossed within a specific number of bars, the trade setup is canceled, and it will proceed to monitor price changes for the next set up.
How is it original and useful?
This indicator is unique in that the strategy version fully supports the TradingView backtester, which will enable you to perform experiments with various settings to evaluate performance using the historical chart data. The study version implements the "Start Deal" and "Close Deal" alerts for you to integrate with 3Comma's "Trading View Custom Signal" start condition. Both script versions will provide the same configuration abilities. The following list is a brief description of its usefulness:
Full support for all possible 3Commas bot settings.
Define a short or long trading strategy.
Price change data source and offset settings.
Your layering placement relative to the entry price.
Your trading parameters like take profit and stop loss offsets, trailing take profit support, exchange commission rates, trading start time, and order size multiplication for each layer.
Flexible trade eligibility rules that can use other chart indicators, like RSI or EMA, to exclude the selection of entry prices for trading.
The visibility of detailed statistics from the chart history pertaining to trading sessions started and closed, session durations, win rate, price action drops and bounces, as well as layer utilization.
The visibility of detailed Used Amount for Each Step table that details how each layer will be allocated for trading.
How does it compare to other scripts in the Public Library?
The indicator offers a very detailed, comprehensive settings to address all types of markets found on TradingView where you can implement the price change scalping strategy. The strategy version can be considered the first of its kind on TradingView to leverage the backtester to provide informative, detailed performance measurements surrounding this unique trading strategy. The study version will implement the latest alert framework called "Any Alert() Function" where you can create a single alert to handle multiple events, which include:
Deal Start
Deal Close
Strategy Results
The default settings are designed to define a "loose" price change settings to ensure that the indicator will render chart elements when first loaded as well as to allow the backtester to gather order executions and display performance summary. The strategy version is using $10,000 initial capital, a commission rate of 0.1% for both entries and exits, and a 1 tick slippage setting. It is also using 3.4881% of the equity for the Base Order Size, 4.7097% of equity for the first Safety Order Size. The Maximum Safety Trade Count is 7 with a Safety Order Volume Scale of 1.33, and a take profit of 2% with no stop loss. All other settings are defaults.
It is recommended that the indicator be "tuned" for your specific market to best implement the price change strategy and obtain better desirable results. You do so by scrolling through the chart's history and observing moments when prices tend to move rapidly. Measure the number or bars it typically takes for the price to change at a specific rate. Using this information, you can adjust the Price Change Settings accordingly to configure the indicator for the chart.
Always keep in mind that past performance may not be indicative of future results. Settings that seem favorable for one market may be found to be disastrous in another. Therefore, do take the time needed to understand how the settings will behave with the given chart symbol.
Enjoy! 😊👍
How to obtain access to the script?
You have two choices:
Use the "Website" link below to obtain access to this indicator, or
Send us a private message (PM) in TradingView itself.

Price Change Scalping Strategy v1.0 - 3Commas EditionIntroduction
This strategy implements the Price Change Scalping (PCS) strategy specifically for the 3Commas platform. The Input settings have been redesigned to match the same inputs as the 3Commas My Bot Settings page. Only the "Deal Start Condition" section will echo the required PCS-related settings found in the original Price Change Scalping Strategy v1.0 to successfully implement the strategy.
The strategy uses a price rate of change (ROC) momentum calculation to determine the percent change in price between a defined range of bars. The calculated ROC value is then compared to the Upper Threshold and Lower Threshold values to determine if a trade setup is to be activated. If the threshold is crossed, a trade setup will occur based on the indicator settings. Entry, Take Profit, and Stop Loss prices are calculated and displayed on the chart. Once the Entry Price is crossed, a long or short position is created (depending on the direction) and once the Take Profit price is crossed, the position is closed. If the Entry Price is not crossed within a specific number of bars, the trade setup is canceled, and it will proceed to monitor price changes for the next set up.
How is it original and useful?
This strategy is unique in that the strategy version fully supports the TradingView backtester, which will enable you to perform experiments with various settings to evaluate performance using the historical chart data. The study version implements the "Start Deal" and "Close Deal" alerts for you to integrate with 3Comma's "Trading View Custom Signal" start condition. Both script versions will provide the same configuration abilities. The following list is a brief description of its usefulness:
Full support for all possible 3Commas bot settings.
Define a short or long trading strategy.
Price change data source and offset settings.
Your layering placement relative to the entry price.
Your trading parameters like take profit and stop loss offsets, trailing take profit support, exchange commission rates, trading start time, and order size multiplication for each layer.
Flexible trade eligibility rules that can use other chart indicators, like RSI or EMA, to exclude the selection of entry prices for trading.
The visibility of detailed statistics from the chart history pertaining to trading sessions started and closed, session durations, win rate, price action drops and bounces, as well as layer utilization.
The visibility of detailed Used Amount for Each Step table that details how each layer will be allocated for trading.
How does it compare to other scripts in the Public Library?
The strategy offers a very detailed, comprehensive settings to address all types of markets found on TradingView where you can implement the price change scalping strategy. The strategy version can be considered the first of its kind on TradingView to leverage the backtester to provide informative, detailed performance measurements surrounding this unique trading strategy. The study version will implement the latest alert framework called "Any Alert() Function" where you can create a single alert to handle multiple events, which include:
Deal Start
Deal Close
Strategy Results
The default settings are designed to define a "loose" price change settings to ensure that the indicator will render chart elements when first loaded as well as to allow the backtester to gather order executions and display performance summary. The strategy version is using $10,000 initial capital, a commission rate of 0.1% for both entries and exits, and a 1 tick slippage setting. It is also using 3.4881% of the equity for the Base Order Size, 4.7097% of equity for the first Safety Order Size. The Maximum Safety Trade Count is 7 with a Safety Order Volume Scale of 1.33, and a take profit of 2% with no stop loss. All other settings are defaults.
It is recommended that the indicator be "tuned" for your specific market to best implement the price change strategy and obtain better desirable results. You do so by scrolling through the chart's history and observing moments when prices tend to move rapidly. Measure the number or bars it typically takes for the price to change at a specific rate. Using this information, you can adjust the Price Change Settings accordingly to configure the indicator for the chart.
Always keep in mind that past performance may not be indicative of future results. Settings that seem favorable for one market may be found to be disastrous in another. Therefore, do take the time needed to understand how the settings will behave with the given chart symbol.
Enjoy! 😊👍
How to obtain access to the script?
You have two choices:
Use the "Website" link below to obtain access to this indicator, or
Send us a private message (PM) in TradingView itself.

Ultimate MACD Strategy [PrismBot] [Lite]Included in this Ultimate MACD Lite Strategy:
✔️ Tweak a multitude of specific settings (MA lengths, R:R, SL distance etc)
✔️ Enable advanced setup filters
✔️ Use money management and risk calculations
✔️ Draw trade info directly to chart (eg. SL size in percent, win rate etc)
✔️ Use various filters (eg. time filter, date filter, MA slope angle etc)
✔️ Manage risk per position when auto-trading forex through AutoView
✔️ Choose from various alert conditions!
✔️ Sync to any bot or algorithmic trading system
Some details about this strategy:
LONG SIGNAL
When the MACD is below the zero line of the histogram, close is above the 200EMA, and the MACD line crosses above the signal line, longs are taken
SHORT SIGNAL
When the MACD is above the zero line of the histogram, close is below the 200EMA, and the MACD line crosses below the signal line, shorts are taken
A couple of options are given for how to calculator stop losses.
The Take profit is calculated by the risk of the stop loss. So a 1.5 take profit target is 1.5 times the stop loss added to the entry price.
There is also an option to filter out trades by the histogram deviation. This prevents crossovers that are too close to the histogram from being taken.
Please note I used the code for the PPO instead of the traditional MACD to make calculating these percentage deviations more consistent across multiple asset types.
You can easily enable and disable strategies using the checkbox.
This strategy incorporates a risk to reward system where the user can select between ATR and Percent based stop losses and take profit targets. This means that the user has much better control over money management when utilizing this strategy and it doesn't require you to babysit the strategy to ensure it's entering and existing strategies in an ideal place.
You can also enter custom messages for alerts for use with bots (set alerts to "alert() function calls only")

Sola Fide [Strategy]Sola Fide High Accuracy with ATR R:R
Indicators used:
- Stochastic RSI
- Chopiness Index
- RSI
- Ichimoku Cloud
- ATR
Script has been set up in strategy format to give backtesting data.
The strategy has been made for BTC and ETH pairs against USDT on the hourly timerframe
Currently outperforming the Buy and Hold Return on both assets.
This script has been made to make it easier to automate strategies on 3commas
In the settings you will see options for BTC strategy or ETH strategy
Choose the asset you are on, copy your 3commas Bot ID and Email token and paste them into the settings box for eachever asset you are on.
To receive the alerts set up within the strategy, in your alert message box use " {{strategy.order.alert_message}}"
This will then be able to send any orders taken on the tradingview script directly to your long or short bot on 3commas
This strategy is set up with a strict set of rules on the ATR for the Take profits and Losses.
There is a repaint warning because the code uses heikin ashi candles through the security function, the given entry and exit signals do not repaint,
I have been automating this for myself with no errors.
You don't need to use more than 3x leverage...
Past results do not guarentee future results.

RSI Hidden Divergence + Stochastic + 200 EMA @DaviddTechHey Traders,
This is my first strategy of many I hope. Inspired by a strategy I found on YouTube I wanted to see if it would work with a BOT strategy.
The idea is :
## LONG ##
* When the price is above 200 EMA take only LONG positions.
* Look for Bullish hidden divergence.
* Stochastic crossover to find our entry.
## SHORTS ##
* When the price is below 200 EMA take only SHORTpositions.
* Look for Bearish hidden divergence.
* Stochastic crossunder to find our entry.
You can used a fixed percentage, ATR, HH/LL or a FIB level to take profit.
Everything is very visual and can be connected easily to a bot.
I will be doing a video on HOW-TO setup in a couple of days.
## MUTLI LEVEL PROFITS ##
This will show you on backtest is you take profits at 3 levels however I have not tested on a BOT strategy.
NOTE : This is for educational purposes and please test on a paper account, as I said this is my first strategy.
I will be working and back testing new strategies every week.
- Made with ♥ @DaviddTech

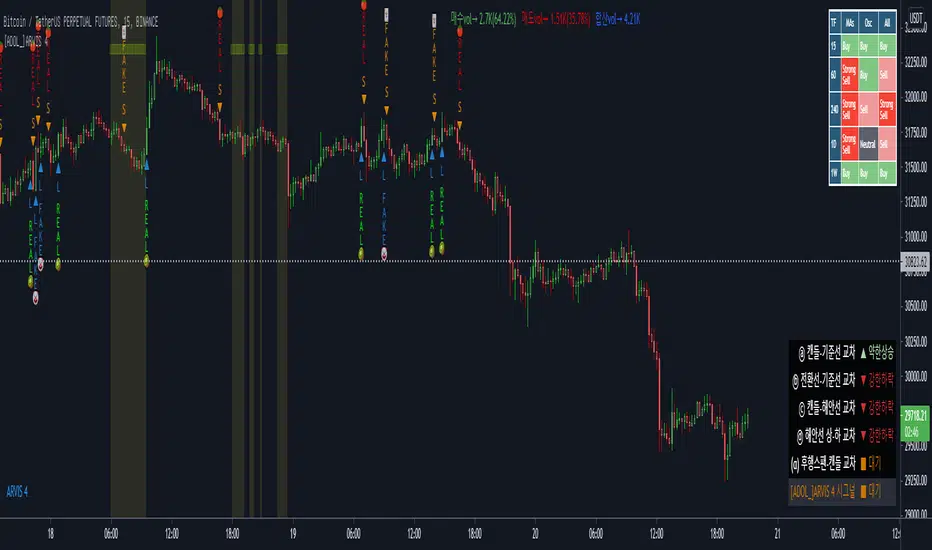
[ADOL_]ARVIS 4ENG) This is the fourth version of ARVIS BOT. It's name is ARVIS 4.
- The previous ARVIS 3 logic was created based on RSI. This version is based on ICHIMOKU, VOLUME, OSCILLATOR, MA. Existing ARVIS users can use it without additional rights.
- This is the most optimized version of the signal generation frequency among the ARVIS series. It was created with the goal of an Easy Trading Tool that users can use easily.
principle)
Features of the new core logic:
- Made on the basis of ICHIMOKU. We found the optimal ICHIMOKU value and made variations to improve readability. We find swing signals and optimal candles based on trading volume and MA.
option)
- The indicator plotting range indicates the range in which to display the indicator.
- L, S are indicated above the variation of ICHIMOKU.
- Breakout Help Line (BHL) is the basis for overlapping breakout criteria. If it breaks through the BHL at the same time as the breaking point, it will be a strong signal.
- Double Breakwater indicates support/resistance. It is mainly used as resistance in the form of breakwater.
- The trend judgment criteria and trend length based on ICHIMOKU determine the uptrend and the downtrend. Use the default settings of High/Low/3 and 7. A length range of 7-40 is recommended.
- Displays information of purchase, sale, and total volume.
- Heart Singal ♥️ is a suitable standard for swing. It is determined only by the time frame, and a value of 3 to 15 minutes is recommended.
- You can display overlapping signals by combining long down and up shot + heart signal of swing / heart signal of swing and L and S.
- Volume above the average trading volume determines the power of candle
- Comprehensive MA and oscillator are displayed in the upper right corner.
- The information window about Ichimoku is displayed in the lower right corner.
- Please refer to the in-index guide.
Example of principle of core function)
It judges the rods of fake and real.
FakeLong🤡 (clown), FakeShort🃏 (joker), Reallong🥝 (kiwi), Realshort🍅 (tomato).
Clowns and Jokers are mocking fakes.
Long is a key pointing to 'up', so it is indicated as 'kiwi'. Shorts 'sat' the volume down, so we mark them as 'tomatoes'.
It judges an upshort shot and a downtrend long. The uptrend and long downtrend are the Big Trend, which is the standard for the biggest trend.
The swing signal is displayed as ♥️. Volatility alerts appear with a yellow background and ■ in the form.
In the case of L and S combined with ascending and descending longs and swing signals, the decline is a fall, so it is indicated by a shooting star ☄️ and a rise as a burning flame 🔥
time frame)
Available for all timeframes. It is recommended to set the alert at the 15th minute for the heart signal of the swing.
alarm)
All alerts can be set for signals displayed on the chart.
trading method)
1. Reproduced the chart, abbreviated all criteria with signals. Simply follow the signal.
2. Bot settings: Recommended is the use of Heart Signal ♥️ and Real L,S.
If you use long downtrends and uptrends as your main trading standards, you will trade with signals of uptrends and longshorts. Study more combinations.
Reference)
You are solely responsible for any trading decisions you make.
How to use)
It is set to be available only to invited users. When invited, tap Add Indicator to Favorites at the bottom of the indicator.
If you click the indicator at the top of the chart screen and look at the left tab, there is a Favorites tab. Add an indicator by clicking the indicator name in the Favorites tab.
KOR) ARVIS BOT의 네번째 버전입니다. 이름은 ARVIS 4.
- 이전 ARVIS 3은 RSI를 기반으로 로직이 만들어 졌습니다. 이번 버전은 ICHIMOKU 와 VOLUME, OSCILLATOR, MA를 기반으로 만들어 졌습니다. 기존의 ARVIS 이용자는 추가 권한없이 이용가능합니다.
- ARVIS 시리즈 중 신호발생빈도가 가장 최적화된 버전입니다. 사용자가 쉽게 사용할 수 있는 Easy Trading Tool을 목표로 만들어졌습니다.
원리)
새로운 핵심적인 로직의 기능 :
- ICHIMOKU를 기반으로 만들어졌습니다. 최적의 ICHIMOKU 값을 찾고 변주를 만들어 가독성을 향상시켰습니다. 거래량과 MA를 기반으로 스윙시그널과 최적의 캔들을 찾아냅니다.
옵션)
- 지표 플로팅 범위는 지표를 표시할 범위를 나타냅니다.
- L, S는 ICHIMOKU의 변주 위에 표기 됩니다.
- Breakout Help Line(BHL)은 돌파기준의 중첩 근거가 됩니다. 돌파하는 기준의 시점에서 BHL을 같이 돌파해준다면 강한 신호가 됩니다.
- Double Breakwater는 지지/저항을 나타냅니다. 방파제의 형태로 주로 저항으로 사용합니다.
- ICHIMOKU기반으로 만들어진 추세판단 기준과 추세길이는 오름숏과 내림롱을 결정합니다. 고저종/3 과 7의 기본 세팅을 사용합니다. 길이는 7~40의 범위를 추천합니다.
- 매수,매도,합산 볼륨의 정보를 표시합니다.
- Heart Singal ♥️ 은 스윙에 적합한 기준이 됩니다. 시간프레임으로만 결정하며 3분~15분 값을 추천합니다.
- 내림롱과 오름숏 + 스윙의 Heart Signal / 스윙의 Heart Signal과 L,S 을 결합해서 중첩한 시그널을 표기할 수 있습니다.
- 거래량 평균이상의 Volume을 캔들의 힘을 가려냅니다.
- 종합 MA와 오실레이터가 우측상단에 표시됩니다.
- 일목균형에 관한 정보창이 우측하단에 표시됩니다.
- 지표내 가이드를 참고하십시오.
핵심기능의 원리 예시)
fake와 real의 봉을 판단합니다.
FakeLong🤡(광대), FakeShort🃏(조커), Reallong🥝(키위), Realshort🍅(토마토) 로 표기됩니다.
광대와 조커는 조롱을 하는 fake입니다.
롱은 '위'를 향하는 key가 되므로 '키위'로 표시합니다. 숏은 아래로 물량을 '토'해내므로 '토마토'로 표시합니다.
오름숏과 내림롱을 판단합니다. 오름숏과 내림롱은 가장 큰 추세의 기준인 Big Trend 입니다.
스윙시그널은 ♥️ 로 표시됩니다. 변동성 경고는 노란색 배경과 ■ 형태로 출현합니다.
오름숏과 내림롱, 스윙시그널과 결합되는 L,S의 경우 하락은 떨어지는 것이므로 유성 ☄️ 으로, 상승은 타오르는 불꽃 🔥 으로 표시됩니다.
타임프레임)
모든 시간프레임에서 사용가능합니다. 스윙의 Heart Signal은 15분봉에서 얼러트를 설정하는 것이 좋습니다.
알람)
차트에 표기되는 시그널에 모든 얼러트를 설정할 수 있습니다.
매매방법)
1. 차트를 복기하고, 시그널로 모든 기준을 축약했습니다. 단순히 시그널을 따르십시오.
2. 봇의 설정 : 추천은 하트시그널 ♥️ 과 Real L,S의 활용입니다.
내림롱과 오름숏을 주거래 기준으로 삼는다면, 오름숏과 내림롱의 시그널로 거래를 할 것입니다. 더 많은 조합을 연구하십시오.
참고)
귀하가 내리는 모든 거래 결정은 전적으로 귀하의 책임입니다.
사용방법)
초대된 사용자만 사용할 수 있도록 설정이 되어있습니다. 초대를 받을 경우, 지표 하단의 즐겨찾기에 인디케이터 넣기를 누릅니다.
차트화면 상단에 지표를 눌러서 왼쪽탭에 보면 즐겨찾기 탭이 있습니다. 즐겨찾기 탭에서 지표이름을 눌러서 지표를 추가합니다.
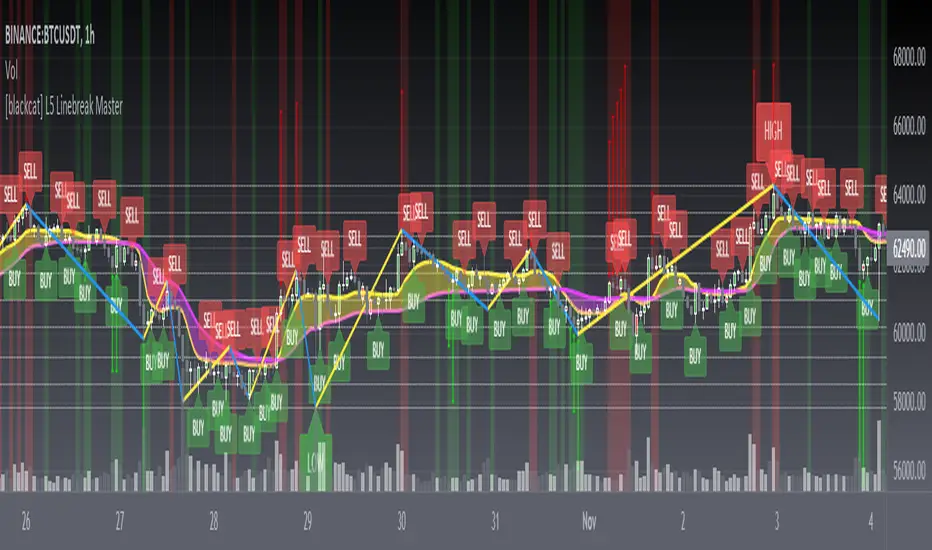
[blackcat] L5 Linebreak MasterLevel: 5
Background
Like many people in the Tradingview community, I have been studying how to apply Line Break Chart to backtesting and live trading for long. However, as we all know, the official Tradingview Line Break Chart is not recommended for backtesting because it will lead to unrealistic backtesting results. So, I thought about developing a Line Break Chart that can be used for backtesting and trading. This "L5 Linebreak Master" is one of them that I am introducing today.
This indicator is based on OHLC data, because this kind of chart can be used for reliable backtesting and live trading in Tradingview. Therefore, the Linebreak Master in this script can actually coexist with the standard Japanese candlestick chart, but the trend reversal information it prompts is based on a principle similar to Line Break Chart. When the two can coexist and produce trading signals at the same time, this is really a very interesting invention.
Function
Linebreak charts were developed in Japan and popularized here by Steve Nisson in his book Beyond Candlesticks. The purpose of linebreak charts is to filter out market noise and give a clear indication of the current trend and trend reversals. As you may know, sometimes determining the current trend can be difficult due to market price movement that consolidates, and a trend reversal can be just as difficult. The green and red bars are called lines. Notice that whenever we have consecutive green lines, each line has a higher close than the previous one; when we have consecutive red lines each line has a lower close than the previous line.
First of all, this Linebreak chart can coexist in the main chart with the Japanese candlestick chart. However, many parts may be overlapped with Japanese candle stick to see it clearly. My recommendation is that users can click "Settings" of main chart and turn off default candle chart.
Secondly, this Linebreak chart can be used for backtesting strategies, because it is essentially OHLC data. And the absolute values of the price is based on the original OHLC data. The certainty of the trend reversal is relatively high. It can be compared with Japanese candlesticks on the timeline.
Finally, this Linebreak chart is embedded with a Linebreak intrinsic trading strategy, which can be used to locate entry points through red and green labels. This strategy supports Tradingview alerts. You can get "LONG" or "SHORT" trading reminders by creating alerts. In order to obtain a clear market structure, Zen Stroke (Autolength ZigZag ), Zen Kiss (Special Moving Averages), Fibnacci Retracement Golden Levels, Unique Fibnacci Time windows and Dynamic Fibonicci support and resistance arrows can be checked to be superimposed and displayed on the main chart to facilitate understanding of the temporal and spatial position of prices in the market.
A trading system based on linebreak charts must must have all entries and exits based on the close or open of a line. The two key values of a linebreak chart are the linebreak number and the underlying time interval. We can construct linebreak charts based on daily, weekly, 5 minute, hourly, any time frame. This allows us to adapt it for day trading or swing trading systems. I developped an inheret linebreak strategy with labels facilitate you to locate trend reversals.
Indicator Set
Linebreak Master Chart (新价图)
Zen Stroke (Auto ZigZag , 自动画缠论笔)
Zen Kiss Moving Averages (缠论均线)
Fibnacci Retracement Golden Levels (半对数-黄金分割线)
Unique Fibnacci Time windows (独创的斐波那契时间窗口)
Dynamic Fibonicci support and resistance arrows (动态斐波那契支撑和阻力箭头)
Inputs
Source Type: Open, High, Low, Close, Hl2, Hlc3, Lx, Vwapc, Vwaplx, Vwaphl2 (Case Sensitive)
Returns source input selection variant, default to "Close" if blank or typo.
Open --> open
High --> High
Low --> Low
Close --> Close
Hl2 --> hl2
Hlc3 --> hlc3
Lx --> Lao Xu 1949 Median Price
Vwapc --> vwap based on close
Vwaplx --> vwap based on Lao Xu 1949 Median Price
Vwaphl2 --> vwap based on hl2
Show Zen Stroke --> True as default
Show Fib Space based on Semi-LOG --> True as default
Zen Fractals Lookback Period --> 377 as default
Key Signal
Bars
Green bars for up trend
Red bars for down trend
Labels
Green labels for buy/long.
Red labels for sell/short.
Zen Stroke ( ZigZag )
Green line section for up stroke
Red line section for down stroke
Moving Averages
Yellow for fast line
Fuchsia for slow line
Pros and Cons
Suitable for discretionary trading and bots via alerts. However, only well selected trading pair and time frame can guarantee bot works.
Intuitive and effective, the output signal is more reliable after multi-indicator resonance
Remarks
My fourth L5 indicator published
Closed-source
Invite-only
How to get it?
500 Tradingview Coins Per Monthly Subscription
5000 Tradingview Coins Per Yearly Subscription
nonoiraq indicator it's very strong i edit this indicator to connect it with my bot to auto trading and he take the info from the volume, so when he is give me a single the bot take just 0.50% to 1% for 3 - 5 trade in day and this perfect, if u use a manual trading this indicator can reach to from 10% to 80% in some point .
the indicator have 3 line
(Red , Purple, Yellow)
1- The yellow line it's high sensitivity this mean it's when rich to the -3 or 3 you can open the order when the bar is close and the signal be sure
and u need to watch the your order because in some case he is reach to 0.30% to 2% and the price reflected to loss and when you wait the price reflected to but my advice you take profit and close the order directly.
2- The purple circles it's medium sensitivity this mean when the purple hit the 2.5 or 3 from down or up in indicator with yellow line you open the order when bar close and the signal is be sure , like example in the photo
3- The red circles it's low sensitivity and this one when reach to 3.0 with any line (yellow or purple) you open directly short or long , like the example in the photo
i am sorry for my english it's not very good
please support me to share other idea or script

Take America Back Version 1.0So basically, the when the price goes down a little, it buys, and when it goes up a little it buys. The only indicators are account balances, and the price, that’s it. Now I wish that Pine Script had a function or variable in which I could recall the balances of specific portions of the portfolio, but it doesn’t. So, I had to improvise. Now for this to work accurately, all of the money needs to be in the “base” side before the bot can begin. Now, the thing about this is that it does not re-invest the amount that is “saved” to all but guarantee the balance will go up. However, as this goes up it will not add up as quickly in order to allow more wiggle room so that the bot does not work itself into a corner. If you want to keep some of your base, enter how much you want to keep it in the initial “saved” setting, as long as you allow at least enough to be equal to the default quantity value. Also, I recommend you setting the pyramiding setting to the result of the base value divided by the default quantity value. The default quantity value is how much you invest, measured in the base currency.
This would have been sooooo much easier if pine script could allow me to recall specific balances, but maybe a future one will.
Finally, THIS is why I made this program, I wanted to create something that would prevent the little ones from being stepped on by the big players who don't always play fair.
Besides, cryptocurrencies were made in response to the 2008 financial meltdown that caused a global recession. This decentralized currency is not just the money of the banks, the corporations, or the governments, but the money of the people. Use this tool to level the massive wealth inequality in my country and take America Back.
I will post more links and updates later once my reputation score goes up. I will discuss more about what influenced me to make this program and as some advise and possible future improvements as well.

[blackcat] L5 Renko MasterLevel: 5
Background
Like many people in the Tradingview community, I have been studying how to apply Renko charts to backtesting and live trading for long. However, as we all know, the official Tradingview Renko chart is not recommended for backtesting because it will lead to unrealistic backtesting results. So, I thought about developing a set of customized Renko charts that can be used for backtesting and second-level trading. This "L5 Renko Master" is one of them that I am introducing today.
In fact, this is not a Renko chart based on Tick's principle. It is based on OHLC data, because this kind of chart can be used for reliable backtesting and trading in Tradingview. Therefore, the Renko Master in this script can actually coexist with the standard Japanese candlestick chart, but the trend reversal information it prompts is based on a principle similar to Renko. When the two can coexist and produce trading signals at the same time, this is really a very interesting invention.
Function
First of all, this Renko chart can coexist in the main chart with the Japanese candlestick chart. It can support up to 1 second level of display and trading. By configuring two parameters, you can adapt it to different Time Frames.
Secondly, this Renko chart can be used for backtesting strategies, because it is essentially OHLC data. Although the absolute value of the price cannot correspond to the original OHLC one-to-one, the certainty of the trend reversal is relatively high. It can be compared with Japanese candlesticks on the timeline.
Finally, this Renko chart is embedded with a Renko intrinsic trading strategy, which can be used to locate entry points through red and green labels. This strategy supports Tradingview alerts. You can get "LONG" or "SHORT" trading reminders by creating alerts. In order to obtain a clear market structure, Zen Stroke (Autolength ZigZag) and Zen Kiss (Special Moving Averages) can be checked to be superimposed and displayed on the main chart to facilitate understanding of the temporal and spatial position of prices in the market.
Indicator Set
Renko Master Boxes (砖块图)
Zen Stroke (Auto ZigZag , 自动画缠论笔)
Zen Kiss Moving Averages (缠论均线)
Inputs
Price --> Price source used to produce Renko, close is default.
RefBarBack --> Lookback period length to calculate Renko. The larger value, the less sensitive to price ripples and sideways.
BoxPerc --> Internal box percentage input. The larger value, the less sensitive to price ripples and sideways.
Show Zen Stroke (AutoLen ZigZag)? --> Switch to turn on and off ZigZag.
Shown Renko MA? --> Switch to turn on and off special moving averages.
Key Signal
Bricks
Green bricks for up trend
Red bricks for down trend
Labels
Green labels for buy/long.
Red labels for sell/short.
Zen Stroke (ZigZag)
Green line section for up stroke
Red line section for down stroke
Moving Averages
Yellow for fast line
Fuchsia for slow line
Pros and Cons
Suitable for discretionary trading and bots via alerts. However, only well selected trading pair and time frame can guarantee bot works.
Intuitive and effective, the output signal is more reliable after multi-indicator resonance
Remarks
My third L5 indicator published
Closed-source
Invite-only
Redeem Fee Life Lock Guarantee
Although I take the efforts to inform the script requesters that the best way to promote trading skills is to learn from the open source scripts I released by themself and to improve their PNIE script programming skills, there are still many people asking how to obtain or pay to use BLACKCAT L4/L5 private scripts. In fact, I do not encourage people to use Tradingview Coins ( TVC ) / Cryptocurrency to redeem the right to use BLACKCAT L4/L5 scripts. However, redeeming private script usage rights through TV Coins/ Cryptocurrency may be an effective way to force more people to learn PINE script programming seriously. And then I can concentrate on answering more valuable community questions instead of being overwhelmed by L4/L5 scripting permission reqeusts.
I would like to announce a ‘Redeem Fee Lock Guarantee’ program to further simplify the L4/L5 indicator/strategy utility offering and distinguish itself from the competition. ‘Redeem Fee lock guarantee’ is one of the major initiatives by BLACKCAT as a part of overall value packaging designed to guard BLACKCAT’s followers’ against cost-overruns and operational risks usually borne by them when it comes to PINE script innovation ecosystem. The TVCs redeemed for L4/L5 a follower signs up for with BLACKCAT is their guaranteed lifetime locked in TVC Quantity/ cryptocurrency, with no special conditions, exclusions and fine print whatsoever. Based on this scheme, I can constantly refine, expand, upgrade and improve PINE script publishing to ensure the very best experiences for my followers. The 'Redeem Fee Lock Guarantee' is a step in the direction of rewarding the valuable followers. NOTE: Every L4/L5 script redeeming service is ONLY limited to TVC or Cryptocurrency ("Win$ & Donate w/ This" Addresses displayed on script page) redeeming which the 1st signed up TVC Qty/ equivalent cryptocurrency is the lifetime offered TVC Qty/ equivalent crypto.
How to subscrible this indicator?
The script subscription period only has two options of one month or one year, and its price is floating. The latest price of the script subscription is proportional to the number of likes/agrees this script has already received. Therefore, the price of subscribing to this script shows an increasing trend, and the earliest subscribers can enjoy the price of lifetime lock to this script. As the number of likes / agrees of this script increases, the subscription fee for one month and one year will also increase linearly. Whatever, the first subscription price of the use will be locked for life.
Monthly subscription and annual subscription can be done either by tradingview coins ( TVC ) or by converting into equivalent cryptocurrency at the exchange rate (1TVC=0.01USD) for redeem.
TVC payment needs to pay TVC directly in the comments under this script. Every time I authorize a new user, I will update the latest number of subscribed users and latest price for next subscription under the script comment. If there are any conflicting scenario happened to the rules and my update. My updated price based on the rule will be the final price for next subscription. The following subscribers need to pay the corresponding amount of TVC or cryptocurrency in accordance with the latest number of users and price announced by me in accordance with the rules published.
TVC redemption is the method I strongly recommend, and I hope you can complete the redemption in the comment area of this script. This is like a blockchain structure, each comment is a block, each subscription is a chain, which is conducive to open and transparent publicity and traceability to avoid unnecessary disputes.
Monthly Subscription Charges
500TVC <50 Agrees (A)
50A<850TVC<100A
100A<1000TVC<150A
150A<1350TVC<200A
200A<1500TVC<250A
250A<1850TVC<300A
300A<2000TVC<350A
350A<2350TVC<400A
400A<2500TVC<450A
450A<2850TVC<500A
500A<3000TVC<550A
550A<3350TVC<600A
600A<3500TVC<650A
650A<3850TVC<700A
700A<4000TVC<750A
750A<4350TVC<800A
800A<4500TVC<850A
850A<4850TVC<900A
900A<5000TVC<950A
950A<5350TVC<1000A
1000A<5500TVC<1050A
And so on...
Annual Subscription Charges
5000TVC <50 Agrees (A)
50A<8500TVC<100A
100A<10000TVC<150A
150A<13500TVC<200A
200A<15000TVC<250A
250A<18500TVC<300A
300A<20000TVC<300A
350A<23500TVC<400A
400A<25000TVC<450A
500A<28500TVC<550A
500A<30000TVC<550A
550A<33500TVC<600A
600A<35000TVC<650A
650A<38500TVC<700A
700A<40000TVC<750A
750A<43500TVC<800A
800A<45000TVC<850A
850A<48500TVC<900A
900A<50000TVC<950A
950A<53500TVC<1000A
1000A<55000TVC<1050A
And so on...

Technicals Rating Strategy v420Ichimoku, HMA, RSI, Stoch, CCI, MACD, Technicals Rating Strategy is a trading Bot that looks at these chosen indicators and assigns a value to each, then calculates the result of adding each indicators result value to a overall rating, which is then compared to a user set level. Here seen on Bitcoin, it has the broker fee included in the testing result. If you choose to use it on Forex etc, perhaps remove the broker fee which is unrealistic for FX trading.
It has a Win/Loss ratio of only 40% wins, but it catches the big moves and thats the main thing, so if ELON MUSK had of used this strategy instead of BUY and HOLD, he could of made 700% instead of 7% (as is, may, 2021)
Mainly intended for use as Automated TRADE BOT.
(imagine if Elon Musk did use this bot with his 1.3 billion $ worth of BTC, the drawdown would be like, half a billion or something haha (p.s.- use smaller lotsize % to get smaller drawdown, but then smaller profit....) )
For use with any pair and timeframe. In fact there is a timeframe setting to set the strategy to look at alternative timeframe from chart, but as default will just be set to charts timeframe.

Multiple Timeframe Fib Bollinger Bands - can be used for 3commas*** This idea is based on Bollingers Bands Fibonacci ratios by Shizaru ()
** This will look less chaotic if you don't have all four time frames on at once! I left them on for the demo picture just to show them all simultaneously working.
This is the basis for most of my bot ideas - indicators from longer chart time frames laid over short time frame charts. What I mean by this is that I like the responsiveness of a 1m chart but indicators from a 1h or 4h chart. There are obviously downsides to doing this or everyone would do it, but I have consistently gotten top results using this method. This is a study, so not a strategy yet but you can use this with 3commas if you convert it to a strategy using band crossover/under points as buy and sell triggers.
That is super easy; just follow this excellent guide here which should work for this script:
kodify.net
It's not super hard if you know a little Pine but if you need help hit me up and we can figure something out.
This script by default has 15m, 30m, 1h and 4h settings that are configurable via the gear icon. You can enable or disable any time frame, change the color, etc. I will probably add accurate line labels, custom time frames and adjustable transparency soon.
It's advisable to use higher time frame indicator on a lower time frame chart, but not the other way around. I would use these indicators on a 1m chart but not a 1d chart, for example.
Have fun and I hope you get some use out of this! I use it for context more than bots but it is definitely possible to use it with both.

Cyatophilum Strategy BuilderAn indicator to create strategies, backtest and setup alerts.
The user can choose one or multiple TA entry conditions, if more than one the conditions are combined with a logical AND.
The entries will open up a trade, which is then handled by a risk management system including Trailing Stop, Take Profit and up to 100 Safety Orders.
This indicator can be used to backtest 3commas DCA bots who are using TA presets, RSI or ULT.
Its main goal is to create strategies by combining indicators.
Let's dive into the details of what's included:
Entry Condition: MACD
Triggers an entry when macd crosses with the signal line.
Configure the fast, slow length, signal smoothing and timeframe to trigger the condition.
Entry Condition: RSI
Triggers an entry when the RSI is higher or lower than the long/short threshold.
Configure the length, timeframe, long and short threshold to trigger the condition.
Entry Condition: ULT (Ultimate Oscillator)
Triggers an entry when the ULT is higher or lower than the long/short threshold.
Configure the 3 lengths, timeframe, long and short threshold to trigger the condition.
Entry Condition: Bollinger Bands
Triggers an entry when the price is above the upper band for long and below the lower band for short.
Configure the length, standard deviation and timeframe to trigger the condition.
Entry Condition: MFI (Money Flow Index)
Similar to RSI, it triggers an entry when the MFI is higher or lower than the long/short threshold.
Configure the length, timeframe, long and short threshold to trigger the condition.
Entry Condition: CCI (Commodity Channel Index)
Another oscillator that triggers an entry when its value is higher or lower than the long/short threshold.
Configure the length, timeframe, long and short threshold to trigger the condition.
Trend Filters
Use one or two trendlines to filter your trades: go only long/short when the trendline is bullish/bearish.
Choose between the several trendlines: ema, sma, wma, hull ma, kama, alma, rma, swma, vwma, Tilson T3, and the unique Adaptive T3 and Adaptive Hull MA.
If this is not enough, you can use the external trendline feature to plug in any other indicator for your trendline.
The second trendline can be MTF and come from another symbol if needed.
Combining Indicators
Most of the time we will not be using a single indicator at a time, but instead, combine them in order to get stronger entries.
The entry conditions are combined using a AND logical gate, meaning all conditions must be true for the entry to trigger.
Here is an example using a combination of 2 indicators: Bollinger Bands and RSI.
We can see less entries are being triggered on the bottom chart than on the top chart because the bottom chart is combining the 2 indicators while the top chart is only using Bollinger Bands.
You can combine up to all 6 indicators if you want, but keep in mind that combining too many may lead to triggering no entry at all.
Risk Management and Trade system
The indicator will not trigger more than one long or short entry in a row.
To start a new trade, the indicator will wait for either take profit, stop loss or an opposite entry if no SL and TP is set.
Stop Loss and Take Profit
Configure your stop loss and take profit for long and short trades.
You can also make a trailing stoploss and a trailing take profit.
Safety Orders
Just like 3commas bots, you can create a strategy with up to 100 safety orders.
Configure their placement and order size using the price deviation, step scale, take profit type (from base order or total volume), and volume scale settings.
Note: only the 20 first safety order steps or so will be plotted due to graphic limiations. The steps after that still trigger alerts and backtest results.
Creating Alerts
The indicator is using the newest alert system:
1. Write your alert messages in the indicator settings (alert section at the bottom)
2. Click "Create Alert" as usual, but choose "alert() function calls only"
Data Window
Since the indicator is applied on top of the price chart, the oscillator indicators cannot be plotted. You can always add them on another pane but if you want to just see their values, you can use the Data Window to see the value of each oscillator on each bar.
Backtest settings
Used to get the results below:
Initial Capital: 100 000$
Base Order Size: 0.1 contract (BTC)
Safety Order Size: 0.1 contract (BTC)
Commission: 0.1%
Slippage: 100 ticks
pyramiding: 6
The indicator settings are plotted in the main chart panel.

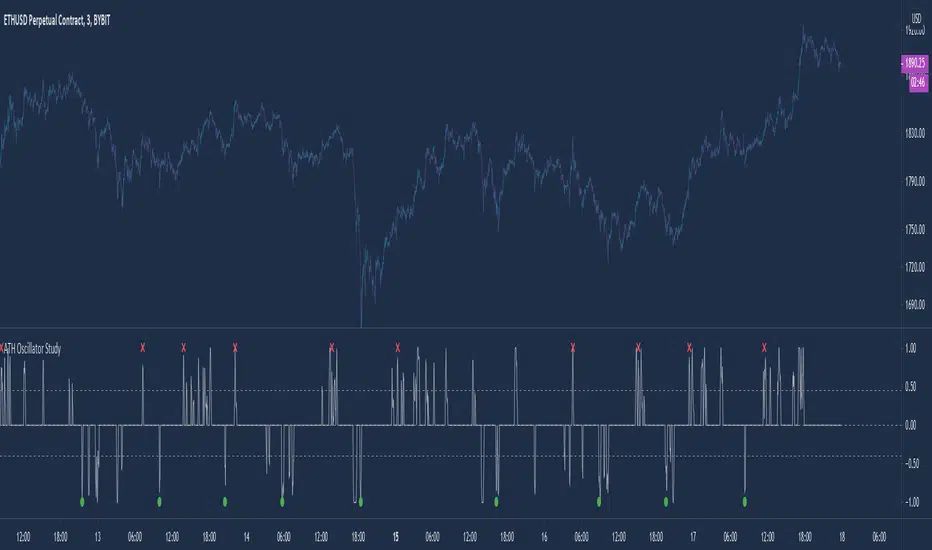
ATH Oscillator StudyThis idea stems from the belief that people want to reverse the trend when an all time high or low is hit. This strategy incorporates that by using ath and atl values based on the lookback period and the signal gets smoothed by the input smoothing type and length. I found that the best time to use this was on the 3m chart. But I am certain that higher time frames can be used if the settings are tweaked.
Settings:
Strategy -
simple(long,short,switch) - This strategy just uses the directional change of the signal using just longs, just short, or switching between the two.
range - This strategy uses the hlines on the chart to determine when to buy and sell. These can be adjusted using the Range Top / Bot values
div - This strategy uses a simple divergence of the signal line to time entries
Lookback - How many bars back to check the ath and atl
Smoothing - How smooth you want the signal
Smoothing Type - Different ways to smooth the signal
Range Top/Bot - Changes the height of the hlines for the range strategies
On Buy/Sell Signal # - Change when you enter. Increasing this number will move the signals to the left if there are consecutive signals. Useful to find bottoms and tops.
Chart: ETHUSD Perp Bybit
Notes: Use on 3-5m time frame for best results. Change settings if you want to try other coins like BTC or higher time frames
ATH Oscillator StrategyThis idea stems from the belief that people want to reverse the trend when an all time high or low is hit. This strategy incorporates that by using ath and atl values based on the lookback period and the signal gets smoothed by the input smoothing type and length. I found that the best time to use this was on the 3m chart. But I am certain that higher time frames can be used if the settings are tweaked.
Settings:
Strategy -
simple(long,short,switch) - This strategy just uses the directional change of the signal using just longs, just short, or switching between the two.
range - This strategy uses the hlines on the chart to determine when to buy and sell. These can be adjusted using the Range Top / Bot values
div - This strategy uses a simple divergence of the signal line to time entries
Lookback - How many bars back to check the ath and atl
Smoothing - How smooth you want the signal
Smoothing Type - Different ways to smooth the signal
Range Top/Bot - Changes the height of the hlines for the range strategies
On Buy/Sell Signal # - Change when you enter. Increasing this number will move the signals to the left if there are consecutive signals. Useful to find bottoms and tops.
Chart: ETHUSD Perp Bybit
Strategy Properties: 100 base order, 100% equity
Notes: Use on 3-5m time frame for best results. Change settings if you want to try other coins like BTC or higher time frames

Super Cipher BThis is the first release of Super Cipher B. The script will get regular updates and includes a user manual.
This is the first release of the script which is already powerful. The script has been designed to work as a binance futures trading bot.
I only recommend using it as it is now on coins that are in a long term bullish market.
I am not responsible for possible losses using this script as no script in the world can 100% guarantee to never take any losses.
The script is a modified version with new strategies and functionality. The original script was published for free by VumanChu, this script is based on the original code of that script. This is a version of the script used for Binance Futures botting and will provide buy Dots which are more failsafe than the original green divergence dot in the VumanChu script.
All info on how to set up the script for botting is inside the user manual: The user manual also includes my current profits on 3commas.
