Theft Indicator - BOOM Buy/Sell SignalsWhat is our indicator?
Theft Indicator - BOOM is a script that shows entry levels on a condition that is met with our special algo. The algo consists of crossovers, which are not visible but we take pride in the effort we have put to make this indicator have a high success rate as long as you have a scalping target price set.
Does it Repaint?
Our indicator does NOT re-paint. Although while setting an alert it may pop up the repaint alert, please take into consideration that once a signal is fired on a "CLOSED BAR", our signal will never disappear, they do not repaint.
What Markets is it usable with?
You can use it in any market, Forex, Stocks, Crypto, Indices. All time frames work, not all trades will be profitable (this is how trading is, you can take a loss sometimes). But the Majority is profitable if you use a stop loss and target price.
How to use:
Simple plug and play it to your chart, in addition to a few other indicators we will recommend to you (we still have not published them yet), and this will confirm your trades. You can also connect TV alerts with a bot and let it run. Please be aware that SLIPPAGE time is important, If you run a bot on this indicator you HAVE to know that the buy/sell price will be on the bar AFTER the Candle close (For example: the BUY/SELL alert is on a candle, the buy/sell your bot or you will execute WILL be in the following candle depending on your trading system. We advise you to not leave the bot to trade on its own, you have to monitor and have a specific syntax that we will help you with creating according to your trading style.
P.S: This is not financial advice, we are just sharing our indicator that we know has good results, and it will take time for people in -ve profiles to recover losses and for the profiting to be more profitable. We use a specific trading method that only works with it
You can contact me for more information about the indicator, Goodluck :)
Pesquisar nos scripts por "bot"

Theft Indicator - Pip GainerWhat is our indicator?
Theft Indicator - Pip Gainer is one of our recent published scripts that shows price action on a certain period of time (We Use a modified version of ATR). We take pride in enabling trading to become easier for the experienced and the non-experienced traders around the globe. Buy & Sell alerts will be fired once a condition in our algo is met.
Does it Repaint?
Our indicator does NOT re-paint. Although while setting an alert it may pop up the repaint alert, please take into consideration that once a signal is fired on a "CLOSED BAR", our signal will never disappear, they do not repaint.
What Markets is it usable with?
This version is dedicated to FOREX markets, we encourage using it for low timeframes starting the 3 minute to the 15 minute timeframe. WE RECOMMEND USING THIS IN THE FOREX MARKET, ESPECIALLY WITH CURRENCY PAIRS.
How to use:
Simple plug and play it to your chart, in addition to a few other indicators we will recommend to you (we still have not published them yet), and this will confirm your trades. You can also connect TV alerts with a bot and let it run. Please be aware that SLIPPAGE time is important, If you run a bot on this indicator you HAVE to know that the buy/sell price will be on the bar AFTER the Candle close (For example: the BUY/SELL alert is on a candle, the buy/sell your bot or you will execute WILL be in the following candle depending on your trading system. We advise you to not leave the bot to trade on its own, you have to monitor and have a specific syntax that we will help you with creating according to your trading style.
How are the Buy/Sell Alerts fired?
We use the simple ATR (Average True Range) indicator. However we have modified the indicator to serve our trading system. Check below for a definition of what ATR is:
What is Average True Range - ATR?
The average true range (ATR) is a technical analysis indicator that measures market volatility by decomposing the entire range of an asset price for that period. Specifically, ATR is a measure of volatility introduced by market technician J. Welles Wilder Jr. The true range indicator is taken as the greatest of the following: current high less the current low; the absolute value of the current high less the previous close; and the absolute value of the current low less the previous close. The average true range is then a moving average, generally using 14 days, of the true ranges.
Why is our indicator special and different from the normal ATR indicators?
We have modified the mathematical equation and changed it slightly to give more accurate signals, we do not promise all trades are profitable, the use of this indicator is up to your own judgement and liability. We believe that we have an indicator like no other ATR.
P.S: This is not financial advice, we are just sharing our indicator that we know has good results, and it will take time for people in -ve profiles to recover losses and for the profiting to be more profitable. We use a specific trading method that only works with it
You can contact me for more information about the indicator, Goodluck :)

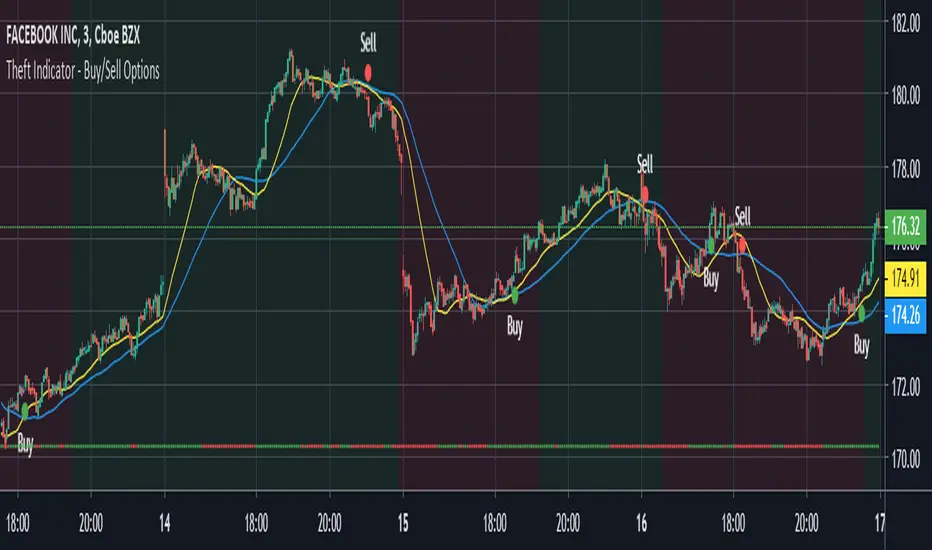
Theft Indicator - Buy/Sell Options Trading 1-3Mins ScalpingWhat is our indicator?
Theft Indicator - Buy/Sell Options Trading Signals is our third published script that shows price action on a certain period of time (We Use ATR indicator). We take pride in enabling trading to become easier for the experienced and the non-experienced traders around the globe. Buy & Sell alerts will be fired once a condition in our algo is met.
Does it Repaint?
Our indicator does NOT re-paint. Although while setting an alert it may pop up the repaint alert, please take into consideration that once a signal is fired on a "CLOSED BAR", our signal will never disappear, they do not repaint.
What Markets is it usable with?
You can use it in any market, Forex, Stocks, Crypto, Indices. All time frames are profitable, not all trades. But the Majority is profitable if you use a stop loss and target price. Although this one is for STOCK OPTIONS, it can work for other markets as well, but it will best perform with STOCKS & OPTIONS TRADING
How to use:
Simple plug and play it to your chart, in addition to a few other indicators we will recommend to you (we still have not published them yet), and this will confirm your trades. You can also connect TV alerts with a bot and let it run. Please be aware that SLIPPAGE time is important, If you run a bot on this indicator you HAVE to know that the buy/sell price will be on the bar AFTER the Candle close (For example: the BUY/SELL alert is on a candle, the buy/sell your bot or you will execute WILL be on the following candle depending on your trading system) THIS IS WITH EVERY SCRIPT, NOT MINE ONLY. We advise you to not leave the bot to trade on its own, you have to monitor and have a specific syntax that we will help you with creating according to your trading style.
How are the Buy/Sell Alerts fired?
We use the simple ATR (Average True Range) indicator. However we have modified the indicator to serve our trading system. Check below for a definition of what ATR is:
What is Average True Range - ATR?
The average true range (ATR) is a technical analysis indicator that measures market volatility by decomposing the entire range of an asset price for that period. Specifically, ATR is a measure of volatility introduced by market technician J. Welles Wilder Jr. The true range indicator is taken as the greatest of the following: current high less the current low; the absolute value of the current high less the previous close; and the absolute value of the current low less the previous close. The average true range is then a moving average, generally using 14 days, of the true ranges.
Why is our indicator special and different from the normal ATR indicators?
We have modified the uniqueness of ATR and changed it slightly to give more accurate signals, we do not promise all trades are profitable, the use of this indicator is up to your own judgement and liability. We believe that we have an indicator like no other ATR.
P.S: This is not financial advice, we are just sharing our indicator that we know has good results, and it will take time for people in -ve profiles to recover losses and for the profiting to be more profitable. We use a specific trading method that only works with it
You can contact me for more information about the indicator, Goodluck :)
Theft Indicator - 5Min Scalping SystemWhat is our indicator?
Theft Indicator - Buy & Sell Alert System is our first published script that shows price action on a certain period of time (We Use ATR indicator). We take pride in enabling trading to become easier for the experienced and the non-experienced traders around the globe. Buy & Sell alerts will be fired once a condition in our algo is met.
Does it Repaint?
Our indicator does NOT re-paint. Although while setting an alert it may pop up the repaint alert, please take into consideration that once a signal is fired on a "CLOSED BAR", our signal will never disappear, they do not repaint.
What Markets is it usable with?
You can use it in any market, Forex, Stocks, Crypto, Indices. All time frames are profitable, not all trades. But the Majority is profitable if you use a stop loss and target price.
How to use:
Simple plug and play it to your chart, in addition to a few other indicators we will recommend to you (we still have not published them yet), and this will confirm your trades. You can also connect TV alerts with a bot and let it run. Please be aware that SLIPPAGE time is important, If you run a bot on this indicator you HAVE to know that the buy/sell price will be on the bar AFTER the Candle close (For example: the BUY/SELL alert is on a candle, the buy/sell your bot or you will execute WILL be in the following candle depending on your trading system. We advise you to not leave the bot to trade on its own, you have to monitor and have a specific syntax that we will help you with creating according to your trading style.
How are the Buy/Sell Alerts fired?
We use the simple ATR (Average True Range) indicator. However we have modified the indicator to serve our trading system. Check below for a definition of what ATR is:
What is Average True Range - ATR?
The average true range (ATR) is a technical analysis indicator that measures market volatility by decomposing the entire range of an asset price for that period. Specifically, ATR is a measure of volatility introduced by market technician J. Welles Wilder Jr. The true range indicator is taken as the greatest of the following: current high less the current low; the absolute value of the current high less the previous close; and the absolute value of the current low less the previous close. The average true range is then a moving average, generally using 14 days, of the true ranges.
Why is our indicator special and different from the normal ATR indicators?
We have modified the mathematical equation and changed it slightly to give more accurate signals, we do not promise all trades are profitable, the use of this indicator is up to your own judgement and liability. We believe that we have an indicator like no other ATR.
P.S: This is not financial advice, we are just sharing our indicator that we know has good results, and it will take time for people in -ve profiles to recover losses and for the profiting to be more profitable. We use a specific trading method that only works with it
You can contact me for more information about the indicator, Goodluck :)

Backtesting & Trading Engine [PineCoders]The PineCoders Backtesting and Trading Engine is a sophisticated framework with hybrid code that can run as a study to generate alerts for automated or discretionary trading while simultaneously providing backtest results. It can also easily be converted to a TradingView strategy in order to run TV backtesting. The Engine comes with many built-in strats for entries, filters, stops and exits, but you can also add you own.
If, like any self-respecting strategy modeler should, you spend a reasonable amount of time constantly researching new strategies and tinkering, our hope is that the Engine will become your inseparable go-to tool to test the validity of your creations, as once your tests are conclusive, you will be able to run this code as a study to generate the alerts required to put it in real-world use, whether for discretionary trading or to interface with an execution bot/app. You may also find the backtesting results the Engine produces in study mode enough for your needs and spend most of your time there, only occasionally converting to strategy mode in order to backtest using TV backtesting.
As you will quickly grasp when you bring up this script’s Settings, this is a complex tool. While you will be able to see results very quickly by just putting it on a chart and using its built-in strategies, in order to reap the full benefits of the PineCoders Engine, you will need to invest the time required to understand the subtleties involved in putting all its potential into play.
Disclaimer: use the Engine at your own risk.
Before we delve in more detail, here’s a bird’s eye view of the Engine’s features:
More than 40 built-in strategies,
Customizable components,
Coupling with your own external indicator,
Simple conversion from Study to Strategy modes,
Post-Exit analysis to search for alternate trade outcomes,
Use of the Data Window to show detailed bar by bar trade information and global statistics, including some not provided by TV backtesting,
Plotting of reminders and generation of alerts on in-trade events.
By combining your own strats to the built-in strats supplied with the Engine, and then tuning the numerous options and parameters in the Inputs dialog box, you will be able to play what-if scenarios from an infinite number of permutations.
USE CASES
You have written an indicator that provides an entry strat but it’s missing other components like a filter and a stop strategy. You add a plot in your indicator that respects the Engine’s External Signal Protocol, connect it to the Engine by simply selecting your indicator’s plot name in the Engine’s Settings/Inputs and then run tests on different combinations of entry stops, in-trade stops and profit taking strats to find out which one produces the best results with your entry strat.
You are building a complex strategy that you will want to run as an indicator generating alerts to be sent to a third-party execution bot. You insert your code in the Engine’s modules and leverage its trade management code to quickly move your strategy into production.
You have many different filters and want to explore results using them separately or in combination. Integrate the filter code in the Engine and run through different permutations or hook up your filtering through the external input and control your filter combos from your indicator.
You are tweaking the parameters of your entry, filter or stop strat. You integrate it in the Engine and evaluate its performance using the Engine’s statistics.
You always wondered what results a random entry strat would yield on your markets. You use the Engine’s built-in random entry strat and test it using different combinations of filters, stop and exit strats.
You want to evaluate the impact of fees and slippage on your strategy. You use the Engine’s inputs to play with different values and get immediate feedback in the detailed numbers provided in the Data Window.
You just want to inspect the individual trades your strategy generates. You include it in the Engine and then inspect trades visually on your charts, looking at the numbers in the Data Window as you move your cursor around.
You have never written a production-grade strategy and you want to learn how. Inspect the code in the Engine; you will find essential components typical of what is being used in actual trading systems.
You have run your system for a while and have compiled actual slippage information and your broker/exchange has updated his fees schedule. You enter the information in the Engine and run it on your markets to see the impact this has on your results.
FEATURES
Before going into the detail of the Inputs and the Data Window numbers, here’s a more detailed overview of the Engine’s features.
Built-in strats
The engine comes with more than 40 pre-coded strategies for the following standard system components:
Entries,
Filters,
Entry stops,
2 stage in-trade stops with kick-in rules,
Pyramiding rules,
Hard exits.
While some of the filter and stop strats provided may be useful in production-quality systems, you will not devise crazy profit-generating systems using only the entry strats supplied; that part is still up to you, as will be finding the elusive combination of components that makes winning systems. The Engine will, however, provide you with a solid foundation where all the trade management nitty-gritty is handled for you. By binding your custom strats to the Engine, you will be able to build reliable systems of the best quality currently allowed on the TV platform.
On-chart trade information
As you move over the bars in a trade, you will see trade numbers in the Data Window change at each bar. The engine calculates the P&L at every bar, including slippage and fees that would be incurred were the trade exited at that bar’s close. If the trade includes pyramided entries, those will be taken into account as well, although for those, final fees and slippage are only calculated at the trade’s exit.
You can also see on-chart markers for the entry level, stop positions, in-trade special events and entries/exits (you will want to disable these when using the Engine in strategy mode to see TV backtesting results).
Customization
You can couple your own strats to the Engine in two ways:
1. By inserting your own code in the Engine’s different modules. The modular design should enable you to do so with minimal effort by following the instructions in the code.
2. By linking an external indicator to the engine. After making the proper selections in the engine’s Settings and providing values respecting the engine’s protocol, your external indicator can, when the Engine is used in Indicator mode only:
Tell the engine when to enter long or short trades, but let the engine’s in-trade stop and exit strats manage the exits,
Signal both entries and exits,
Provide an entry stop along with your entry signal,
Filter other entry signals generated by any of the engine’s entry strats.
Conversion from strategy to study
TradingView strategies are required to backtest using the TradingView backtesting feature, but if you want to generate alerts with your script, whether for automated trading or just to trigger alerts that you will use in discretionary trading, your code has to run as a study since, for the time being, strategies can’t generate alerts. From hereon we will use indicator as a synonym for study.
Unless you want to maintain two code bases, you will need hybrid code that easily flips between strategy and indicator modes, and your code will need to restrict its use of strategy() calls and their arguments if it’s going to be able to run both as an indicator and a strategy using the same trade logic. That’s one of the benefits of using this Engine. Once you will have entered your own strats in the Engine, it will be a matter of commenting/uncommenting only four lines of code to flip between indicator and strategy modes in a matter of seconds.
Additionally, even when running in Indicator mode, the Engine will still provide you with precious numbers on your individual trades and global results, some of which are not available with normal TradingView backtesting.
Post-Exit Analysis for alternate outcomes (PEA)
While typical backtesting shows results of trade outcomes, PEA focuses on what could have happened after the exit. The intention is to help traders get an idea of the opportunity/risk in the bars following the trade in order to evaluate if their exit strategies are too aggressive or conservative.
After a trade is exited, the Engine’s PEA module continues analyzing outcomes for a user-defined quantity of bars. It identifies the maximum opportunity and risk available in that space, and calculates the drawdown required to reach the highest opportunity level post-exit, while recording the number of bars to that point.
Typically, if you can’t find opportunity greater than 1X past your trade using a few different reasonable lengths of PEA, your strategy is doing pretty good at capturing opportunity. Remember that 100% of opportunity is never capturable. If, however, PEA was finding post-trade maximum opportunity of 3 or 4X with average drawdowns of 0.3 to those areas, this could be a clue revealing your system is exiting trades prematurely. To analyze PEA numbers, you can uncomment complete sets of plots in the Plot module to reveal detailed global and individual PEA numbers.
Statistics
The Engine provides stats on your trades that TV backtesting does not provide, such as:
Average Profitability Per Trade (APPT), aka statistical expectancy, a crucial value.
APPT per bar,
Average stop size,
Traded volume .
It also shows you on a trade-by-trade basis, on-going individual trade results and data.
In-trade events
In-trade events can plot reminders and trigger alerts when they occur. The built-in events are:
Price approaching stop,
Possible tops/bottoms,
Large stop movement (for discretionary trading where stop is moved manually),
Large price movements.
Slippage and Fees
Even when running in indicator mode, the Engine allows for slippage and fees to be included in the logic and test results.
Alerts
The alert creation mechanism allows you to configure alerts on any combination of the normal or pyramided entries, exits and in-trade events.
Backtesting results
A few words on the numbers calculated in the Engine. Priority is given to numbers not shown in TV backtesting, as you can readily convert the script to a strategy if you need them.
We have chosen to focus on numbers expressing results relative to X (the trade’s risk) rather than in absolute currency numbers or in other more conventional but less useful ways. For example, most of the individual trade results are not shown in percentages, as this unit of measure is often less meaningful than those expressed in units of risk (X). A trade that closes with a +25% result, for example, is a poor outcome if it was entered with a -50% stop. Expressed in X, this trade’s P&L becomes 0.5, which provides much better insight into the trade’s outcome. A trade that closes with a P&L of +2X has earned twice the risk incurred upon entry, which would represent a pre-trade risk:reward ratio of 2.
The way to go about it when you think in X’s and that you adopt the sound risk management policy to risk a fixed percentage of your account on each trade is to equate a currency value to a unit of X. E.g. your account is 10K USD and you decide you will risk a maximum of 1% of it on each trade. That means your unit of X for each trade is worth 100 USD. If your APPT is 2X, this means every time you risk 100 USD in a trade, you can expect to make, on average, 200 USD.
By presenting results this way, we hope that the Engine’s statistics will appeal to those cognisant of sound risk management strategies, while gently leading traders who aren’t, towards them.
We trade to turn in tangible profits of course, so at some point currency must come into play. Accordingly, some values such as equity, P&L, slippage and fees are expressed in currency.
Many of the usual numbers shown in TV backtests are nonetheless available, but they have been commented out in the Engine’s Plot module.
Position sizing and risk management
All good system designers understand that optimal risk management is at the very heart of all winning strategies. The risk in a trade is defined by the fraction of current equity represented by the amplitude of the stop, so in order to manage risk optimally on each trade, position size should adjust to the stop’s amplitude. Systems that enter trades with a fixed stop amplitude can get away with calculating position size as a fixed percentage of current equity. In the context of a test run where equity varies, what represents a fixed amount of risk translates into different currency values.
Dynamically adjusting position size throughout a system’s life is optimal in many ways. First, as position sizing will vary with current equity, it reproduces a behavioral pattern common to experienced traders, who will dial down risk when confronted to poor performance and increase it when performance improves. Second, limiting risk confers more predictability to statistical test results. Third, position sizing isn’t just about managing risk, it’s also about maximizing opportunity. By using the maximum leverage (no reference to trading on margin here) into the trade that your risk management strategy allows, a dynamic position size allows you to capture maximal opportunity.
To calculate position sizes using the fixed risk method, we use the following formula: Position = Account * MaxRisk% / Stop% [, which calculates a position size taking into account the trade’s entry stop so that if the trade is stopped out, 100 USD will be lost. For someone who manages risk this way, common instructions to invest a certain percentage of your account in a position are simply worthless, as they do not take into account the risk incurred in the trade.
The Engine lets you select either the fixed risk or fixed percentage of equity position sizing methods. The closest thing to dynamic position sizing that can currently be done with alerts is to use a bot that allows syntax to specify position size as a percentage of equity which, while being dynamic in the sense that it will adapt to current equity when the trade is entered, does not allow us to modulate position size using the stop’s amplitude. Changes to alerts are on the way which should solve this problem.
In order for you to simulate performance with the constraint of fixed position sizing, the Engine also offers a third, less preferable option, where position size is defined as a fixed percentage of initial capital so that it is constant throughout the test and will thus represent a varying proportion of current equity.
Let’s recap. The three position sizing methods the Engine offers are:
1. By specifying the maximum percentage of risk to incur on your remaining equity, so the Engine will dynamically adjust position size for each trade so that, combining the stop’s amplitude with position size will yield a fixed percentage of risk incurred on current equity,
2. By specifying a fixed percentage of remaining equity. Note that unless your system has a fixed stop at entry, this method will not provide maximal risk control, as risk will vary with the amplitude of the stop for every trade. This method, as the first, does however have the advantage of automatically adjusting position size to equity. It is the Engine’s default method because it has an equivalent in TV backtesting, so when flipping between indicator and strategy mode, test results will more or less correspond.
3. By specifying a fixed percentage of the Initial Capital. While this is the least preferable method, it nonetheless reflects the reality confronted by most system designers on TradingView today. In this case, risk varies both because the fixed position size in initial capital currency represents a varying percentage of remaining equity, and because the trade’s stop amplitude may vary, adding another variability vector to risk.
Note that the Engine cannot display equity results for strategies entering trades for a fixed amount of shares/contracts at a variable price.
SETTINGS/INPUTS
Because the initial text first published with a script cannot be edited later and because there are just too many options, the Engine’s Inputs will not be covered in minute detail, as they will most certainly evolve. We will go over them with broad strokes; you should be able to figure the rest out. If you have questions, just ask them here or in the PineCoders Telegram group.
Display
The display header’s checkbox does nothing.
For the moment, only one exit strategy uses a take profit level, so only that one will show information when checking “Show Take Profit Level”.
Entries
You can activate two simultaneous entry strats, each selected from the same set of strats contained in the Engine. If you select two and they fire simultaneously, the main strat’s signal will be used.
The random strat in each list uses a different seed, so you will get different results from each.
The “Filter transitions” and “Filter states” strats delegate signal generation to the selected filter(s). “Filter transitions” signals will only fire when the filter transitions into bull/bear state, so after a trade is stopped out, the next entry may take some time to trigger if the filter’s state does not change quickly. When you choose “Filter states”, then a new trade will be entered immediately after an exit in the direction the filter allows.
If you select “External Indicator”, your indicator will need to generate a +2/-2 (or a positive/negative stop value) to enter a long/short position, providing the selected filters allow for it. If you wish to use the Engine’s capacity to also derive the entry stop level from your indicator’s signal, then you must explicitly choose this option in the Entry Stops section.
Filters
You can activate as many filters as you wish; they are additive. The “Maximum stop allowed on entry” is an important component of proper risk management. If your system has an average 3% stop size and you need to trade using fixed position sizes because of alert/execution bot limitations, you must use this filter because if your system was to enter a trade with a 15% stop, that trade would incur 5 times the normal risk, and its result would account for an abnormally high proportion in your system’s performance.
Remember that any filter can also be used as an entry signal, either when it changes states, or whenever no trade is active and the filter is in a bull or bear mode.
Entry Stops
An entry stop must be selected in the Engine, as it requires a stop level before the in-trade stop is calculated. Until the selected in-trade stop strat generates a stop that comes closer to price than the entry stop (or respects another one of the in-trade stops kick in strats), the entry stop level is used.
It is here that you must select “External Indicator” if your indicator supplies a +price/-price value to be used as the entry stop. A +price is expected for a long entry and a -price value will enter a short with a stop at price. Note that the price is the absolute price, not an offset to the current price level.
In-Trade Stops
The Engine comes with many built-in in-trade stop strats. Note that some of them share the “Length” and “Multiple” field, so when you swap between them, be sure that the length and multiple in use correspond to what you want for that stop strat. Suggested defaults appear with the name of each strat in the dropdown.
In addition to the strat you wish to use, you must also determine when it kicks in to replace the initial entry’s stop, which is determined using different strats. For strats where you can define a positive or negative multiple of X, percentage or fixed value for a kick-in strat, a positive value is above the trade’s entry fill and a negative one below. A value of zero represents breakeven.
Pyramiding
What you specify in this section are the rules that allow pyramiding to happen. By themselves, these rules will not generate pyramiding entries. For those to happen, entry signals must be issued by one of the active entry strats, and conform to the pyramiding rules which act as a filter for them. The “Filter must allow entry” selection must be chosen if you want the usual system’s filters to act as additional filtering criteria for your pyramided entries.
Hard Exits
You can choose from a variety of hard exit strats. Hard exits are exit strategies which signal trade exits on specific events, as opposed to price breaching a stop level in In-Trade Stops strategies. They are self-explanatory. The last one labelled When Take Profit Level (multiple of X) is reached is the only one that uses a level, but contrary to stops, it is above price and while it is relative because it is expressed as a multiple of X, it does not move during the trade. This is the level called Take Profit that is show when the “Show Take Profit Level” checkbox is checked in the Display section.
While stops focus on managing risk, hard exit strategies try to put the emphasis on capturing opportunity.
Slippage
You can define it as a percentage or a fixed value, with different settings for entries and exits. The entry and exit markers on the chart show the impact of slippage on the entry price (the fill).
Fees
Fees, whether expressed as a percentage of position size in and out of the trade or as a fixed value per in and out, are in the same units of currency as the capital defined in the Position Sizing section. Fees being deducted from your Capital, they do not have an impact on the chart marker positions.
In-Trade Events
These events will only trigger during trades. They can be helpful to act as reminders for traders using the Engine as assistance to discretionary trading.
Post-Exit Analysis
It is normally on. Some of its results will show in the Global Numbers section of the Data Window. Only a few of the statistics generated are shown; many more are available, but commented out in the Plot module.
Date Range Filtering
Note that you don’t have to change the dates to enable/diable filtering. When you are done with a specific date range, just uncheck “Date Range Filtering” to disable date filtering.
Alert Triggers
Each selection corresponds to one condition. Conditions can be combined into a single alert as you please. Just be sure you have selected the ones you want to trigger the alert before you create the alert. For example, if you trade in both directions and you want a single alert to trigger on both types of exits, you must select both “Long Exit” and “Short Exit” before creating your alert.
Once the alert is triggered, these settings no longer have relevance as they have been saved with the alert.
When viewing charts where an alert has just triggered, if your alert triggers on more than one condition, you will need the appropriate markers active on your chart to figure out which condition triggered the alert, since plotting of markers is independent of alert management.
Position sizing
You have 3 options to determine position size:
1. Proportional to Stop -> Variable, with a cap on size.
2. Percentage of equity -> Variable.
3. Percentage of Initial Capital -> Fixed.
External Indicator
This is where you connect your indicator’s plot that will generate the signals the Engine will act upon. Remember this only works in Indicator mode.
DATA WINDOW INFORMATION
The top part of the window contains global numbers while the individual trade information appears in the bottom part. The different types of units used to express values are:
curr: denotes the currency used in the Position Sizing section of Inputs for the Initial Capital value.
quote: denotes quote currency, i.e. the value the instrument is expressed in, or the right side of the market pair (USD in EURUSD ).
X: the stop’s amplitude, itself expressed in quote currency, which we use to express a trade’s P&L, so that a trade with P&L=2X has made twice the stop’s amplitude in profit. This is sometimes referred to as R, since it represents one unit of risk. It is also the unit of measure used in the APPT, which denotes expected reward per unit of risk.
X%: is also the stop’s amplitude, but expressed as a percentage of the Entry Fill.
The numbers appearing in the Data Window are all prefixed:
“ALL:” the number is the average for all first entries and pyramided entries.
”1ST:” the number is for first entries only.
”PYR:” the number is for pyramided entries only.
”PEA:” the number is for Post-Exit Analyses
Global Numbers
Numbers in this section represent the results of all trades up to the cursor on the chart.
Average Profitability Per Trade (X): This value is the most important gauge of your strat’s worthiness. It represents the returns that can be expected from your strat for each unit of risk incurred. E.g.: your APPT is 2.0, thus for every unit of currency you invest in a trade, you can on average expect to obtain 2 after the trade. APPT is also referred to as “statistical expectancy”. If it is negative, your strategy is losing, even if your win rate is very good (it means your winning trades aren’t winning enough, or your losing trades lose too much, or both). Its counterpart in currency is also shown, as is the APPT/bar, which can be a useful gauge in deciding between rivalling systems.
Profit Factor: Gross of winning trades/Gross of losing trades. Strategy is profitable when >1. Not as useful as the APPT because it doesn’t take into account the win rate and the average win/loss per trade. It is calculated from the total winning/losing results of this particular backtest and has less predictive value than the APPT. A good profit factor together with a poor APPT means you just found a chart where your system outperformed. Relying too much on the profit factor is a bit like a poker player who would think going all in with two’s against aces is optimal because he just won a hand that way.
Win Rate: Percentage of winning trades out of all trades. Taken alone, it doesn’t have much to do with strategy profitability. You can have a win rate of 99% but if that one trade in 100 ruins you because of poor risk management, 99% doesn’t look so good anymore. This number speaks more of the system’s profile than its worthiness. Still, it can be useful to gauge if the system fits your personality. It can also be useful to traders intending to sell their systems, as low win rate systems are more difficult to sell and require more handholding of worried customers.
Equity (curr): This the sum of initial capital and the P&L of your system’s trades, including fees and slippage.
Return on Capital is the equivalent of TV’s Net Profit figure, i.e. the variation on your initial capital.
Maximum drawdown is the maximal drawdown from the highest equity point until the drop . There is also a close to close (meaning it doesn’t take into account in-trade variations) maximum drawdown value commented out in the code.
The next values are self-explanatory, until:
PYR: Avg Profitability Per Entry (X): this is the APPT for all pyramided entries.
PEA: Avg Max Opp . Available (X): the average maximal opportunity found in the Post-Exit Analyses.
PEA: Avg Drawdown to Max Opp . (X): this represents the maximum drawdown (incurred from the close at the beginning of the PEA analysis) required to reach the maximal opportunity point.
Trade Information
Numbers in this section concern only the current trade under the cursor. Most of them are self-explanatory. Use the description’s prefix to determine what the values applies to.
PYR: Avg Profitability Per Entry (X): While this value includes the impact of all current pyramided entries (and only those) and updates when you move your cursor around, P&L only reflects fees at the trade’s last bar.
PEA: Max Opp . Available (X): It’s the most profitable close reached post-trade, measured from the trade’s Exit Fill, expressed in the X value of the trade the PEA follows.
PEA: Drawdown to Max Opp . (X): This is the maximum drawdown from the trade’s Exit Fill that needs to be sustained in order to reach the maximum opportunity point, also expressed in X. Note that PEA numbers do not include slippage and fees.
EXTERNAL SIGNAL PROTOCOL
Only one external indicator can be connected to a script; in order to leverage its use to the fullest, the engine provides options to use it as either an entry signal, an entry/exit signal or a filter. When used as an entry signal, you can also use the signal to provide the entry’s stop. Here’s how this works:
For filter state: supply +1 for bull (long entries allowed), -1 for bear (short entries allowed).
For entry signals: supply +2 for long, -2 for short.
For exit signals: supply +3 for exit from long, -3 for exit from short.
To send an entry stop level with an entry signal: Send positive stop level for long entry (e.g. 103.33 to enter a long with a stop at 103.33), negative stop level for short entry (e.g. -103.33 to enter a short with a stop at 103.33). If you use this feature, your indicator will have to check for exact stop levels of 1.0, 2.0 or 3.0 and their negative counterparts, and fudge them with a tick in order to avoid confusion with other signals in the protocol.
Remember that mere generation of the values by your indicator will have no effect until you explicitly allow their use in the appropriate sections of the Engine’s Settings/Inputs.
An example of a script issuing a signal for the Engine is published by PineCoders.
RECOMMENDATIONS TO ASPIRING SYSTEM DESIGNERS
Stick to higher timeframes. On progressively lower timeframes, margins decrease and fees and slippage take a proportionally larger portion of profits, to the point where they can very easily turn a profitable strategy into a losing one. Additionally, your margin for error shrinks as the equilibrium of your system’s profitability becomes more fragile with the tight numbers involved in the shorter time frames. Avoid <1H time frames.
Know and calculate fees and slippage. To avoid market shock, backtest using conservative fees and slippage parameters. Systems rarely show unexpectedly good returns when they are confronted to the markets, so put all chances on your side by being outrageously conservative—or a the very least, realistic. Test results that do not include fees and slippage are worthless. Slippage is there for a reason, and that’s because our interventions in the market change the market. It is easier to find alpha in illiquid markets such as cryptos because not many large players participate in them. If your backtesting results are based on moving large positions and you don’t also add the inevitable slippage that will occur when you enter/exit thin markets, your backtesting will produce unrealistic results. Even if you do include large slippage in your settings, the Engine can only do so much as it will not let slippage push fills past the high or low of the entry bar, but the gap may be much larger in illiquid markets.
Never test and optimize your system on the same dataset , as that is the perfect recipe for overfitting or data dredging, which is trying to find one precise set of rules/parameters that works only on one dataset. These setups are the most fragile and often get destroyed when they meet the real world.
Try to find datasets yielding more than 100 trades. Less than that and results are not as reliable.
Consider all backtesting results with suspicion. If you never entertained sceptic tendencies, now is the time to begin. If your backtest results look really good, assume they are flawed, either because of your methodology, the data you’re using or the software doing the testing. Always assume the worse and learn proper backtesting techniques such as monte carlo simulations and walk forward analysis to avoid the traps and biases that unchecked greed will set for you. If you are not familiar with concepts such as survivor bias, lookahead bias and confirmation bias, learn about them.
Stick to simple bars or candles when designing systems. Other types of bars often do not yield reliable results, whether by design (Heikin Ashi) or because of the way they are implemented on TV (Renko bars).
Know that you don’t know and use that knowledge to learn more about systems and how to properly test them, about your biases, and about yourself.
Manage risk first , then capture opportunity.
Respect the inherent uncertainty of the future. Cleanse yourself of the sad arrogance and unchecked greed common to newcomers to trading. Strive for rationality. Respect the fact that while backtest results may look promising, there is no guarantee they will repeat in the future (there is actually a high probability they won’t!), because the future is fundamentally unknowable. If you develop a system that looks promising, don’t oversell it to others whose greed may lead them to entertain unreasonable expectations.
Have a plan. Understand what king of trading system you are trying to build. Have a clear picture or where entries, exits and other important levels will be in the sort of trade you are trying to create with your system. This stated direction will help you discard more efficiently many of the inevitably useless ideas that will pop up during system design.
Be wary of complexity. Experienced systems engineers understand how rapidly complexity builds when you assemble components together—however simple each one may be. The more complex your system, the more difficult it will be to manage.
Play! . Allow yourself time to play around when you design your systems. While much comes about from working with a purpose, great ideas sometimes come out of just trying things with no set goal, when you are stuck and don’t know how to move ahead. Have fun!
@LucF
NOTES
While the engine’s code can supply multiple consecutive entries of longs or shorts in order to scale positions (pyramid), all exits currently assume the execution bot will exit the totality of the position. No partial exits are currently possible with the Engine.
Because the Engine is literally crippled by the limitations on the number of plots a script can output on TV; it can only show a fraction of all the information it calculates in the Data Window. You will find in the Plot Module vast amounts of commented out lines that you can activate if you also disable an equivalent number of other plots. This may be useful to explore certain characteristics of your system in more detail.
When backtesting using the TV backtesting feature, you will need to provide the strategy parameters you wish to use through either Settings/Properties or by changing the default values in the code’s header. These values are defined in variables and used not only in the strategy() statement, but also as defaults in the Engine’s relevant Inputs.
If you want to test using pyramiding, then both the strategy’s Setting/Properties and the Engine’s Settings/Inputs need to allow pyramiding.
If you find any bugs in the Engine, please let us know.
THANKS
To @glaz for allowing the use of his unpublished MA Squize in the filters.
To @everget for his Chandelier stop code, which is also used as a filter in the Engine.
To @RicardoSantos for his pseudo-random generator, and because it’s from him that I first read in the Pine chat about the idea of using an external indicator as input into another. In the PineCoders group, @theheirophant then mentioned the idea of using it as a buy/sell signal and @simpelyfe showed a piece of code implementing the idea. That’s the tortuous story behind the use of the external indicator in the Engine.
To @admin for the Volatility stop’s original code and for the donchian function lifted from Ichimoku .
To @BobHoward21 for the v3 version of Volatility Stop .
To @scarf and @midtownsk8rguy for the color tuning.
To many other scripters who provided encouragement and suggestions for improvement during the long process of writing and testing this piece of code.
To J. Welles Wilder Jr. for ATR, used extensively throughout the Engine.
To TradingView for graciously making an account available to PineCoders.
And finally, to all fellow PineCoders for the constant intellectual stimulation; it is a privilege to share ideas with you all. The Engine is for all TradingView PineCoders, of course—but especially for you.
Look first. Then leap.

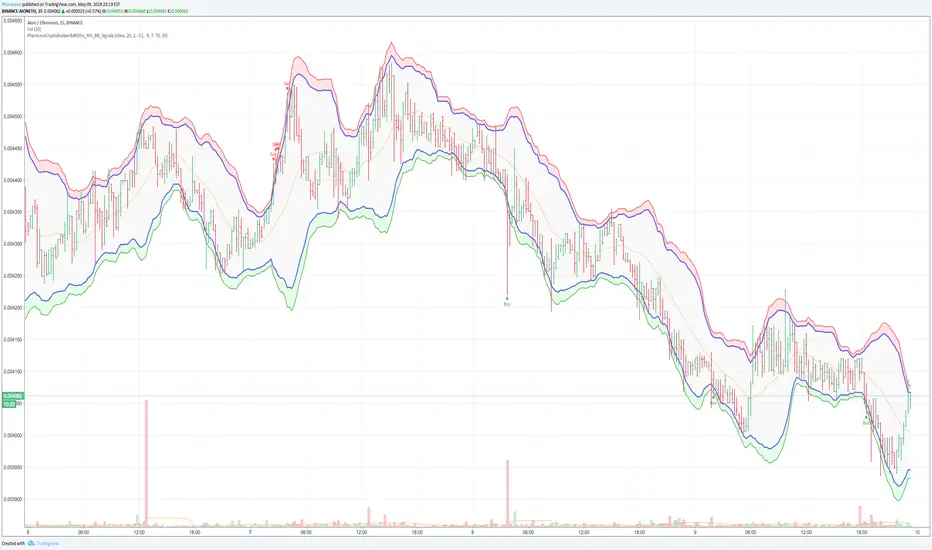
Pharoceus CryptoScalper's RSI+BB Signal+AlertsDescription
This is an indicator with alerts/signals and it's designed for Cryptocurrency leverage trading (scalping). This indicator features, the most popularly used indicators in technical analysis and that is the Bollinger Bands and Relative Strenght Index (RSI). The CryptoScalper's RSI+BB Signal+Alerts was designed for use with ProfitTrailer V2 and can also be used with all other trading bots that allows alerts or on its own as a powerful market leverage trading indicator using alerts because it offers buy alerts as well.
The Pharoceus CryptoScalper's RSI+BB Signal+Alerts can be customized to any trader specific patterns and settings, making it so easy to use. With the Buy and Sell Signal feature, trading on any cryptocurrency exchange can be automated likewise with any crypto trading bot as stated previously; but I'll always recommend using it for buys only if you're using it with a bot. This indicator/script can be used with any base pair; BTC, ETH, and USD or USDT as well. This is also not affiliated with any bot or exchange and it's not advertising either ProfitTrailer or any bot or exchanges.
This is a free indicator for anyone to use, for access and support, also strategy, results and settings discussion, join the discord channel (link below) and come build a real community. If you want to support my work and more free signals, donations are highly encouraged.
I am not a financial adviser and all gains or losses are at the discretion of all users and I would not be held liable for any of the other. This effort is solely of an individual who believes Signals shouldn't have to cost traders an arm or a leg or taken as an opportunity to rip people off.
Also, I know a lot of people are asking for access to the ProfitTrailerV2 RSI+BB+SRSI+Stochastic Oscillator Signal+Alerts and have not gotten it. The reason was because beta-testers brought issues as regarding the buy signals and I'm revisiting that indicator and working on the issue. Should have made this known but TV doesn't allow edits after 15mins or I would make it known via comments soon.
discord.gg
BTC: 199qMzu4gvr3bUXWEpLG5uS6TEKKvw5pbe
ETH: 0xf8339952a224a228f2f8c58a5666a8ffleddebfb
BCH: qqmmds8u3f8m6ek387jtefg07525dvaxzqrshd86gz
BOLLedOverIntroduction
BOLLedOver leverages classic signal strategies typically seen in equity program trading algos. Interestingly, in the crypto world, these statistical methods don’t mean quite as much as crypto is generally random and spastic. (I find some of the online analysis humorous—“setting bottom when we cross the 50 day moving average”—really? Trend following is measured in minutes, hours or days, not weeks or months. BOLLedOver uses the Bollinger Band method with various filters to insure good buying and selling opportunities. These scripts use the same framework with different signaling strategies as I have found this a very useful way to “test and learn”. The framework allows configuration for “interesting” parameters to their underlying statistical functions. Trade execution strategies are equally as important than getting the right signals in place. In the live BOT version, the framework allows for MARKET orders only, and “chasing the book” which insures that you can place LIMIT orders attempting to be a “market maker” not “taker”. In addition, the framework takes a trailing STOP approach which eliminates a lot of risk on the down side.
FOR BOT RENTERS ONLY: With so much trading, fees and slippage can really make a difference. Some exchanges provide free trades (GDAX) if you make markets with your trading. This applies to both the BUY and SELL sides and proves very useful. A big mistake with newbies in this area is not considering cost (and slippage). The framework has yielded approximately 70-80% free trades (mileage varies based on statistical settings) with exchanges that have the market maker policy. Always, be conservative in back-testing the strategies with fee settings—this can quickly destroy profits. I have tested extensively on Binance, Bitfinex and GDAX and leave it to you to backtest your favorite exchange—BOLLedOver trades a lot with some settings, so if your exchange isn’t quite as reliable or has holes in the data the BOT may not perform as advertised.
Key Features
• Designed for market maker trading
• Leverages classic statistical models in a unique crypto way
• Trades when market is sideways or heading up, sleeps when heading down
• Two to three trades daily (depending on settings and market action)
• Tune-able with ample knobs and levers.
Parameters
Stop Loss % (default 97%) STOPs will be placed and ratchet up following stops with each 1% increase in price action.
Stop Loss Trail % (default 96%) Second STOP starts here.
Bollinger Bands Time Period (default 6) indicates 6 candles in calculation. BOLLedOver runs best at 15 minutes periods. Try your own setting with plenty of backtesting.
Average Volume (default 18) filters buy and sell signals
Buy ROC Length (default 75) number of candles averaged for positive rate of change , which gives the go ahead to act on a BUY signal. When markets are heading south the BOT goes to sleep. You might get a STOP LOSS haircut (default 3%, 2 to 1 chance if you are in a position), but no trade chattering in whipsaw downward spirals after that.
Sell ROC Length (default 85) number of candles averaged for a negative rate of change , which gives the go ahead to act on a SELL signal. Note: the tighter the Bollinger Bands (e.g. 5) the less likely a SELL will process before a STOP LOSS is reached making this parameter useless in those cases.
MACD – the moving average convergence/divergence is used to check the validity of BUY and SELL signals
MACD Fast Period (default 13)
MACD Slow Period (default 24)
MACD Signal Smoothing (default 8)
Candles to Wait After Trade (default 4) set to 0 to turn off. Keeps trades from occurring consecutively in pump and dump environment.
This script logic is available on cryptotrader.org as a rentable BOT. You will need API keys for automated trading.

BOLLedOverIntroduction
BOLLedOver leverages classic signal strategies typically seen in equity program trading algos. Interestingly, in the crypto world, these statistical methods don’t mean quite as much as crypto is generally random and spastic. (I find some of the online analysis humorous—“setting bottom when we cross the 50 day moving average”—really? Trend following is measured in minutes, hours or days, not weeks or months. BOLLedOver uses the Bollinger Band method with various filters to insure good buying and selling opportunities. All my scripts use the same framework with different signaling strategies as I have found this a very useful way to “test and learn”. The framework allows configuration for “interesting” parameters to their underlying statistical functions. In addition, I have found that trade execution strategies are far more important than getting the right signals in place. In the live BOT version, my framework allows for MARKET orders only, and “chasing the book” which insures that you can place LIMIT orders attempting to be a “market maker” not “taker”. In addition, the framework takes a trailing STOP approach which eliminates a lot of risk on the down side.
With so much trading, fees and slippage can really make a difference. Some exchanges provide free trades (GDAX) if you make markets with your trading. This applies to both the BUY and SELL sides and proves very useful. A big mistake with newbies in this area is not considering cost (and slippage). My BOTs have yielded approximately 70-80% free trades (mileage varies based on statistical settings) with exchanges that have the market maker policy. Always, be conservative in back-testing the strategies with fee settings—this can quickly destroy profits.
I have tested extensively on Binance, Bitfinex and GDAX and leave it to you to backtest your favorite exchange—BOLLedOver trades a lot with some settings, so if your exchange isn’t quite as reliable or has holes in the data the BOT may not perform as advertised.
Key Features
• Designed for market maker trading
• Leverages classic statistical models in a unique crypto way
• Trades when market is sideways or heading up, sleeps when heading down
• Two to three trades daily (depending on settings and market action)
• Tune-able with ample knobs and levers.
Parameters
Stop Loss % (default 98%) STOPs will be placed and ratchet up following stops with each 1% increase in price action.
Stop Loss Trail % (default 96%) Second STOP starts here.
Bollinger Bands Time Period (default 6) indicates 6 candles in calculation. BOLLedOver runs best at 15 minutes periods. Try your own setting with plenty of backtesting.
Average Volume (default 18) filters buy and sell signals
Buy ROC Length (default 75) number of candles averaged for positive rate of change, which gives the go ahead to act on a BUY signal. When markets are heading south the BOT goes to sleep. You might get a STOP LOSS haircut (default 3%, 2 to 1 chance if you are in a position), but no trade chattering in whipsaw downward spirals after that.
Sell ROC Length (default 85) number of candles averaged for a negative rate of change, which gives the go ahead to act on a SELL signal. Note: the tighter the Bollinger Bands (e.g. 5) the less likely a SELL will process before a STOP LOSS is reached making this parameter useless in those cases.
MACD – the moving average convergence/divergence is used to check the validity of BUY and SELL signals
MACD Fast Period (default 10)
MACD Slow Period (default 24)
MACD Signal Smoothing (default 10)
Candles to Wait After Trade (default 10) set to 0 to turn off. Keeps trades from occurring consecutively in pump and dump environment.

Speed Coding BTC Pro SystemSpeed Coding BTC Pro System is an advanced TradingView automation strategy designed for Bitcoin trading.
It sends Buy/Sell signals automatically from TradingView to your exchange or trading bot using Webhook API integration.
To activate automation, the client only needs to fill in the following 4 inputs:
⸻
1) Apikey
The Apikey is your unique security key used to authorize and connect the strategy with your automation system or trading bot.
✅ What to enter:
• Paste the API Key provided by your trading bridge / bot / automation panel.
⚠️ Important:
• Do not share your API key with anyone.
• Incorrect API key will stop order execution.
⸻
2) Symbol
The Symbol defines which trading pair or instrument the automation will trade.
✅ Examples (depends on exchange format):
• BTCUSDT
• BTCUSD
• BTCUSDT.P
• XBTUSD
📌 Note:
Always enter the exact symbol name supported by your exchange or automation bridge.
⸻
3) Strategy Tag
The Strategy Tag is a label used to identify this strategy’s signals inside your automation system.
It helps manage multiple strategies or multiple client accounts easily.
✅ Recommended Tags:
• SC_BTC_PRO
• SPEED_BTC_SYSTEM
• SCALP_BTC_PRO
• SPEEDCODING_BTC
📌 Best Practice:
Keep the same tag for one client to maintain clean tracking.
⸻
4) Qty
The Qty defines the order size or trade quantity.
✅ Example:
• 0.01 BTC (as shown in your settings)
⚠️ Note:
Quantity depends on account balance and exchange minimum order rules.
✅ How Automation Works
1. The strategy generates a Buy/Sell or Long/Short signal on TradingView
2. TradingView sends the signal through Webhook Alert
3. Your connected bot/bridge receives the message
4. Orders are placed automatically on the exchange
⸻
✅ Client Safety Recommendations
• Always test in Demo/Paper Trading first
• Confirm correct Symbol and Qty before live trading
• Run one test alert to verify webhook connection

RSI Scalp Reversion (Buy/Sell Signal)RSI Scalp Reversion (Buy/Sell Signal) - with optional “trend filters”
Buy/Sell signals + optional alert-friendly events for automation via TradingView webhooks.
What it is
RSI Scalping Framework is a mean-reversion scalping framework built around RSI extremes “rubber band” moves. It is not a single magic preset; it’s a testing template that lets traders run the same core RSI idea while selectively adding confirmations to reduce random entries.
Core concept (signal engine)
Markets often stretch short-term and snap back. The script hunts those stretches using RSI:
- Long bias: RSI reaches a user-defined Oversold zone
- Short bias: RSI reaches a user-defined Overbought zone
Traders can choose whether the entry trigger is:
- In-zone (RSI is beyond the level)
- Cross-based (RSI crosses back from the extreme)
Why it’s different / originality
This script is published as a single modular framework rather than many minor variants. The intent is to let traders:
- Toggle filters on/off to see what actually improves results for a symbol/timeframe
- Keep risk logic consistent so comparisons are honest
- Use the same strategy shell while iterating settings
It includes a structured “reality-check” system (trend/momentum/volatility gates) and multiple exit modes so users can compare combinations without swapping scripts.
Filters (“quality knobs”)
Raw RSI can be noisy, especially during trends or low-volatility conditions. This framework lets you layer optional confirmations:
- RSI Smoothing Filter (default ON)
A smoothed RSI (e.g., RSI moving average) is used as a noise-reduction gate so trades prefer cleaner mean-reversion conditions rather than every touch of an extreme.
- ADX Filter (default ON)
A trend-strength gate used to avoid unfavorable regimes (e.g., very strong directional conditions for mean-reversion scalps). Threshold is configurable.
- ATR Volatility Filter (default ON)
A volatility gate to avoid “dead” conditions where scalps often fail due to insufficient movement. Threshold is configurable (ATR relative to price).
- EMA Trend Filter (optional)
Direction filter for users who prefer to align with a higher-level bias (e.g., only take longs above EMA / shorts below EMA).
- MACD Momentum Filter (optional)
Momentum confirmation for users who want RSI signals supported by directional momentum (MACD relationship configurable).
Exits / risk controls
Scalping needs strict, repeatable exits. The script provides:
- Fixed % Stop-Loss (per position)
- Fixed % Take-Profit (per position)
- Optional RSI-based “cool-off” exit (exit when RSI normalizes toward a user-defined level rather than relying only on price)
Buy/Sell signals
Signals & alerts
The script generates clear Buy (Long) and Sell (Short) signals based on the RSI mean-reversion engine (with any enabled filters applied). These signals can be used visually on-chart and as the basis for TradingView alerts.
Webhook automation
Automation / webhooks
This script is compatible with TradingView Alerts and can be used with webhook-based bots/bridges for automation (e.g., sending alert payloads to a third-party execution system). Users can configure alerts for:
- Buy/Long signal
- Sell/Short signal
- Optional exit events (fixed SL/TP behavior is handled by the strategy logic; RSI-based “cool-off” exits can also be alerted if enabled)
Note: Trade execution depends on your external bot/broker integration. Always forward test and validate alert payloads before using live.
How to use
1 - Add the script to your chart and confirm Buy/Sell signals match your intended RSI levels.
2 - Start with the core RSI engine + fixed SL/TP, then enable one filter at a time to evaluate improvements.
3 - Create TradingView alerts from the script’s Buy/Sell conditions.
4 - If you automate: connect alerts via webhook to your bot/bridge and forward test thoroughly (slippage, fees, and execution latency matter).
Best suited for
- Ranging / choppy markets
- Traders who want a structured way to test RSI mean-reversion with optional confirmations
- Traders who want one script that consolidates variations via toggles rather than multiple separate indicators
Notes
- This is an educational/research tool. Past performance does not predict future results.
- Settings are symbol/timeframe dependent.

XAUUSD Gold 5-Min Scalping Indicator⚡ XAUUSD 5-Min Scalping Strategy — Moving Average + Engulfing Confirmation
This professionally coded TradingView strategy is built for Gold scalpers who want clean, rule-based entries without repainting. It combines a triple moving average trend filter, engulfing confirmation logic, and RSI divergence exits to create a structured, repeatable system for XAUUSD on 5-minute charts.
🔗 Source & Inspiration
This system is inspired by the educational breakdown by "The Moving Average".
All conceptual credit belongs to the original creator.
Video reference:
youtu.be
This listing provides a fully enhanced and expanded version of that concept, coded into a complete TradingView indicator/strategy with TP/SL modules, alerts, divergence exits, multi-style risk management, and full Pine Script source code.
This listing provides two complete TradingView scripts:
✅ Version 1 — Indicator (Signals + Alerts Only)
Buy/Sell signals based on trend + engulfing confirmation
No TP/SL engine
Includes full alert functionality
Perfect for automation with trading bots (3Commas, PineConnector, Tickerly)
Ideal if you want to plug signal-only logic directly into a bot or copy-trading workflow
✅ Version 2 — Strategy (Backtest + TP/SL Engine)
Full strategy framework with ready-made Take Profit & Stop Loss modules
Includes break-even, trailing stops, ATR exits, RSI divergence exits
Plots entry, TP, SL lines on chart
Provides detailed backtesting, optimization, and forward-testing
Best for refined strategy development and statistical testing
📌 Both versions are included with your purchase to give complete flexibility—
signal-only automation + full TP/SL backtesting.
💡 How It Works
The system uses a multi-layer confirmation approach. First, trend direction is determined using the 21/50/200 moving averages with a built-in minimum spread filter to avoid choppy markets. Then, it detects a 3-line strike pattern followed by a strong engulfing candle that covers a configurable percentage of the previous range. Only when all trend and price-action rules align does the system generate a Buy or Sell signal. Optional RSI divergence logic can be used to exit early when reversal pressure forms.
🟢 Long Setup
Uptrend confirmed by MA 21 > MA 50 > MA 200
MA spread above threshold to avoid sideways noise
Three consecutive bearish candles
A bullish engulfing candle covering a user-defined percentage
→ System triggers a Buy signal on bar close
🔴 Short Setup
Downtrend confirmed by MA 21 < MA 50 < MA 200
MA spread above threshold to ensure clear trend
Three consecutive bullish candles
A bearish engulfing candle covering a user-defined percentage
→ System triggers a Sell signal on bar close
🔥 Why Traders Love This Dual-Version System
✔️ Version 1 (Indicator):
Clean BUY/SELL signals
Zero repaint
Alerts for bots & automation
Plug-and-play for 3Commas, PineConnector, Tickerly, etc.
✔️ Version 2 (Strategy):
Built-in TP/SL engine
Trailing stop, ATR exits, break-even logic
Full visual TP/SL lines on chart
Perfect for real backtesting & optimization
✔️ Both Versions:
Engulfing + 3-line strike pattern detection
Trend filter with spread validation
RSI divergence detection (optional)
Non-repainting
Full source code included
Works on XAUUSD, Forex, Crypto, Indices, Metals
This tool gives structure, clarity, and scalable automation potential to your scalping workflow.
🧩 What Makes This Different
This isn’t a basic Moving Average crossover script. It blends price action (engulfing + 3-line strike) with a multi-MA trend filter, divergence detection, and a full risk-management engine. Everything is non-repainting, fully customizable, and forward-confirmed. It’s engineered for traders who prefer precision and clean logic, not flashy signals.
⚙️ Key Features
✔️ MA-Based Trend Filter with Spread Validation
✔️ Engulfing + 3-Line Strike Pattern Detection
✔️ RSI Divergence Engine (Regular + Hidden)
✔️ Multi-Mode TP/SL: Fixed, Trailing, Candle-Based, ATR, Break-Even
✔️ Full Visual Lines with TP/SL Fills on Chart
✔️ Triangle Entry Signals (BUY/SELL)
✔️ Time Range Filter for Backtesting
✔️ Alerts for automation (3Commas, PineConnector, Tickerly)
✔️ Source Code Included — No locks, no obfuscation
🎯 Perfect For
✅ Gold scalpers (5m timeframe)
✅ Trend + price action traders
✅ Traders who like engulfing continuation setups
✅ Algorithmic traders using TradingView alerts
✅ Anyone wanting a structured, rules-based approach
Works on Forex, Crypto, Indices, and Commodities with minor adjustments and testing.
💼 What You Receive
📁 Version 1 — Indicator (Signals + Alerts)
📁 Version 2 — Strategy (Backtesting + TP/SL)
📁 Full Pine Script Source Code (.txt)
♾ Lifetime access + updates
🛠 Compatibility
✔ TradingView (all plans)
✔ All markets and timeframes
✔ Automation platforms: PineConnector, 3Commas, Tickerly
✔ Optimized for XAUUSD 5 minute scalping
✔ 100% non-repaint logic
⚠️ Disclaimer
This tool is for educational and research purposes. Trading involves risk; always test thoroughly and use appropriate risk management.

EDUVEST UTBOT ADJ - Adaptive ATR Trailing StopEDUVEST UTBOT ADJ - Adaptive ATR Trailing Stop with Session-Based Sensitivity
━━━━━━━━━━━━━━━━━━━━━━━━━━━━━━━━━━━━━━━━━━━━━━━━
█ ORIGINALITY
This indicator is an enhanced version of the classic UT Bot concept, featuring automatic session-based ATR sensitivity adjustment. Unlike the original UT Bot which uses a fixed sensitivity value, this version dynamically adapts to different trading sessions (Tokyo, London, New York) and automatically detects asset characteristics to optimize signal generation.
━━━━━━━━━━━━━━━━━━━━━━━━━━━━━━━━━━━━━━━━━━━━━━━━
█ WHAT IT DOES
- Generates BUY and SELL signals based on ATR trailing stop crossovers with a moving average
- Automatically adjusts sensitivity based on current trading session (Tokyo/London/NY)
- Auto-detects asset type and applies optimized parameters for each instrument
- Displays real-time session information and volatility status
- Provides alert functionality with customizable cooldown periods
━━━━━━━━━━━━━━━━━━━━━━━━━━━━━━━━━━━━━━━━━━━━━━━━
█ HOW IT WORKS
【Core Logic: ATR Trailing Stop】
The indicator calculates an ATR-based trailing stop using the formula:
Trailing Stop = Price ± (Sensitivity × ATR)
When price is above the trailing stop and rising, the stop trails below price.
When price is below the trailing stop and falling, the stop trails above price.
【Signal Generation】
- BUY Signal: Price crosses above the trailing stop AND Moving Average crosses above the trailing stop
- SELL Signal: Price crosses below the trailing stop AND Moving Average crosses below the trailing stop
【Session-Based Sensitivity Adjustment】
The indicator adjusts ATR sensitivity based on trading session (JST timezone):
- Tokyo (08:00-15:00): Lower sensitivity (reduced by adjustment value) - typically quieter markets
- London (15:00-23:00): Base sensitivity - moderate volatility
- New York (23:00-08:00): Higher sensitivity (increased by adjustment value) - higher volatility
【Dynamic ATR Adjustment】
When enabled, the indicator compares current ATR to its smoothed average:
- ATR Ratio = Current ATR / SMA(ATR, smoothing period)
- Volatility Multiplier = 1.0 + (Sensitivity × (2.0 - ATR Ratio))
This reduces sensitivity during high volatility (fewer false signals) and increases sensitivity during low volatility (faster response).
【Auto Asset Detection】
The indicator automatically detects the traded instrument and applies optimized parameters:
- Stable pairs (USDJPY, EURUSD, USDCHF): Base sensitivity 1.5-1.8
- Moderate pairs (AUDUSD, USDCAD, EURJPY): Base sensitivity 2.0-2.3
- Volatile pairs (GBPUSD): Base sensitivity 2.8
- Commodities (GOLD/XAUUSD): Base sensitivity 3.5
- Indices (NASDAQ/NAS100): Base sensitivity 4.0
━━━━━━━━━━━━━━━━━━━━━━━━━━━━━━━━━━━━━━━━━━━━━━━━
█ HOW TO USE
【Recommended Settings】
- Timeframe: 15 minutes or higher (15M, 1H, 4H recommended)
- Best performance on: Forex majors, Gold, NASDAQ
- Enable "Auto Asset Detection" for optimized parameters
【Entry Rules】
- BUY: Enter long when green BUY label appears
- SELL: Enter short when pink SELL label appears
【Session Panel】
The top-right panel displays:
- Current trading session (Tokyo/London/NY)
- Volatility status (High Chance/Medium Chance/Caution)
- Mode (AUTO/MANUAL)
【Alert Setup】
1. Enable "Viewer Alert Display" in settings
2. Set cooldown period (default: 15 minutes) to avoid signal spam
3. Create alert with "Any alert() function call" condition
【Important Notes】
- This indicator does not repaint - signals are confirmed at bar close
- Lower timeframes (1M, 5M) may generate excessive signals
- Always use proper risk management and confirm with other analysis
━━━━━━━━━━━━━━━━━━━━━━━━━━━━━━━━━━━━━━━━━━━━━━━━
█ SETTINGS OVERVIEW
🎯 Alert Settings
- Viewer Alert Display: Enable/disable alert labels
- Cooldown Function: Prevent rapid consecutive signals
- Cooldown Time: Minutes between alerts (5-60)
🔧 Dynamic ATR Settings
- Enable Dynamic ATR: Auto-adjust based on volatility
- ATR Period: Calculation period (default: 14)
- ATR Smoothing: Smoothing period for ratio calculation
- Volatility Sensitivity: How much to adjust (0.1-1.0)
🕐 Session ATR Adjustment
- Enable Time Adjustment: Session-based sensitivity
- Show Session Info: Display session panel
📊 Asset Settings
- Auto Asset Detection: Automatically optimize for instrument
- Manual settings available when auto-detection is disabled
━━━━━━━━━━━━━━━━━━━━━━━━━━━━━━━━━━━━━━━━━━━━━━━━
█ CREDITS
Based on the original UT Bot concept by QuantNomad.
Enhanced with session-based adaptation and auto-asset detection by EduVest.
License: Mozilla Public License 2.0

TradingIndicator Academy TIA - Pro Scalping System
Beschrijving:
Deze indicator is een geavanceerde scalping tool, specifiek ontwikkeld voor geautomatiseerde Bybit futures trading. De strategie is ontworpen om snelle prijs-reversals ("wicks") te vangen die buiten de standaard deviatie van de VWMA (Volume Weighted Moving Average) vallen.
Het script combineert visuele analyse met volledige webhook-automatisering, waardoor handmatige fouten worden geëlimineerd en trades direct via JSON-commando's worden uitgevoerd.
🚀 Belangrijkste Kenmerken:
⚡ Wick Entry Strategie: Signalen worden gegenereerd wanneer de prijs (High/Low) agressief door de VWMA bands breekt. Dit duidt vaak op liquidaties of overreacties van de markt, gevolgd door een snelle correctie.
🤖 Volledige Automatisering: Ingebouwde, kant-en-klare JSON-alerts voor trading bots. Het script genereert automatisch payloads met side, size, leverage, en unieke UUIDs voor foutloze executie.
👁️ Smart Visuals:
Dynamische TP/SL Boxen: Zodra een positie opent, toont de chart direct de Take Profit (groen) en Stop Loss (rood) zones. Deze boxen updaten real-time mee met de candle, zodat je altijd ziet waar je staat.
Live Dashboard: Een tabel rechtsboven toont de actuele status van de bot, entry prijs, en targets.
🛡️ Risk Management: Ingebouwde (instelbare) logic voor Stoploss (standaard 2.5%) en Takeprofit (0.75%), visueel weergegeven om direct je Risk/Reward te beoordelen.
🛠️ Hoe te gebruiken:
Voeg de indicator toe aan een 1m of 5m chart (bijv. crypto perpetuals).
Vul in de instellingen je Bot / Alert UUIDs in (voor correcte order tracking).
Maak een TradingView Alert aan:
Condition: TIA - Pro Scalping System
Trigger: Any alert() function call
Webhook: De URL van je trading bot of webhook provider.
Zet Min Liq Size op 0 voor alle signalen, of hoger om alleen trades met hoog volume te pakken.
⚠️ Disclaimer:
Trading met leverage brengt risico's met zich mee. Deze tool is bedoeld ter ondersteuning van een geautomatiseerde strategie. Test resultaten altijd eerst met minimale size of in een demo-omgeving.

Master Analytics Dashboard Pro V6Works in any market including Crypto and Stocks
1. Navigating the Settings (Inputs)
Click the "Gear" icon next to the indicator name on your chart to open the settings. You will see several sections with (i) icons—hover over these for helpful tips.
Dashboard Aesthetics: Use this to move the dashboard (e.g., to "Bottom Left") or change the background transparency.
Dashboard Data Toggles: What to display on dashboard.
Technical Settings: This is where you adjust the UT Bot Key and RSI lengths/MACD. For beginners, the default settings are usually best.
SMA/EMA and VWAP Lines: Can add up to 5 SMA and 3 EMA lines and fully customizable. By default SMA 610 ( for lowest bottom) and classical EMA 9, 20, 200 and VWAP will display.
MTF Timeframes: You can choose which timeframes the dashboard monitors. By default, it tracks from 5m up to 1D to show you the "Big Picture" trend.
2. Understanding the Dashboard & Ribbon
The dashboard acts as your "Control Center," aggregating data so you don't have to switch charts.
Trend Ribbon (Cloud): When the cloud is Green, the immediate trend is bullish. When it is Red, the trend is bearish.
Ribbon Trend (MTF): This row shows if the ribbon is bullish or bearish across other timeframes.
Confluence %: This is your most important number. A score of 80% or higher means almost all indicators (MACD, RSI, Trends) are aligned in one direction.
3. Setting Up Individual Alerts
One of the most powerful features of this script is the ability to trigger alerts individually.
Select Your Triggers: In the indicator settings under "7. Alert Thresholds," check only the boxes you want (e.g., Bullish Ribbon Flip). By default, all other alerts are unchecked to prevent spam.
Create the Alert: Click the "Alert" icon (Alarm Clock) on the TradingView sidebar.
Condition: Select "Analytics" and then select "Any alert() function call".
Frequency: Choose "Once Per Bar Close" to ensure the signal is confirmed before you get a notification.
How to Trade:
🟢 The Bullish "Perfect Trade" Checklist
To confirm a high-probability Long entry, aim for as many of these "Green" signals as possible:
Trend Ribbon Flip: The primary ribbon cloud on your chart has turned Green, and price is trading above it.
Confluence Score ≥ 80%: The dashboard shows a bullish confluence of 80% or higher, indicating that RSI, MACD, and Trends are aligned.
MTF Alignment: At least 4 out of the 5 timeframes (e.g., 15m, 1h, 4h, 1D) show a BULL status.
Trend Status: The "Trend Source" row (EMA 200 or SMA 200) reads BULLISH, confirming the long-term trend is in your favor.
UT Bot Confirmation: A tiny BUY label has appeared on the chart (confirmed on bar close).
RSI Momentum: The RSI is above its Moving Average (TRUE) but has not yet crossed the Overbought (80) threshold. Look out for Yellow caution to indicate RSI is OB/OS (Above the candle is OB, below the candle is OS.
🔴 The Bearish "Perfect Trade" Checklist
To confirm a high-probability Short entry, look for these "Red" signals:
Trend Ribbon Flip: The ribbon cloud has turned Red, and price is trading below the basis line.
Confluence Score ≤ 20% (80% Bearish): The aggregate signal shows strong bearish pressure.
MTF Alignment: The higher timeframes (TF 4 and TF 5) specifically show a BEAR status, ensuring you aren't "fighting the trend".
Trend Status: Price is trading below the 200 EMA/SMA, showing the dashboard Trend Status as BEARISH.
UT Bot Confirmation: A tiny SELL label has appeared on the chart.
MACD State: The MACD Fast line is below the Signal line (FALSE on the "MACD > Sig" row).

Quantum Ribbon Pro📊 WHAT IS QUANTUM RIBBON PRO?
Quantum Ribbon Pro is a trend trading system built on a 5-layer adaptive EMA ribbon with multi-timeframe confirmation, advanced risk management, and custom alert automation.
It's designed for traders who want clear entries, precise risk control, and the flexibility to automate their trading — all from one indicator.
If you've used Quantum Ribbon Lite, this is the full system with HTF filtering, partial take profits, break-even automation, session control, and webhook-ready alerts.
🚀 PRO FEATURES
Multi-Timeframe Confirmation
Filter your signals using a secondary timeframe for trend alignment. Choose any timeframe from 15m to Weekly. Option to display the MTF ribbon directly on your chart.
Partial Take Profits
Scale out of positions like a professional. Set TP1, TP2, and final target levels with customizable percentages. The indicator tracks your remaining position size in real-time.
Break-Even Protection
Automatically move your stop loss to entry price after hitting TP1 or TP2. Lock in gains and let winners run with zero risk.
Session Filter
Trade only during your preferred market hours. Fully customizable start and end times. Avoid choppy overnight sessions or news events.
Custom Alert Templates
Four built-in alert formats including JSON for webhook and bot integrations. Or build your own template using placeholders for entry price, stop loss, take profit, position size, and more.
Custom Signal Codes
Add your own identifiers to each signal for automation workflows. Useful if you're routing alerts to multiple bots or tracking different setups.
🔧 HOW THE CORE SYSTEM WORKS
The Ribbon System
The indicator uses 5 pairs of EMAs (10 moving averages total) that create colored "clouds" on your chart:
Blue/Teal ribbons indicate bullish alignment
Red/Pink ribbons indicate bearish alignment
Mixed colors indicate neutral or transitional periods
The ribbon spacing automatically adjusts from a fast EMA (21) to a slow EMA (60), creating layers that show trend strength and direction.
Signal Generation
Signals appear when multiple conditions align:
For LONG signals:
Fast EMAs above slow EMAs
Price momentum positive and strong (> 0.5 ATR)
Volume above average (> 1.1x)
Ribbon confirms bullish state
Confidence threshold met
MTF trend aligned (if enabled)
Within active session (if enabled)
For SHORT signals:
Opposite conditions apply.
Green "BUY" or Red "SELL" labels appear at candle close. All signals confirmed — no repainting.
Risk Management Lines
Lines appear when you have an active position:
White dotted line = Entry price
Red dotted line = Stop loss level
Green dotted lines = Take profit targets (TP1, TP2, Final TP in Pro)
Performance Dashboard
The stats table shows:
Current position status (In Long/Short or Waiting for signal)
Entry, stop, and target prices when in a trade
Win/loss record
Win rate percentage with color coding
⚙️ SETTINGS
Signal Settings
Signal Sensitivity (1-10): Controls the minimum time between signals (cooldown period)
1 = 2 bars between signals (most frequent)
5 = 10 bars between signals (balanced)
10 = 20 bars between signals (most selective)
Signal Mode: Choose ribbon-based or momentum-based signal generation
Break-Even
Break-Even Trigger: Choose which TP level moves stop to entry
Options: After TP1 / After TP2 / Disabled
Multi-Timeframe
Enable MTF Confirmation: Filter signals by higher/lower timeframe trend
Select from 15m, 30m, 1H, 2H, 4H, Daily, Weekly
Display higher/lower timeframe ribbon directly on your chart
Session Filter
Enable Session Filter: Only generate signals during specified hours
Session Start: Set start time (e.g., 09:30)
Session End: Set end time (e.g., 16:00)
Timezone: Select your local timezone
Alerts
Alert Format: Choose from 4 formats
Standard: Basic signal info
Detailed: Full trade parameters
JSON: For webhook/bot integrations
Custom: Build your own templat
🎯 RISK MANAGEMENT
Stop Loss Calculation
Stops are based on ATR (Average True Range) which measures recent price volatility:
In quiet markets: Stops are placed closer to entry
In volatile markets: Stops are placed further away
This adaptive approach helps prevent stop-hunting while maintaining appropriate risk levels.
Alternatively, use percentage-based stops for fixed distance regardless of volatility.
Take Profit Calculation
Targets are calculated as a multiple of your stop distance:
If stop is 50 points away and you use 2R, target is 100 points away
Maintains consistent risk-reward ratios across all trades
Partial Take Profits
Scale out of positions to lock in profits while letting winners run
TP1: Close first portion (e.g., 50%) at conservative target
TP2: Close second portion (e.g., 25%) at intermediate target
Final: Remaining position (e.g., 25%) runs to full target
Combined with break-even protection, this creates a "risk-free" trade after TP1.
Required Win Rates
To break even after fees:
1.5R requires ~40% win rate
2R requires ~34% win rate
3R requires ~25% win rate
📊 RECOMMENDED USAGE
Timeframes
Daily charts show strongest performance in testing
1H, 4H works well with HTF confirmation enabled
Lower timeframes generate more signals but reduced quality — use tight filters
Markets
Works on all instruments: Stocks, Forex, Crypto, Futures, Indices
Best suited for trending markets
May generate false signals in tight ranges or choppy conditions
Use HTF filter to avoid counter-trend trades in ranging markets
Works on any market (Forex, Crypto, Stocks, Futures, Indices)
Free Lite version available for testing core functionality before purchase. No leverage recommendations — risk management is your responsibility.
📌 DISCLAIMER
This indicator is a tool to assist your trading decisions, not a guarantee of profits. Past performance does not guarantee future results. Always use proper risk management and never trade with money you cannot afford to lose. You are solely responsible for your trading decisions.

Infinity Algo Backtest█ OVERVIEW
Infinity Algo Backtest is a strategy testing system with 5 entry modes, 6 take-profit levels, and optional Auto-Tune optimization (historical simulation).
Switch between trend-following, contrarian, and sniper entries within one strategy. Auto-Tune runs historical simulations across hundreds of parameter combinations and selects the best-scoring configuration based on your chosen metric (not predictive AI).
Includes trailing stop-loss options, optional add-on entries (pyramiding), and structured alert messages for automation.
█ KEY FEATURES
✅ 5 Entry Modes: Normal, Smart, AI, HL Sniper, AI Sniper
✅ 3 Exit Modes: Percentage targets, Signal step-outs, Opposite signal flip
✅ 6 Take-Profit Levels with customizable partial position sizing
✅ Trailing Stop-Loss (None / Breakeven / Moving Target)
✅ Auto-Tune Optimization (Walk-Forward or Static)
✅ Optional add-on entries (pyramiding)
✅ Structured alert messages for webhook automation
✅ Designed for crypto, forex, stocks, indices, and commodities
█ WHAT MAKES THIS STRATEGY DIFFERENT
🧠 Auto-Tune Engine
Unlike static strategies, this system tests 500+ parameter combinations — varying sensitivity (5-28), thresholds, and trigger configs — then selects the best-scoring settings from historical simulations.
Choose from 12 scoring metrics: Sharpe Ratio, Sortino Ratio, Calmar Ratio, SQN, Martin Ratio, GPR, Win Rate, Total Profit, Average Profit, Profit Factor, Sortino + Calmar Composite, and Robust Score.
Note: Auto-Tune is systematic parameter optimization on historical data — not predictive AI. Past performance does not guarantee future results.
🎯 Multi-Mode Entry System
Switch between trend-following, contrarian, and sniper modes — all within one strategy. No need to maintain multiple scripts.
🛡️ Adaptive Risk Management
Trailing SL modes that respond to your TP hits:
Breakeven: Locks in safety after your chosen TP is reached
Moving Target: Ratchets your stop to the previous TP level as profit grows
📊 Reproducible Results
Full transparency on strategy properties so you can replicate exact backtest conditions.
█ ENTRY ENGINES
Normal + Smart (Default)
Normal: Contrarian entries — momentum cross against the trend filter for reversal plays
Smart: Trend-following entries — momentum cross with the trend filter for continuation plays
Auto-Tune Mode
Tests 500+ parameter combinations against historical data
Simulates trades internally using your TP/SL configuration
Scores by your chosen metric (Sharpe, Sortino, Calmar, Win Rate, etc.)
Walk-Forward: Re-optimizes every N bars to adapt to regime changes
Static: Locks in best-scoring settings from full available history
HL Sniper
Trend-trigger mode for more selective entries
Fewer signals, but more selective setups
Auto-Tune Sniper
Optimizes RSI period, smoothing factor, and trigger sensitivity
Adapts sniper configuration based on historical performance
█ EXIT MODES
1) Percentage Targets
Up to 6 TP levels (TP1…TP6) with customizable partial exits
Configure both price distance (%) and position size (%) for each level
Designed for scaling out rather than all-in/all-out
2) Signal Step-Outs
Momentum-shift condition triggers partial exits
Optional higher-timeframe confirmation
"New TP Must Beat Last" prevents weak consecutive exits
3) Opposite Signal
Closes/flips position when the next opposite entry signal appears
Best for trend-following systems
█ USE CASES
📈 Trending Markets
Use "Smart" signals + Percentage TPs. Stay aligned with momentum while scaling out at multiple targets. Enable Moving Target trailing to lock in profits.
📉 Ranging / Choppy Markets
Use "Normal" signals (contrarian mode). Catch reversals at range boundaries. Tighter TP targets work better here.
⚡ High Volatility / News Events
Use "HL Sniper" for selective entries. Fewer signals, more selective. Wider SL to accommodate volatility.
🤖 Automation & Bots
Structured alert payloads work with popular bot platforms and custom webhooks. Entry + 6 TPs + SL in one alert.
█ HOW TO USE
Apply to your chart (any timeframe, any market)
Start with Entry Signals = "Normal + Smart", Exit Mode = "Percentage"
Pick your direction (Long / Short / Both)
Adjust signal thresholds and trend filter length to match your style
Configure TP% levels and Qty% — total should sum to 100%
Enable Stop-Loss and choose a trailing mode
Set commission and slippage in Strategy Properties for realistic results
Optional: Enable Auto-Tune for adaptive optimization
█ STRATEGY PROPERTIES
Default settings for reproducible backtests:
Initial capital: 10,000 USD
Order size type: Cash
Default order size: 10,000
Process orders on close: Enabled
Pyramiding: Controlled by "Allow Add-On Entries"
For realistic results, set commission and slippage in Strategy Properties to match your broker/exchange.
█ ALERTS & AUTOMATION
The strategy outputs structured alert payloads compatible with:
Popular bot platforms and webhook receivers
Custom automation systems (JSON format)
Setup: Create alert → Select "Order fills and alert() function calls" → Use {{strategy.order.alert_message}} placeholder
█ WORKS ON
Crypto
Forex
Stocks
Indices
Commodities
█ REALISTIC EXPECTATIONS
No strategy wins 100% of the time — this is no exception
Auto-Tune optimizes on past data — it cannot predict the future
Backtest results ≠ live results (fees, slippage, and emotions matter)
Always validate with out-of-sample data before going live
Use proper position sizing and risk management
█ LIMITATIONS
Backtests are simulations — results depend on market conditions, fees, slippage, and parameters
Auto-Tune can overfit if used without out-of-sample validation
Multi-timeframe exit logic confirms on higher-TF bar closes (slight delay expected)
Use standard candles/bars for strategy testing (avoid Heikin Ashi, Renko)
█ DISCLAIMER
This strategy is provided for educational and informational purposes only and does not constitute financial advice. Past performance is not indicative of future results. Trading involves substantial risk of loss, and you are solely responsible for your own trading decisions.

BTC DCA Risk Metric StrategyBTC DCA Risk Strategy - Automated Dollar Cost Averaging with 3Commas Integration
Overview
This strategy combines the proven Oakley Wood Risk Metric with an intelligent tiered Dollar Cost Averaging (DCA) system, designed to help traders systematically accumulate Bitcoin during periods of low risk and take profits during high-risk conditions.
Key Features
📊 Multi-Component Risk Assessment
4-Year SMA Deviation: Measures Bitcoin's distance from its long-term mean
20-Week MA Analysis: Tracks medium-term momentum shifts
50-Day/50-Week MA Ratio: Captures short-to-medium term trend strength
All metrics are normalized by time to account for Bitcoin's maturing market dynamics
💰 3-Tier DCA Buy System
Level 1 (Low Risk): Conservative entry with base allocation
Level 2 (Lower Risk): Increased allocation as opportunity improves
Level 3 (Extreme Low Risk): Maximum allocation during rare buying opportunities
Buys execute every bar while risk remains below thresholds, enabling true DCA accumulation
📈 Progressive Profit Taking
Sell Level 1: Take initial profits as risk increases
Sell Level 2: Scale out further positions during elevated risk
Sell Level 3: Final exit during extreme market conditions
Sell levels automatically reset when new buy signals occur, allowing flexible re-entry
🤖 3Commas Integration
Fully automated webhook alerts for Custom Signal Bots
JSON payloads formatted per 3Commas API specifications
Supports multiple exchanges (Binance, Coinbase, Kraken, Gemini, Bybit)
Configurable quote currency (USD, USDT, BUSD)
How It Works
The strategy calculates a composite risk metric (0-1 scale):
0.0-0.2: Extreme buying opportunity (green zone)
0.2-0.5: Favorable accumulation range (yellow zone)
0.5-0.8: Neutral to cautious territory (orange zone)
0.8-1.0+: High risk, profit-taking zone (red zone)
Buy Logic: As risk decreases, position sizes increase automatically. If risk drops from L1 to L3 threshold, the strategy combines all three tier allocations for maximum exposure.
Sell Logic: Sequential profit-taking ensures you capture gains progressively. The system won't advance to Sell L2 until L1 completes, preventing premature full exits.
Configuration
Risk Metric Parameters:
All calculations use Bitcoin price data (any BTC chart works)
Time-normalized formulas adapt to market maturity
No manual parameter tuning required
Buy Settings:
Set risk thresholds for each tier (default: 0.20, 0.10, 0.00)
Define dollar amounts per tier (default: $10, $15, $20)
Fully customizable to your risk tolerance and capital
Sell Settings:
Configure risk thresholds for profit-taking (default: 1.00, 1.50, 2.00)
Set percentage of position to sell at each level (default: 25%, 35%, 40%)
3Commas Setup:
Create a Custom Signal Bot in 3Commas
Copy Bot UUID and Secret Token into strategy inputs
Enable 3Commas Alerts checkbox
Create TradingView alert: Condition → "alert() function calls only", Webhook → api.3commas.io
Backtesting Results
Strengths:
Systematically buys dips without emotion
Averages down during extended bear markets
Captures explosive bull run profits through tiered exits
Pyramiding (1000 max orders) allows true DCA behavior
Considerations:
Requires sufficient capital for multiple buys during prolonged downtrends
Backtest on Daily timeframe for most reliable signals
Past performance does not guarantee future results
Visual Design
The indicator pane displays:
Color-coded risk metric line: Changes from white→red→orange→yellow→green as risk decreases
Background zones: Green (buy), yellow (hold), red (sell) areas
Dashed threshold lines: Clear visual markers for each buy/sell level
Entry/Exit labels: Green buy labels and orange/red sell labels mark all trades
Credits
Original Risk Metric: Oakley Wood
Strategy Development & 3Commas Integration: Claude AI (Anthropic)
Modifications: pommesUNDwurst
Disclaimer
This strategy is for educational and informational purposes only. Cryptocurrency trading carries substantial risk of loss. Always conduct your own research and never invest more than you can afford to lose. The authors are not financial advisors and assume no responsibility for trading decisions made using this tool.

ETH INFINITY TREND [1H]: The Institutional Anti-Crash AlgorithmSTOP TRADING AGAINST THE TREND. AUTOMATE YOUR SUCCESS.
Are you tired of strategies that make big gains one month and give it all back the next? Are you looking for an algorithm capable of beating the market while strictly protecting your capital during Crashes?
Discover ETH Infinity Trend , the H1 Swing Trading strategy designed for consistency, safety, and long-term performance.
This is not a nervous scalping bot eaten alive by fees. It is an intelligent Trend Following system, calibrated to capture major Ethereum directional moves while staying liquid (Cash) when the market becomes dangerous.
🏆 WHY IS THIS STRATEGY UNIQUE?
✅ "Bulletproof" History (2017-2025) Unlike the market, which suffered massive losses in 2018 (-80%) and 2022 (-65%), this algorithm successfully protected capital during EVERY major bearish phase.
✅ Bull Run Outperformance The algorithm doesn't just follow; it accelerates gains during parabolic phases (like 2021 and 2025) by staying in position as long as the bullish structure remains intact.
✅ Zero Stress / Zero Overtrading The strategy is patient. It filters out market "noise" to take only high-probability moves. No more stress from holding open positions during crashes.
⚙️ THE "SMART TREND" ENGINE (Proprietary Logic)
This script uses a combination of 3 algorithmic engines to secure your entries. Exact settings are protected to ensure a competitive advantage for members:
Adaptive Trend Engine: Detects flow direction with a wide safety factor to avoid "scam wicks" and stop hunts typical of crypto exchanges. Institutional Long-Term Filter: We only trade in the direction of big investment funds. If the Macro trend is bearish, the algorithm forces a Cash (USDT) position to preserve capital. Dynamic Momentum Filter: The algorithm stays inactive during flat markets (Ranging) to avoid grinding down capital with fees. It only enters if the movement has genuine impulsive strength.
📊 CERTIFIED PERFORMANCE (Historical Backtests)
The numbers speak for themselves. Here is how the strategy behaves under extreme market conditions:
🟢 Current Profitability (2025 YTD): +91% While the classic market (Buy & Hold) shows about +55%, the algorithm massively outperforms by avoiding intermediate corrections.
🛡️ Crash Resistance (2018 Bear Market): +29% This is the most important statistic. In 2018, Ethereum lost -82% of its value. Most traders were wiped out. This strategy not only protected capital but finished the year in profit.
💎 Zero Negative Years (2017-2025) Over a complete 8-year history, including two major market cycles, the strategy has never closed a year with a loss.
📉 RISK MANAGEMENT
Profit Factor: > 2.0 (For every $1 lost, the strategy earns more than $2). Controlled Drawdown: The strategy cuts losing positions quickly using a dynamic Trailing Stop, keeping equity drawdown far below that of the market. Fees Included: All results include transaction fees (Taker) and slippage estimates.
🤖 READY FOR AUTOMATION
This script is turnkey ready to be connected to bots via Webhooks (3Commas, Alertatron, or Custom Python Bot on Vultr/AWS).
No Repainting: Signals are fixed at candle close. What you see is what executes. Clear Signals: Buy (Long) and Exit alerts are fully configurable. Zero Leverage Needed: The strategy is designed to be profitable on Spot or 1x Futures.
🔒 ACCESS & INVITATION
This script is available via Invite Only to guarantee exclusivity and preserve signal quality.
👉 HOW TO GET ACCESS? Send me a private message here on TradingView to inquire about access conditions.
Disclaimer: Past performance is not indicative of future results. Cryptocurrency trading involves risk. Only invest what you can afford to lose.

RT-Main IndicatorThe RT-Main Indicator is the core indicator that started it all. Developed over more than 5 years, this all in one tool helps traders identify when market participants are buying and selling using multi-colored candles that update in real time. It also identifies key support and resistance levels with Rainbow Pivots and highlights unusual price movements with Whale Print arrows. At its core, the RT-Main Indicator tracks buying and selling with eight colors instead of two, because real world markets are complex and order flow should not be treated as purely binary(Red vs Green).
Introduction
The RT-Main Indicator is designed as a primary Rainbow Theory Tool. It uses color coded candles to show changes in strength, Rainbow Pivots to mark important support and resistance areas, and Whale Prints to flag abnormal buy and sell activity. The goal is to bring these components together into a single framework so traders can read trend, structure, and larger player behavior without stacking many separate indicators.
This tutorial will cover each aspect of the tool:
Colored Candles
Whales are stealth experts and their strength is their ability to not be detected as they move the market. Rainbow Theory illuminates them from the shadows with a spectrum of specifically coded colors to display their unique strengths/weaknesses. In practice, this means the RT-Main Indicator uses internal strength and exhaustion metrics to color candles so that shifts in buying and selling pressure are easier to see.
The base of the RT-Main Indicator is the colored candles it paints onto the chart. These colors automatically tune to the chart based on the timeframe the trader is currently using (1D, H12, H1, 15M, etc). Instead of painting charts with a single Bullish Color (Green) and a single Bearish Color (Red), Rainbow Theory breaks out and identifies these moves into four Bearish Colors (Red|Orange|Yellow|White) and four Bullish Colors (Green|Blue|Purple|Pink). Each color tells a different story of the trend and helps traders better understand the nature of the current trend.
Bullish Colors
#4 - Green Candles - Weakest bullish color, these trends can sustain for extended periods of time.
#3 - Blue Candles - Strong bullish color, a move is starting to develop and can sustain.
#2 - Purple Candles - Second strongest bullish color, Whales are committed to the move but cannot sustain this level of momentum for long durations and a top is near.
#1 - Pink Candles - Strongest bullish color, Whales are using every single ounce of energy they have to push price up, the trend cannot be sustained and its time to take profits.
Bearish Colors
#4 - Red Candles - Weakest bearish color, these trends can sustain for extended periods of time.
#3 - Orange Candles - Strong bearish color, a move is starting to develop and can sustain.
#2 - Yellow Candles - Second strongest bearish color, Whales are committed to the move but cannot sustain this level of momentum for long durations and a bottom is near.
#1 - White Candles - Strongest bearish color, Whales are using every single ounce of energy they have to push price down into all out capitulation, the trend cannot be sustained and its time to look for entries.
How To Enable Colored Candles
By default, the Indicator’s Candles are placed behind the default candles. To properly display them, you must bring them forward. To do this, click the settings icon on the indicator, click visual order and then click bring to front:
Example - Bringing all the colors together into a Bearish Trend that reverses into a Bullish Trend:
The color thresholds can be tuned using the following options:
Automatic Tuning On/Off - Enables or disables the automatic color tuning that adjusts for each timeframe.
Auto Tuning Gain (Inc/Dec) - Increases or decreases how aggressive the automatic tuning algorithm adjusts color tuning.
Manual Fine Tuning - Linear Color Shift - Manually controls the linear sensitivity for color candle thresholds. This can be visualized as a setting being adjusted up or down in a straight, linear fashion. Linear Color Shift
Manual Fine Tuning - Exponential Color Shift - Manually controls the exponential sensitivity for color candle thresholds. This can be visualized as a setting being adjusted in an exponential manner where each level moves in an exponential shift instead of all moving equally. Exponential Color Shift Dark Mode
Some traders prefer light colored backgrounds for their charting, which can make white candles difficult to see. The RT-Main Indicator includes a Dark Mode toggle so colors stay readable on both dark and light charts.
Dark Mode Candles On/Off - Forces the indicator to use the second color set stored in the Style tab in the RT-Main Indicator settings when using light backgrounds. The White/Black Candle can also have a custom color applied if the trader is not content with these two default options.
Custom Candle Colors
In addition to toggling between light and dark modes, each individual color used by the RT-Main Indicator can be edited in the Style tab. This allows traders to keep the same logic while adjusting the visual palette to match their own chart layout.
Rainbow Rotations
Rainbow Rotations are a feature traders use to catch reversals or reversions when a trend fully blows out. The algorithm triggers on the first weaker candle that closes after a Pink or White candle prints. The general idea of this event is to show peaks and valleys of an asset.
In a strong bearish move, White candles mark extreme selling. If a weaker Yellow candle appears after a White candle, that first weaker candle is where the rotation event triggers and a Rainbow Rotation marker is placed on the chart. In a strong bullish move, Pink candles mark extreme buying. The first weaker bullish candle after a Pink candle triggers the opposite side rotation marker.
Note that Rainbow Rotations can only be visible for a finite amount of candles. The Replay function in TradingView can be used to review previous triggers.
Rainbow Rotation settings are available near the top of the settings menu:
Rainbow Rotation Alerts On/Off - Toggles these signals on or off with one click.
Rainbow Rotation Symbol - Customizes the symbol that is plotted on the chart for Rainbow Rotations. Both text and emojis can be used instead of the default symbol.
Rainbow Rotation Alerts
Rainbow Rotations can also be automated with standard TradingView alerts. To set this up:
Click the Alert icon on the right side of the screen.
Change Condition to the RT-Main Indicator.
Change the second condition to one of the three options:
Bullish Alerts | Bearish Alerts | Bearish and Bullish Alerts
Set Trigger to Once Per Bar Close.
Once set up, this allows traders to be notified when the RT-Main Indicator detects an extreme bullish or bearish trend that is starting to reverse.
Automated Pivots
One of the RT-Main Indicator's most powerful functions is the automated support and resistance pivots. This logic uses two internal bots that are tuned to look for potential support and resistance order blocks.
The Resistance Pivot Bot prints lines that are painted with red dashes.
The Support Pivot Bot prints lines that are painted with green dashes.
Regardless of the color of the dashed pivot line, any trend that approaches a pivot should be respected. For example, a trend moving up towards a green support pivot should still treat that area as resistance if price is approaching from below.
As the algorithm continues to print additional pivots on the chart, traders can start identifying order blocks that are otherwise hidden in the price action. These order blocks are key support and resistance areas that trends will often interact with and respect. Multiple stacked pivots in the same region are a visual clue that such an order block has formed.
Pivots can be tuned with the following options:
Pivot On/Off - Quickly toggles all pivots on or off.
Pivot Style - Switches between different styles of marking pivots.
Pivot Sensitivity (Inc/Dec) - Tunes the sensitivity of the pivot algorithms. Adjusting this changes how many pivots are printed on the chart.
Pivot Line Drawing Length - Controls how long the indicator draws the pivot lines.
Resistance / Support Pivot Colors - Allows customization of pivot colors to match the rest of the chart.
Whale Prints
One of the most important parts of the RT-Main Indicator is tracking Whale Prints. This portion of the script looks for abnormal buys and sells that are more consistent with large players than typical flow. Under normal circumstances, whales try to avoid being visible when they buy or sell, but there are times where they are forced to come out of hiding and deliberately move the market.
The Whale Print logic is tuned to notify the trader when it detects that this type of unusual activity may be occurring.
Bearish Whale Prints are marked on the chart with a red triangle.
Bullish Whale Prints are marked on the chart with a green triangle.
Whale Print clusters are situations where multiple Whale Prints have been identified in the past 10 candles. While individual Whale Prints are useful, clusters of Whale Prints are particularly important because they often signal that a very large move is potentially being prepared/defended.
The Whale Print table is an active tracker that counts the number of bullish and bearish Whale Prints that have occurred in the past 10 candles. Whale Print settings can be tuned with:
Whale Print Clusters Table On/Off - Toggles the Whale Print table on or off with one click.
Whale Print Clusters Alerts On/Off - Toggles the Whale Print cluster symbol on or off.
Whale Print Cluster Symbol - Changes the symbol on the chart for Whale Clusters. Emojis and text can both be used instead of the default symbol.
Whale Print Cluster Bullish/Bearish Label Color - Customizes the color of the Whale Print cluster labels on the chart. Whale Print Cluster Alerts
Whale Print Cluster alerts can be automated with standard TradingView alerts. To set this up:
Click the Alert icon on the right side of the screen.
Change Condition to the RT-Main Indicator.
Change the second condition to one of the two options:
Bull Whale Cluster Alert | Bear Whale Cluster Alert
Set Trigger to Once Per Bar Close. Once set up, this allows traders to be notified when the RT-Main Indicator detects a Whale Print Cluster.
Bull/Bear Trend Step Line
The inflection point of the colored candles is controlled by the Bull/Bear Trend Step Line. This is the grey stepped line on the chart where the bullish and bearish colors meet. Candles above this line are marked by the four bullish candle colors.
Candles below this line are marked by the four bearish candle colors.
The Bull/Bear Trend Step Line can be tuned with:
Bull/Bear Line Offset - Controls a vertical threshold for the line.
Bull/Bear Line Smoothness - Controls the sensitivity and smoothness of the line so traders can fine tune it for their specific setups. Most traders do not adjust the Bull/Bear Step Line. The small group that does typically only use these settings for lower timeframe trading setups below 5 minute candles. If preferred, the line can be recolored or hidden from the Style tab of the RT-Main Indicator without changing how the core color logic works.
Important Note
The RT-Main Indicator is intended to provide additional context around trend strength, exhaustion, and key areas of support and resistance. It is not a standalone signal generator and should always be used together with your own analysis, testing, and risk management. Historical color patterns, pivots, and Whale Prints do not guarantee future results.
🐋 Tight lines and happy trading!

EMA + RSI Autotrade Webhook - VarunOverview
The EMA + RSI Autotrade Webhook is a powerful trend-following indicator designed for automated crypto futures trading. This indicator combines the reliability of Exponential Moving Average (EMA) crossovers with RSI momentum filtering to generate high-probability buy and sell signals optimized for webhook integration with crypto exchanges like Delta Exchange, Binance Futures, and Bybit.Key Features
Simple & Effective: Uses proven EMA 9/21 crossover strategy
RSI Momentum Filter: Eliminates low-probability trades in ranging markets
Webhook Ready: Two clean alerts (LONG Entry, SHORT Entry) for seamless automation
Exchange Compatible: Works with Delta Exchange, 3Commas, Alertatron, and other webhook platforms
Zero Lag Signals: Real-time alerts on crossover confirmation
Visual Clarity: Clean chart markers for easy signal identification
How It Works
Entry Signals:
LONG Entry: Triggers when EMA 9 crosses above EMA 21 AND RSI is above 52 (bullish momentum confirmed)
SHORT Entry: Triggers when EMA 9 crosses under EMA 21 AND RSI is below 48 (bearish momentum confirmed)
Technical Components:
Fast EMA: 9-period (tracks short-term price action)
Slow EMA: 21-period (identifies primary trend)
RSI: 14-period (confirms momentum strength)
RSI Long Threshold: 52 (filters weak bullish signals)
RSI Short Threshold: 48 (filters weak bearish signals)
Best Use Cases
Crypto Futures Trading: Bitcoin, Ethereum, Altcoin perpetual contracts
Automated Trading Bots: Integration with Delta Exchange webhooks, TradingView alerts
Timeframes: Optimized for 15-minute charts (works on 5min-1H)
Markets: Trending crypto markets with clear directional moves
Risk Management: Best used with 1-2% stop loss per trade (managed externally)
Webhook Automation Setup
Add indicator to your TradingView chart
Create alerts for "LONG Entry" and "SHORT Entry"
Configure webhook URL from your exchange (Delta Exchange, Binance, etc.)
Use alert message: Entry LONG {{ticker}} @ {{close}} or Entry SHORT {{ticker}} @ {{close}}
Exchange automatically reverses positions on opposite signals
Advantages
✅ No manual trading required - fully automated
✅ Eliminates emotional trading decisions
✅ Catches trending moves early with EMA crossovers
✅ RSI filter reduces whipsaws in choppy markets
✅ Works 24/7 without monitoring
✅ Simple two-alert system (easy to manage)
✅ Compatible with multiple exchanges via webhooksStrategy Philosophy
This indicator follows a trend-following with momentum confirmation approach. By waiting for both EMA crossover AND RSI confirmation, it ensures you're entering trades with genuine momentum behind them, not just random price noise. The tight RSI thresholds (52/48) keep you aligned with the prevailing trend.Recommended Settings
Timeframe: 15-minute (primary), 5-minute (scalping), 1-hour (swing)
Markets: BTC/USDT, ETH/USDT, high-liquidity altcoin perpetuals
Position Sizing: 100% capital per signal (exchange manages reversals)
Stop Loss: 2% (managed via exchange or external bot)
Leverage: 1-2x for conservative approach, up to 5x for aggressive
Important Notes
⚠️ This indicator generates entry signals only - position reversals are handled automatically by your exchange
⚠️ Always backtest on historical data before live trading
⚠️ Use proper risk management and position sizing
⚠️ Best performance in trending markets; may generate false signals in tight ranges
⚠️ Requires TradingView Premium or higher for webhook functionalityTags
cryptocurrency futures automated-trading ema-crossover rsi webhook delta-exchange tradingview-alerts trend-following momentum bitcoin ethereum crypto-bot algo-trading 15-minute-strategy

AutoPivot Levels with Alerts [ChartWhizzperer] – Dynamic EditionAuto-Pivot Levels 4 methods with alerts – Dynamic Edition
Now with
- Live Mode
- 4 Pivot Methods
- 7 Session Types (5m, 15m, 30m, Hourly, Daily, Weekly, Monthly)
- PineConnector-Ready Alerts!
Free, Open Source, Pine Script v6-compliant.
NEW: Live Mode (Ultra-Dynamic, Repainting) – Switchable in UI!
Instantly switch between Classic (session-based, repaint-free) and Live (rolling window, real-time, repainting) using the simple checkbox in the settings!
Live Mode recalculates all pivots on every tick/bar, using the current high/low/close for the chosen session (5m, 15m, 30m, hourly, daily, weekly, monthly).
Perfect for:
- Scalping and high-frequency trading
- Real-time bot/automation setups (PineConnector-ready)
- Fast-moving or breakout markets
Classic Mode: For traditional, stable levels based on confirmed session data – ideal for backtesting and trading history.
Four Calculation Methods (Choose What Fits YOU)
1. Classic
Standard pivot calculation.
Based on previous session’s High, Low, Close.
Simple, proven, and suitable for any asset.
2. Fibonacci
Projects levels using Fibonacci ratios of the prior session’s range.
Great for traders who want to align pivots with fib retracements and extensions.
3. Camarilla
Uses unique multipliers for support/resistance, focusing on mean reversion and volatility.
Popular among futures and forex day traders.
4. Woodie
Puts extra weight on previous Close for more responsive pivots.
Often used in trending or choppy conditions.
Switch methods anytime in the UI – the script recalculates instantly and keeps your chart clean!
Level-Specific Alerts – PineConnector Ready!
Dedicated alert for EVERY level and direction (Up/Down):
Pivot (P), R1, R2, R3, S1, S2, S3
No configuration hassle:
All alerts are pre-defined in the TradingView Alert Panel and work across all session types (5m → monthly).
Machine-readable message format:
PIVOT=R1 DIR=UP SYMBOL={{ticker}} PRICE={{close}}
Direct plug-and-play with PineConnector, webhooks, Discord, Telegram, bots, and other automation tools.
Never miss a breakout, reversal, or key support/resistance touch!
Powerful Customization & Performance
- Session selection: 5m, 15m, 30m, Hourly, Daily, Weekly, Monthly (choose what suits your trading style).
- Show/hide any level (Pivot, R1–R3, S1–S3) for minimal chart clutter.
- Color selection for each level to match your theme or highlight key pivots.
- Auto-cleanup: Old lines and labels are cleared on every recalculation or session change for maximum performance and visual clarity.
- Zero runtime errors: Strict Pine Script v6 practices for stability.
How To Use – Quick Start
1) Add the indicator to your TradingView chart.
2) Pick your calculation method (Classic, Fibonacci, Camarilla, Woodie).
3) Set session type (5m, 15m, 30m, Hourly, Daily, Weekly, Monthly).
4) Switch between Classic and Live Mode with a single click in settings.
5) Customize your levels (on/off, colors).
6) Open the Alert Panel, select any pre-configured alert (e.g. "R2 Cross Down"), and go live!
7) Connect with PineConnector or any webhook system instantly using the pre-formatted alert messages.
Who Is It For?
- Active scalpers & bot traders: Live Mode + PineConnector-ready alerts = instant, automated reactions.
- Swing and position traders: Use Classic Mode for stable, repaint-free levels.
- Strategy developers: Seamless integration into automated and manual trading workflows.
License & Community
Open Source, Non-Commercial:
Free for personal & educational use under CC BY-NC-SA 4.0.
Feedback, bug reports & ideas:
Drop a comment, or contact me for feature requests.
Trade smart. Trade dynamic. Unlock the true power of pivots – with ChartWhizzperer!

MACD Forecast [Titans_Invest]MACD Forecast — The Future of MACD in Trading
The MACD has always been one of the most powerful tools in technical analysis.
But what if you could see where it’s going, instead of just reacting to what has already happened?
Introducing MACD Forecast — the natural evolution of the MACD Full , now taken to the next level. It’s the world’s first MACD designed not only to analyze the present but also to predict the future behavior of momentum.
By combining the classic MACD structure with projections powered by Linear Regression, this indicator gives traders an anticipatory, predictive view, redefining what’s possible in technical analysis.
Forget lagging indicators.
This is the smartest, most advanced, and most accurate MACD ever created.
🍟 WHY MACD FORECAST IS REVOLUTIONARY
Unlike the traditional MACD, which only reflects current and past price dynamics, the MACD Forecast uses regression-based projection models to anticipate where the MACD line, signal line, and histogram are heading.
This means traders can:
• See MACD crossovers before they happen.
• Spot trend reversals earlier than most.
• Gain an unprecedented timing advantage in both discretionary and automated trading.
In other words: this indicator lets you trade ahead of time.
🔮 FORECAST ENGINE — POWERED BY LINEAR REGRESSION
At its core, the MACD Forecast integrates Linear Regression (ta.linreg) to project the MACD’s future behavior with exceptional accuracy.
Projection Modes:
• Flat Projection: Assumes trend continuity at the current level.
• LinReg Projection: Applies linear regression across N periods to mathematically forecast momentum shifts.
This dual system offers both a conservative and adaptive view of market direction.
📐 ACCURACY WITH FULL CUSTOMIZATION
Just like the MACD Full, this new version comes with 20 customizable buy-entry conditions and 20 sell-entry conditions — now enhanced with forecast-based rules that anticipate crossovers and trend reversals.
You’re not just reacting — you’re strategizing ahead of time.
⯁ HOW TO USE MACD FORECAST❓
The MACD Forecast is built on the same foundation as the classic MACD, but with predictive capabilities.
Step 1 — Spot Predicted Crossovers:
Watch for forecasted bullish or bearish crossovers. These signals anticipate when the MACD line will cross the signal line in the future, letting you prepare trades before the move.
Step 2 — Confirm with Histogram Projection:
Use the projected histogram to validate momentum direction. A rising histogram signals strengthening bullish momentum, while a falling projection points to weakening or bearish conditions.
Step 3 — Combine with Multi-Timeframe Analysis:
Use forecasts across multiple timeframes to confirm signal strength (e.g., a 1h forecast aligned with a 4h forecast).
Step 4 — Set Entry Conditions & Automation:
Customize your buy/sell rules with the 20 forecast-based conditions and enable automation for bots or alerts.
Step 5 — Trade Ahead of the Market:
By preparing for future momentum shifts instead of reacting to the past, you’ll always stay one step ahead of lagging traders.
🤖 BUILT FOR AUTOMATION AND BOTS 🤖
Whether for manual trading, quantitative strategies, or advanced algorithms, the MACD Forecast was designed to integrate seamlessly with automated systems.
With predictive logic at its core, your strategies can finally react to what’s coming, not just what already happened.
🥇 WHY THIS INDICATOR IS UNIQUE 🥇
• World’s first MACD with Linear Regression Forecasting
• Predictive Crossovers (before they appear on the chart)
• Maximum flexibility with Long & Short combinations — 20+ fully configurable conditions for tailor-made strategies
• Fully automatable for quantitative systems and advanced bots
This isn’t just an update.
It’s the final evolution of the MACD.
______________________________________________________
🔹 CONDITIONS TO BUY 📈
______________________________________________________
• Signal Validity: The signal will remain valid for X bars .
• Signal Sequence: Configurable as AND or OR .
🔹 MACD > Signal Smoothing
🔹 MACD < Signal Smoothing
🔹 Histogram > 0
🔹 Histogram < 0
🔹 Histogram Positive
🔹 Histogram Negative
🔹 MACD > 0
🔹 MACD < 0
🔹 Signal > 0
🔹 Signal < 0
🔹 MACD > Histogram
🔹 MACD < Histogram
🔹 Signal > Histogram
🔹 Signal < Histogram
🔹 MACD (Crossover) Signal
🔹 MACD (Crossunder) Signal
🔹 MACD (Crossover) 0
🔹 MACD (Crossunder) 0
🔹 Signal (Crossover) 0
🔹 Signal (Crossunder) 0
🔮 MACD (Crossover) Signal Forecast
🔮 MACD (Crossunder) Signal Forecast
______________________________________________________
______________________________________________________
🔸 CONDITIONS TO SELL 📉
______________________________________________________
• Signal Validity: The signal will remain valid for X bars .
• Signal Sequence: Configurable as AND or OR .
🔸 MACD > Signal Smoothing
🔸 MACD < Signal Smoothing
🔸 Histogram > 0
🔸 Histogram < 0
🔸 Histogram Positive
🔸 Histogram Negative
🔸 MACD > 0
🔸 MACD < 0
🔸 Signal > 0
🔸 Signal < 0
🔸 MACD > Histogram
🔸 MACD < Histogram
🔸 Signal > Histogram
🔸 Signal < Histogram
🔸 MACD (Crossover) Signal
🔸 MACD (Crossunder) Signal
🔸 MACD (Crossover) 0
🔸 MACD (Crossunder) 0
🔸 Signal (Crossover) 0
🔸 Signal (Crossunder) 0
🔮 MACD (Crossover) Signal Forecast
🔮 MACD (Crossunder) Signal Forecast
______________________________________________________
______________________________________________________
🔮 Linear Regression Function 🔮
______________________________________________________
• Our indicator includes MACD forecasts powered by linear regression.
Forecast Types:
• Flat: Assumes prices will stay the same.
• Linreg: Makes a 'Linear Regression' forecast for n periods.
Technical Information:
• Function: ta.linreg()
Parameters:
• source: Source price series.
• length: Number of bars (period).
• offset : Offset.
• return: Linear regression curve.
______________________________________________________
______________________________________________________
⯁ UNIQUE FEATURES
______________________________________________________
Linear Regression: (Forecast)
Signal Validity: The signal will remain valid for X bars
Signal Sequence: Configurable as AND/OR
Table of Conditions: BUY/SELL
Conditions Label: BUY/SELL
Plot Labels in the graph above: BUY/SELL
Automate & Monitor Signals/Alerts: BUY/SELL
Linear Regression (Forecast)
Signal Validity: The signal will remain valid for X bars
Signal Sequence: Configurable as AND/OR
Table of Conditions: BUY/SELL
Conditions Label: BUY/SELL
Plot Labels in the graph above: BUY/SELL
Automate & Monitor Signals/Alerts: BUY/SELL
______________________________________________________
📜 SCRIPT : MACD Forecast
🎴 Art by : @Titans_Invest & @DiFlip
👨💻 Dev by : @Titans_Invest & @DiFlip
🎑 Titans Invest — The Wizards Without Gloves 🧤
✨ Enjoy!
______________________________________________________
o Mission 🗺
• Inspire Traders to manifest Magic in the Market.
o Vision 𐓏
• To elevate collective Energy 𐓷𐓏
🎗️ In memory of João Guilherme — your light will live on forever.

24/7 Dynamic Scalper - Session + ATR Filters24/7 Dynamic Scalper — Session + ATR Filters
The only scalping strategy you’ll need for non-stop, high-precision trading — engineered for automation and hands-off profits!
Session Filtering: Trade only during the hottest market hours (Asia Open & EU Session) — fully automatic.
ATR Stability & Dynamic Risk: Filters out chop and volatility spikes for cleaner, higher-probability entries.
Momentum & Exhaustion Protection: Built-in RSI & MACD logic blocks overbought/oversold traps and weak signals.
Time-in-Trade Auto-Exit: No more stale trades — get capped exposure for every position.
Auto Alerts: Sends structured, ready-to-automate alerts (BUY/SELL/EXIT) — perfect for webhook and bot traders.
Optional Volume/TP Filters: Toggle volume spikes, dynamic ATR-based TP, and even “big candle” protection.
Fully Customizable: Fine-tune everything from leverage to max stop loss (in USDT), bar/range filters, and much more.
Best for: Fast scalpers, algo traders, automation junkies, and anyone who wants a robust, hands-off approach to perpetual futures.
👇 How it Works (Feature Breakdown):
Session Filters: Restricts signals to the highest liquidity hours (Asia/EU), or trade 24/7 — your choice!
ATR + Range Filters: Ensures every entry has real volatility and avoids dangerous chop.
Momentum Logic: Combines EMA, MACD slope, and RSI direction to hunt for real breakouts only.
Exhaustion Safeguards: Avoids classic scalp reversals by blocking overbought/oversold and exhausted MACD/RSI momentum.
Drawdown Defense: Detects “big candle” traps, ATR surges, and lets you cap stop-loss by percent or by max USDT.
Hands-Off Management: All exits (TP/SL/trailing) are managed by your backend/bot via structured alerts — the script keeps charts clean and exits only by time cap (so no backend/strategy overlap).
Ready for Webhook Automation: Clean JSON alerts for BUY, SELL, and CLOSE — drop them straight into your bot for instant auto-trading.
No repaint, no nonsense — just cold, fast, high-frequency scalping with robust, smart filters.
🚀 Plug, Play, Automate.
Copy to your chart, tweak your session/ATR/settings, and wire up your alert to your favorite webhook bot.
Perfect for Bybit, MEXC, Binance, and anywhere you can automate.