VWAP StrategyVWAP and volatility filters for structured intraday trades.
How the Strategy Works
1. VWAP Anchored to Session
VWAP is calculated from the start of each trading day.
Standard deviations are used to create bands above/below the VWAP.
2. Entry Triggers: Al Brooks H1/H2 and L1/L2
H1/H2 (Long Entry): Opens below 2nd lower deviation, closes above it.
L1/L2 (Short Entry): Opens above 2nd upper deviation, closes below it.
3. Volatility Filter (ATR)
Skips trades when deviation bands are too tight (< 3 ATRs).
4. Stop Loss
Based on the signal bar’s high/low ± stop buffer.
Longs: signalBarLow - stopBuffer
Shorts: signalBarHigh + stopBuffer
5. Take Profit / Exit Target
Exit logic is customizable per side:
VWAP, Deviation Band, or None
6. Safety Exit
Exits early if X consecutive bars go against the trade.
Longs: X red bars
Shorts: X green bars
Explanation of Strategy Inputs
- Stop Buffer: Distance from signal bar for stop-loss.
- Long/Short Exit Rule: VWAP, Deviation Band, or None
- Long/Short Target Deviation: Standard deviation for target exit.
- Enable Safety Exit: Toggle emergency exit.
- Opposing Bars: Number of opposing candles before safety exit.
- Allow Long/Short Trades: Enable or disable entry side.
- Show VWAP/Entry Bands: Toggle visual aids.
- Highlight Low Vol Zones: Orange shading for low volatility skips.
Tuning Tips
- Stop buffer: Use 1–5 points.
- Target deviation: Start with VWAP. In strong trends use 2nd deviation and turn off the counter-trend entry.
- Safety exit: 3 bars recommended.
- Disable short/long side to focus on one type of reversal.
Backtest Setup Suggestions
- initial_capital = 2000
- default_qty_value = 1 (fixed contracts or percent-of-equity)
Pesquisar nos scripts por "bands"

Multi-Band Comparison Strategy (CRYPTO)Multi-Band Comparison Strategy (CRYPTO)
Optimized for Cryptocurrency Trading
This Pine Script strategy is built from the ground up for traders who want to take advantage of cryptocurrency volatility using a confluence of advanced statistical bands. The strategy layers Bollinger Bands, Quantile Bands, and a unique Power-Law Band to map out crucial support/resistance zones. It then focuses on a Trigger Line—the lower standard deviation band of the upper quantile—to pinpoint precise entry and exit signals.
Key Features
Bollinger Band Overlay
The upper Bollinger Band visually shifts to yellow when price exceeds it, turning black otherwise. This offers a straightforward way to gauge heightened momentum or potential market slowdowns.
Quantile & Power-Law Integration
The script calculates upper and lower quantile bands to assess probabilistic price extremes.
A Power-Law Band is also available to measure historically significant return levels, providing further insight into overbought or oversold conditions in fast-moving crypto markets.
Standard Deviation Trigger
The lower standard deviation band of the upper quantile acts as the strategy’s trigger. If price consistently holds above this line, the strategy interprets it as a strong bullish signal (“green” zone). Conversely, dipping below indicates a “red” zone, signaling potential reversals or exits.
Consecutive Bar Confirmation
To reduce choppy signals, you can fine-tune the number of consecutive bars required to confirm an entry or exit. This helps filter out noise and false breaks—critical in the often-volatile crypto realm.
Adaptive for Multiple Timeframes
Whether you’re scalping on a 5-minute chart or swing trading on daily candles, the strategy’s flexible confirmation and overlay options cater to different market conditions and trading styles.
Complete Plot Customization
Easily toggle visibility of each band or line—Bollinger, Quantile, Power-Law, and more.
Built-in Simple and Exponential Moving Averages can be enabled to further contextualize market trends.
Why It Excels at Crypto
Cryptocurrencies are known for rapid price swings, and this strategy addresses exactly that by combining multiple statistical methods. The quantile-based confirmation reduces noise, while Bollinger and Power-Law bands help highlight breakout regions in trending markets. Traders have reported that it works seamlessly across various coins and tokens, adapting its triggers to each asset’s unique volatility profile.
Give it a try on your favorite cryptocurrency pairs. With advanced data handling, crisp visual cues, and adjustable confirmation logic, the Multi-Band Comparison Strategy provides a robust framework to capture profitable moves and mitigate risk in the ever-evolving crypto space.
[ETH] Optimized Trend Strategy - Lorenzo SuperScalpStrategy Title: Optimized Trend Strategy - Lorenzo SuperScalp
Description:
The Optimized Trend Strategy is a comprehensive trading system tailored for Ethereum (ETH) and optimized for the 15-minute timeframe but adaptable to various timeframes. This strategy utilizes a combination of technical indicators—RSI, Bollinger Bands, and MACD—to identify and act on price trends efficiently, providing traders with actionable buy and sell signals based on market conditions.
Key Features:
Multi-Indicator Approach:
RSI (Relative Strength Index): Identifies overbought and oversold conditions to time market entries and exits.
Bollinger Bands: Acts as a dynamic support and resistance level, helping to pinpoint precise entry and exit zones.
MACD (Moving Average Convergence Divergence): Detects momentum changes through bullish and bearish crossovers.
Signal Conditions:
Buy Signal:
RSI is below 45 (indicating an oversold condition).
Price is near or below the lower Bollinger Band.
MACD bullish crossover occurs.
Sell Signal:
RSI is above 55 (indicating an overbought condition).
Price is near or above the upper Bollinger Band.
MACD bearish crossunder occurs.
Trade Execution Logic:
Long Trades: Opened when a buy signal flashes. If there’s an open short position, it is closed before opening a long.
Short Trades: Opened when a sell signal flashes. If there’s an open long position, it is closed before opening a short.
The strategy also ensures a minimum number of bars between consecutive trades to avoid rapid trading in choppy conditions.
Pyramiding Support:
Up to 3 consecutive trades in the same direction are allowed, enabling traders to scale into positions based on strong signals.
Visual Indicators:
RSI Levels: Dotted lines at 45 and 55 for quick reference to oversold and overbought levels.
Buy and Sell Signals: Visual markers on the chart indicate where trades are executed, ensuring clarity on entry and exit points.
Best Used For:
Swing Trading & Scalping: While optimized for the 15-minute timeframe, this strategy works across various timeframes, making it suitable for both short-term scalping and swing trading.
Crypto Trading: Tailored for Ethereum but effective for other cryptocurrencies due to its dynamic indicator setup.

MA MACD BB BackTesterOverview:
This Pine Script™ code provides a comprehensive backtesting tool that combines Moving Average (MA), Moving Average Convergence Divergence (MACD), and Bollinger Bands (BB). It is designed to help traders analyze market trends and make informed trading decisions by testing various strategies over historical data.
Key Features:
1. Customizable Indicators:
Moving Average (MA): Smooths out price data for clearer trend direction.
MACD: Measures trend momentum through MACD Line, Signal Line, and Histogram.
Bollinger Bands (BB): Identifies overbought or oversold conditions with upper and lower bands.
2. Flexible Trading Direction: Choose between long or short positions to adapt to different market conditions.
3. Risk Management: Efficiently allocate your capital with customizable position sizes.
4. Signal Generation:
Buy Signals: Triggered by crossovers for MACD, MA, and BB.
Sell Signals: Triggered by crossunders for MACD, MA, and BB.
5. Automated Trading: Automatically enter and exit trades based on signal conditions and strategy parameters.
How It Works:
1. Indicator Selection: Select your preferred indicator (MA, MACD, BB) and trading direction (Long/Short).
2. Risk Management Configuration: Set the percentage of capital to allocate per position to manage risk effectively.
3.Signal Detection: The algorithm identifies and plots buy/sell signals directly on the chart based on the chosen indicator.
4. Trade Execution: The strategy automatically enters and exits trades based on signal conditions and configured strategy parameters.
Use Cases:
- Backtesting: Evaluate the effectiveness of trading strategies using historical data to understand potential performance.
- Strategy Development: Customize and expand the strategy to incorporate additional indicators or conditions to fit specific trading styles.
ADDONS That Affect Strategy:
1. Indicator Parameters:
Adjustments to the settings of MACD (e.g., fast length, slow length), MA (e.g., length), and BB (e.g., length, multiplier) will directly impact the detection of signals and the strategy's performance.
2. Trading Direction:
Changing the trading direction (Long/Short) will alter the entry and exit conditions based on the detected signals.
3. Risk Management Settings:
Modifying the position size percentage affects capital allocation and overall risk exposure per trade.
ADDONS That Do Not Affect Strategy:
1. Visual Customizations:
Changes to the color, shape, and style of the plotted lines and signals do not impact the core functionality of the strategy but enhance visual clarity.
2. Text and Labels:
Modifying text labels for the signals (such as renaming "Buy MACD" to "MACD Buy Signal") is purely cosmetic and does not influence the strategy’s logic or outcomes.
Notes:
- Customization: The indicator is highly customizable to fit various trading styles and market conditions.
- Risk Management: Adjust position sizes and risk parameters according to your risk tolerance and account size.
- Optimization: Regularly backtest and optimize parameters to adapt to changing market dynamics for better performance.
Getting Started:
-Add the script to your chart.
-Adjust the input parameters to suit your analysis preferences.
-Observe the marked buy and sell signals on your chart to make informed trading decisions.

TrailingTakeProfit exampleQuite recently I came upon a concept of Trailing Take Profit and I couldn't find a PineScript which implements it for the fastest possible execution, so here it is :)
Everybody knows Trailing StopLoss - an invisible mechanism follows the price and exits the trade once the price retreats too much from its recent most extended favourable value. Trailing TakeProfit does the similar thing, but at the opposite end - the trade gets closed if a price moves too well, in too favourable extent.
Why close the trade if it is going so good? Well, whatever goes up, must go down and vice versa. It is expected, that after fast rally a market will soon fall and after a dump it will go up. So Trailing TakeProfit's role is to secure profits.
But how does Trailing TakeProfit differ from the standard one? "Trailing" means, the exit level is moving. Its role is to be executed only after a rapid favourable move within 1-2 candles, not more. We never know when a rapid move happens, but when it does, we wanna catch those pips and quickly exit without looking back.
Visually Trailing TakeProfit levels are... bands. In this script example these are ATR multiplied bands (aka Keltner Channel), but they could also be Bollinger Bands or something else.
The code is simple just to focus on this single functionality, so you can quickly copy-paste it into your script. Entries are triggered by default SMA crosses.
P.S. I wouldn't be myself, if I didn't add alert messages compatible with the syntax of recently revamped TradingConnector - both in the code already and in the table showing them.

Supertrend Advance Pullback StrategyHandbook for the Supertrend Advance Strategy
1. Introduction
Purpose of the Handbook:
The main purpose of this handbook is to serve as a comprehensive guide for traders and investors who are looking to explore and harness the potential of the Supertrend Advance Strategy. In the rapidly changing financial market, having the right tools and strategies at one's disposal is crucial. Whether you're a beginner hoping to dive into the world of trading or a seasoned investor aiming to optimize and diversify your portfolio, this handbook offers the insights and methodologies you need. By the end of this guide, readers should have a clear understanding of how the Supertrend Advance Strategy works, its benefits, potential pitfalls, and practical application in various trading scenarios.
Overview of the Supertrend Advance Pullback Strategy:
At its core, the Supertrend Advance Strategy is an evolution of the popular Supertrend Indicator. Designed to generate buy and sell signals in trending markets, the Supertrend Indicator has been a favorite tool for many traders around the world. The Advance Strategy, however, builds upon this foundation by introducing enhanced mechanisms, filters, and methodologies to increase precision and reduce false signals.
1. Basic Concept:
The Supertrend Advance Strategy relies on a combination of price action and volatility to determine the potential trend direction. By assessing the average true range (ATR) in conjunction with specific price points, this strategy aims to highlight the potential starting and ending points of market trends.
2. Methodology:
Unlike the traditional Supertrend Indicator, which primarily focuses on closing prices and ATR, the Advance Strategy integrates other critical market variables, such as volume, momentum oscillators, and perhaps even fundamental data, to validate its signals. This multidimensional approach ensures that the generated signals are more reliable and are less prone to market noise.
3. Benefits:
One of the main benefits of the Supertrend Advance Strategy is its ability to filter out false breakouts and minor price fluctuations, which can often lead to premature exits or entries in the market. By waiting for a confluence of factors to align, traders using this advanced strategy can increase their chances of entering or exiting trades at optimal points.
4. Practical Applications:
The Supertrend Advance Strategy can be applied across various timeframes, from intraday trading to swing trading and even long-term investment scenarios. Furthermore, its flexible nature allows it to be tailored to different asset classes, be it stocks, commodities, forex, or cryptocurrencies.
In the subsequent sections of this handbook, we will delve deeper into the intricacies of this strategy, offering step-by-step guidelines on its application, case studies, and tips for maximizing its efficacy in the volatile world of trading.
As you journey through this handbook, we encourage you to approach the Supertrend Advance Strategy with an open mind, testing and tweaking it as per your personal trading style and risk appetite. The ultimate goal is not just to provide you with a new tool but to empower you with a holistic strategy that can enhance your trading endeavors.
2. Getting Started
Navigating the financial markets can be a daunting task without the right tools. This section is dedicated to helping you set up the Supertrend Advance Strategy on one of the most popular charting platforms, TradingView. By following the steps below, you'll be able to integrate this strategy into your charts and start leveraging its insights in no time.
Setting up on TradingView:
TradingView is a web-based platform that offers a wide range of charting tools, social networking, and market data. Before you can apply the Supertrend Advance Strategy, you'll first need a TradingView account. If you haven't set one up yet, here's how:
1. Account Creation:
• Visit TradingView's official website.
• Click on the "Join for free" or "Sign up" button.
• Follow the registration process, providing the necessary details and setting up your login credentials.
2. Navigating the Dashboard:
• Once logged in, you'll be taken to your dashboard. Here, you'll see a variety of tools, including watchlists, alerts, and the main charting window.
• To begin charting, type in the name or ticker of the asset you're interested in the search bar at the top.
3. Configuring Chart Settings:
• Before integrating the Supertrend Advance Strategy, familiarize yourself with the chart settings. This can be accessed by clicking the 'gear' icon on the top right of the chart window.
• Adjust the chart type, time intervals, and other display settings to your preference.
Integrating the Strategy into a Chart:
Now that you're set up on TradingView, it's time to integrate the Supertrend Advance Strategy.
1. Accessing the Pine Script Editor:
• Located at the top-center of your screen, you'll find the "Pine Editor" tab. Click on it.
• This is where custom strategies and indicators are scripted or imported.
2. Loading the Supertrend Advance Strategy Script:
• Depending on whether you have the script or need to find it, there are two paths:
• If you have the script: Copy the Supertrend Advance Strategy script, and then paste it into the Pine Editor.
• If searching for the script: Click on the “Indicators” icon (looks like a flame) at the top of your screen, and then type “Supertrend Advance Strategy” in the search bar. If available, it will show up in the list. Simply click to add it to your chart.
3. Applying the Strategy:
• After pasting or selecting the Supertrend Advance Strategy in the Pine Editor, click on the “Add to Chart” button located at the top of the editor. This will overlay the strategy onto your main chart window.
4. Configuring Strategy Settings:
• Once the strategy is on your chart, you'll notice a small settings ('gear') icon next to its name in the top-left of the chart window. Click on this to access settings.
• Here, you can adjust various parameters of the Supertrend Advance Strategy to better fit your trading style or the specific asset you're analyzing.
5. Interpreting Signals:
• With the strategy applied, you'll now see buy/sell signals represented on your chart. Take time to familiarize yourself with how these look and behave over various timeframes and market conditions.
3. Strategy Overview
What is the Supertrend Advance Strategy?
The Supertrend Advance Strategy is a refined version of the classic Supertrend Indicator, which was developed to aid traders in spotting market trends. The strategy utilizes a combination of data points, including average true range (ATR) and price momentum, to generate buy and sell signals.
In essence, the Supertrend Advance Strategy can be visualized as a line that moves with the price. When the price is above the Supertrend line, it indicates an uptrend and suggests a potential buy position. Conversely, when the price is below the Supertrend line, it hints at a downtrend, suggesting a potential selling point.
Strategy Goals and Objectives:
1. Trend Identification: At the core of the Supertrend Advance Strategy is the goal to efficiently and consistently identify prevailing market trends. By recognizing these trends, traders can position themselves to capitalize on price movements in their favor.
2. Reducing Noise: Financial markets are often inundated with 'noise' - short-term price fluctuations that can mislead traders. The Supertrend Advance Strategy aims to filter out this noise, allowing for clearer decision-making.
3. Enhancing Risk Management: With clear buy and sell signals, traders can set more precise stop-loss and take-profit points. This leads to better risk management and potentially improved profitability.
4. Versatility: While primarily used for trend identification, the strategy can be integrated with other technical tools and indicators to create a comprehensive trading system.
Type of Assets/Markets to Apply the Strategy:
1. Equities: The Supertrend Advance Strategy is highly popular among stock traders. Its ability to capture long-term trends makes it particularly useful for those trading individual stocks or equity indices.
2. Forex: Given the 24-hour nature of the Forex market and its propensity for trends, the Supertrend Advance Strategy is a valuable tool for currency traders.
3. Commodities: Whether it's gold, oil, or agricultural products, commodities often move in extended trends. The strategy can help in identifying and capitalizing on these movements.
4. Cryptocurrencies: The volatile nature of cryptocurrencies means they can have pronounced trends. The Supertrend Advance Strategy can aid crypto traders in navigating these often tumultuous waters.
5. Futures & Options: Traders and investors in derivative markets can utilize the strategy to make more informed decisions about contract entries and exits.
It's important to note that while the Supertrend Advance Strategy can be applied across various assets and markets, its effectiveness might vary based on market conditions, timeframe, and the specific characteristics of the asset in question. As always, it's recommended to use the strategy in conjunction with other analytical tools and to backtest its effectiveness in specific scenarios before committing to trades.
4. Input Settings
Understanding and correctly configuring input settings is crucial for optimizing the Supertrend Advance Strategy for any specific market or asset. These settings, when tweaked correctly, can drastically impact the strategy's performance.
Grouping Inputs:
Before diving into individual input settings, it's important to group similar inputs. Grouping can simplify the user interface, making it easier to adjust settings related to a specific function or indicator.
Strategy Choice:
This input allows traders to select from various strategies that incorporate the Supertrend indicator. Options might include "Supertrend with RSI," "Supertrend with MACD," etc. By choosing a strategy, the associated input settings for that strategy become available.
Supertrend Settings:
1. Multiplier: Typically, a default value of 3 is used. This multiplier is used in the ATR calculation. Increasing it makes the Supertrend line further from prices, while decreasing it brings the line closer.
2. Period: The number of bars used in the ATR calculation. A common default is 7.
EMA Settings (Exponential Moving Average):
1. Period: Defines the number of previous bars used to calculate the EMA. Common periods are 9, 21, 50, and 200.
2. Source: Allows traders to choose which price (Open, Close, High, Low) to use in the EMA calculation.
RSI Settings (Relative Strength Index):
1. Length: Determines how many periods are used for RSI calculation. The standard setting is 14.
2. Overbought Level: The threshold at which the asset is considered overbought, typically set at 70.
3. Oversold Level: The threshold at which the asset is considered oversold, often at 30.
MACD Settings (Moving Average Convergence Divergence):
1. Short Period: The shorter EMA, usually set to 12.
2. Long Period: The longer EMA, commonly set to 26.
3. Signal Period: Defines the EMA of the MACD line, typically set at 9.
CCI Settings (Commodity Channel Index):
1. Period: The number of bars used in the CCI calculation, often set to 20.
2. Overbought Level: Typically set at +100, denoting overbought conditions.
3. Oversold Level: Usually set at -100, indicating oversold conditions.
SL/TP Settings (Stop Loss/Take Profit):
1. SL Multiplier: Defines the multiplier for the average true range (ATR) to set the stop loss.
2. TP Multiplier: Defines the multiplier for the average true range (ATR) to set the take profit.
Filtering Conditions:
This section allows traders to set conditions to filter out certain signals. For example, one might only want to take buy signals when the RSI is below 30, ensuring they buy during oversold conditions.
Trade Direction and Backtest Period:
1. Trade Direction: Allows traders to specify whether they want to take long trades, short trades, or both.
2. Backtest Period: Specifies the time range for backtesting the strategy. Traders can choose from options like 'Last 6 months,' 'Last 1 year,' etc.
It's essential to remember that while default settings are provided for many of these tools, optimal settings can vary based on the market, timeframe, and trading style. Always backtest new settings on historical data to gauge their potential efficacy.
5. Understanding Strategy Conditions
Developing an understanding of the conditions set within a trading strategy is essential for traders to maximize its potential. Here, we delve deep into the logic behind these conditions, using the Supertrend Advance Strategy as our focal point.
Basic Logic Behind Conditions:
Every strategy is built around a set of conditions that provide buy or sell signals. The conditions are based on mathematical or statistical methods and are rooted in the study of historical price data. The fundamental idea is to recognize patterns or behaviors that have been profitable in the past and might be profitable in the future.
Buy and Sell Conditions:
1. Buy Conditions: Usually formulated around bullish signals or indicators suggesting upward price momentum.
2. Sell Conditions: Centered on bearish signals or indicators indicating downward price momentum.
Simple Strategy:
The simple strategy could involve using just the Supertrend indicator. Here:
• Buy: When price closes above the Supertrend line.
• Sell: When price closes below the Supertrend line.
Pullback Strategy:
This strategy capitalizes on price retracements:
• Buy: When the price retraces to the Supertrend line after a bullish signal and is supported by another bullish indicator.
• Sell: When the price retraces to the Supertrend line after a bearish signal and is confirmed by another bearish indicator.
Indicators Used:
EMA (Exponential Moving Average):
• Logic: EMA gives more weight to recent prices, making it more responsive to current price movements. A shorter-period EMA crossing above a longer-period EMA can be a bullish sign, while the opposite is bearish.
RSI (Relative Strength Index):
• Logic: RSI measures the magnitude of recent price changes to analyze overbought or oversold conditions. Values above 70 are typically considered overbought, and values below 30 are considered oversold.
MACD (Moving Average Convergence Divergence):
• Logic: MACD assesses the relationship between two EMAs of a security’s price. The MACD line crossing above the signal line can be a bullish signal, while crossing below can be bearish.
CCI (Commodity Channel Index):
• Logic: CCI compares a security's average price change with its average price variation. A CCI value above +100 may mean the price is overbought, while below -100 might signify an oversold condition.
And others...
As the strategy expands or contracts, more indicators might be added or removed. The crucial point is to understand the core logic behind each, ensuring they align with the strategy's objectives.
Logic Behind Each Indicator:
1. EMA: Emphasizes recent price movements; provides dynamic support and resistance levels.
2. RSI: Indicates overbought and oversold conditions based on recent price changes.
3. MACD: Showcases momentum and direction of a trend by comparing two EMAs.
4. CCI: Measures the difference between a security's price change and its average price change.
Understanding strategy conditions is not just about knowing when to buy or sell but also about comprehending the underlying market dynamics that those conditions represent. As you familiarize yourself with each condition and indicator, you'll be better prepared to adapt and evolve with the ever-changing financial markets.
6. Trade Execution and Management
Trade execution and management are crucial aspects of any trading strategy. Efficient execution can significantly impact profitability, while effective management can preserve capital during adverse market conditions. In this section, we'll explore the nuances of position entry, exit strategies, and various Stop Loss (SL) and Take Profit (TP) methodologies within the Supertrend Advance Strategy.
Position Entry:
Effective trade entry revolves around:
1. Timing: Enter at a point where the risk-reward ratio is favorable. This often corresponds to confirmatory signals from multiple indicators.
2. Volume Analysis: Ensure there's adequate volume to support the movement. Volume can validate the strength of a signal.
3. Confirmation: Use multiple indicators or chart patterns to confirm the entry point. For instance, a buy signal from the Supertrend indicator can be confirmed with a bullish MACD crossover.
Position Exit Strategies:
A successful exit strategy will lock in profits and minimize losses. Here are some strategies:
1. Fixed Time Exit: Exiting after a predetermined period.
2. Percentage-based Profit Target: Exiting after a certain percentage gain.
3. Indicator-based Exit: Exiting when an indicator gives an opposing signal.
Percentage-based SL/TP:
• Stop Loss (SL): Set a fixed percentage below the entry price to limit potential losses.
• Example: A 2% SL on an entry at $100 would trigger a sell at $98.
• Take Profit (TP): Set a fixed percentage above the entry price to lock in gains.
• Example: A 5% TP on an entry at $100 would trigger a sell at $105.
Supertrend-based SL/TP:
• Stop Loss (SL): Position the SL at the Supertrend line. If the price breaches this line, it could indicate a trend reversal.
• Take Profit (TP): One could set the TP at a point where the Supertrend line flattens or turns, indicating a possible slowdown in momentum.
Swing high/low-based SL/TP:
• Stop Loss (SL): For a long position, set the SL just below the recent swing low. For a short position, set it just above the recent swing high.
• Take Profit (TP): For a long position, set the TP near a recent swing high or resistance. For a short position, near a swing low or support.
And other methods...
1. Trailing Stop Loss: This dynamic SL adjusts with the price movement, locking in profits as the trade moves in your favor.
2. Multiple Take Profits: Divide the position into segments and set multiple TP levels, securing profits in stages.
3. Opposite Signal Exit: Exit when another reliable indicator gives an opposite signal.
Trade execution and management are as much an art as they are a science. They require a blend of analytical skill, discipline, and intuition. Regularly reviewing and refining your strategies, especially in light of changing market conditions, is crucial to maintaining consistent trading performance.
7. Visual Representations
Visual tools are essential for traders, as they simplify complex data into an easily interpretable format. Properly analyzing and understanding the plots on a chart can provide actionable insights and a more intuitive grasp of market conditions. In this section, we’ll delve into various visual representations used in the Supertrend Advance Strategy and their significance.
Understanding Plots on the Chart:
Charts are the primary visual aids for traders. The arrangement of data points, lines, and colors on them tell a story about the market's past, present, and potential future moves.
1. Data Points: These represent individual price actions over a specific timeframe. For instance, a daily chart will have data points showing the opening, closing, high, and low prices for each day.
2. Colors: Used to indicate the nature of price movement. Commonly, green is used for bullish (upward) moves and red for bearish (downward) moves.
Trend Lines:
Trend lines are straight lines drawn on a chart that connect a series of price points. Their significance:
1. Uptrend Line: Drawn along the lows, representing support. A break below might indicate a trend reversal.
2. Downtrend Line: Drawn along the highs, indicating resistance. A break above might suggest the start of a bullish trend.
Filled Areas:
These represent a range between two values on a chart, usually shaded or colored. For instance:
1. Bollinger Bands: The area between the upper and lower band is filled, giving a visual representation of volatility.
2. Volume Profile: Can show a filled area representing the amount of trading activity at different price levels.
Stop Loss and Take Profit Lines:
These are horizontal lines representing pre-determined exit points for trades.
1. Stop Loss Line: Indicates the level at which a trade will be automatically closed to limit losses. Positioned according to the trader's risk tolerance.
2. Take Profit Line: Denotes the target level to lock in profits. Set according to potential resistance (for long trades) or support (for short trades) or other technical factors.
Trailing Stop Lines:
A trailing stop is a dynamic form of stop loss that moves with the price. On a chart:
1. For Long Trades: Starts below the entry price and moves up with the price but remains static if the price falls, ensuring profits are locked in.
2. For Short Trades: Starts above the entry price and moves down with the price but remains static if the price rises.
Visual representations offer traders a clear, organized view of market dynamics. Familiarity with these tools ensures that traders can quickly and accurately interpret chart data, leading to more informed decision-making. Always ensure that the visual aids used resonate with your trading style and strategy for the best results.
8. Backtesting
Backtesting is a fundamental process in strategy development, enabling traders to evaluate the efficacy of their strategy using historical data. It provides a snapshot of how the strategy would have performed in past market conditions, offering insights into its potential strengths and vulnerabilities. In this section, we'll explore the intricacies of setting up and analyzing backtest results and the caveats one must be aware of.
Setting Up Backtest Period:
1. Duration: Determine the timeframe for the backtest. It should be long enough to capture various market conditions (bullish, bearish, sideways). For instance, if you're testing a daily strategy, consider a period of several years.
2. Data Quality: Ensure the data source is reliable, offering high-resolution and clean data. This is vital to get accurate backtest results.
3. Segmentation: Instead of a continuous period, sometimes it's helpful to backtest over distinct market phases, like a particular bear or bull market, to see how the strategy holds up in different environments.
Analyzing Backtest Results:
1. Performance Metrics: Examine metrics like the total return, annualized return, maximum drawdown, Sharpe ratio, and others to gauge the strategy's efficiency.
2. Win Rate: It's the ratio of winning trades to total trades. A high win rate doesn't always signify a good strategy; it should be evaluated in conjunction with other metrics.
3. Risk/Reward: Understand the average profit versus the average loss per trade. A strategy might have a low win rate but still be profitable if the average gain far exceeds the average loss.
4. Drawdown Analysis: Review the periods of losses the strategy could incur and how long it takes, on average, to recover.
9. Tips and Best Practices
Successful trading requires more than just knowing how a strategy works. It necessitates an understanding of when to apply it, how to adjust it to varying market conditions, and the wisdom to recognize and avoid common pitfalls. This section offers insightful tips and best practices to enhance the application of the Supertrend Advance Strategy.
When to Use the Strategy:
1. Market Conditions: Ideally, employ the Supertrend Advance Strategy during trending market conditions. This strategy thrives when there are clear upward or downward trends. It might be less effective during consolidative or sideways markets.
2. News Events: Be cautious around significant news events, as they can cause extreme volatility. It might be wise to avoid trading immediately before and after high-impact news.
3. Liquidity: Ensure you are trading in assets/markets with sufficient liquidity. High liquidity ensures that the price movements are more reflective of genuine market sentiment and not due to thin volume.
Adjusting Settings for Different Markets/Timeframes:
1. Markets: Each market (stocks, forex, commodities) has its own characteristics. It's essential to adjust the strategy's parameters to align with the market's volatility and liquidity.
2. Timeframes: Shorter timeframes (like 1-minute or 5-minute charts) tend to have more noise. You might need to adjust the settings to filter out false signals. Conversely, for longer timeframes (like daily or weekly charts), you might need to be more responsive to genuine trend changes.
3. Customization: Regularly review and tweak the strategy's settings. Periodic adjustments can ensure the strategy remains optimized for the current market conditions.
10. Frequently Asked Questions (FAQs)
Given the complexities and nuances of the Supertrend Advance Strategy, it's only natural for traders, both new and seasoned, to have questions. This section addresses some of the most commonly asked questions regarding the strategy.
1. What exactly is the Supertrend Advance Strategy?
The Supertrend Advance Strategy is an evolved version of the traditional Supertrend indicator. It's designed to provide clearer buy and sell signals by incorporating additional indicators like EMA, RSI, MACD, CCI, etc. The strategy aims to capitalize on market trends while minimizing false signals.
2. Can I use the Supertrend Advance Strategy for all asset types?
Yes, the strategy can be applied to various asset types like stocks, forex, commodities, and cryptocurrencies. However, it's crucial to adjust the settings accordingly to suit the specific characteristics and volatility of each asset type.
3. Is this strategy suitable for day trading?
Absolutely! The Supertrend Advance Strategy can be adjusted to suit various timeframes, making it versatile for both day trading and long-term trading. Remember to fine-tune the settings to align with the timeframe you're trading on.
4. How do I deal with false signals?
No strategy is immune to false signals. However, by combining the Supertrend with other indicators and adhering to strict risk management protocols, you can minimize the impact of false signals. Always use stop-loss orders and consider filtering trades with additional confirmation signals.
5. Do I need any prior trading experience to use this strategy?
While the Supertrend Advance Strategy is designed to be user-friendly, having a foundational understanding of trading and market analysis can greatly enhance your ability to employ the strategy effectively. If you're a beginner, consider pairing the strategy with further education and practice on demo accounts.
6. How often should I review and adjust the strategy settings?
There's no one-size-fits-all answer. Some traders adjust settings weekly, while others might do it monthly. The key is to remain responsive to changing market conditions. Regular backtesting can give insights into potential required adjustments.
7. Can the Supertrend Advance Strategy be automated?
Yes, many traders use algorithmic trading platforms to automate their strategies, including the Supertrend Advance Strategy. However, always monitor automated systems regularly to ensure they're operating as intended.
8. Are there any markets or conditions where the strategy shouldn't be used?
The strategy might generate more false signals in markets that are consolidative or range-bound. During significant news events or times of unexpected high volatility, it's advisable to tread with caution or stay out of the market.
9. How important is backtesting with this strategy?
Backtesting is crucial as it allows traders to understand how the strategy would have performed in the past, offering insights into potential profitability and areas of improvement. Always backtest any new setting or tweak before applying it to live trades.
10. What if the strategy isn't working for me?
No strategy guarantees consistent profits. If it's not working for you, consider reviewing your settings, seeking expert advice, or complementing the Supertrend Advance Strategy with other analysis methods. Remember, continuous learning and adaptation are the keys to trading success.
Other comments
Value of combining several indicators in this script and how they work together
Diversification of Signals: Just as diversifying an investment portfolio can reduce risk, using multiple indicators can offer varied perspectives on potential price movements. Each indicator can capture a different facet of the market, ensuring that traders are not overly reliant on a single data point.
Confirmation & Reduced False Signals: A common challenge with many indicators is the potential for false signals. By requiring confirmation from multiple indicators before acting, the chances of acting on a false signal can be significantly reduced.
Flexibility Across Market Conditions: Different indicators might perform better under different market conditions. For example, while moving averages might excel in trending markets, oscillators like RSI might be more useful during sideways or range-bound conditions. A mashup strategy can potentially adapt better to varying market scenarios.
Comprehensive Analysis: With multiple indicators, traders can gauge trend strength, momentum, volatility, and potential market reversals all at once, providing a holistic view of the market.
How do the different indicators in the Supertrend Advance Strategy work together?
Supertrend: This is primarily a trend-following indicator. It provides traders with buy and sell signals based on the volatility of the price. When combined with other indicators, it can filter out noise and give more weight to strong, confirmed trends.
EMA (Exponential Moving Average): EMA gives more weight to recent price data. It can be used to identify the direction and strength of a trend. When the price is above the EMA, it's generally considered bullish, and vice versa.
RSI (Relative Strength Index): An oscillator that measures the magnitude of recent price changes to evaluate overbought or oversold conditions. By cross-referencing with other indicators like EMA or MACD, traders can spot potential reversals or confirmations of a trend.
MACD (Moving Average Convergence Divergence): This indicator identifies changes in the strength, direction, momentum, and duration of a trend in a stock's price. When the MACD line crosses above the signal line, it can be a bullish sign, and when it crosses below, it can be bearish. Pairing MACD with Supertrend can provide dual confirmation of a trend.
CCI (Commodity Channel Index): Initially developed for commodities, CCI can indicate overbought or oversold conditions. It can be used in conjunction with other indicators to determine entry and exit points.
In essence, the synergy of these indicators provides a balanced, comprehensive approach to trading. Each indicator offers its unique lens into market conditions, and when they align, it can be a powerful indication of a trading opportunity. This combination not only reduces the potential drawbacks of each individual indicator but leverages their strengths, aiming for more consistent and informed trading decisions.
Backtesting and Default Settings
• This indicator has been optimized to be applied for 1 hour-charts. However, the underlying principles of this strategy are supply and demand in the financial markets and the strategy can be applied to all timeframes. Daytraders can use the 1min- or 5min charts, swing-traders can use the daily charts.
• This strategy has been designed to identify the most promising, highest probability entries and trades for each stock or other financial security.
• The combination of the qualifiers results in a highly selective strategy which only considers the most promising swing-trading entries. As a result, you will normally only find a low number of trades for each stock or other financial security per year in case you apply this strategy for the daily charts. Shorter timeframes will result in a higher number of trades / year.
• Consequently, traders need to apply this strategy for a full watchlist rather than just one financial security.
• Default properties: RSI on (length 14, RSI buy level 50, sell level 50), EMA, RSI, MACD on, type of strategy pullback, SL/TP type: ATR (length 10, factor 3), trade direction both, quantity 5, take profit swing hl 5.1, highest / lowest lookback 2, enable ATR trail (ATR length 10, SL ATR multiplier 1.4, TP multiplier 2.1, lookback = 4, trade direction = both).

Ahsan Tufail Precise MA Crossover Filter for Reliable SignalsIntroduction:
In the ever-evolving world of Forex trading, strategies that provide a competitive edge are highly sought after. The Moving Average (MA) crossover technique is a popular long-term approach, but its vulnerability to false signals can lead to potential losses. To overcome this challenge, we introduce a game-changing MA crossover filter designed to weed out false signals and unlock the full potential of this strategy. In this article, we delve into the mechanics of this filter, providing a comprehensive analysis of its components and how it enhances the accuracy of buy and sell signals.
The Power of the MA Crossover Filter:
The essence of our MA crossover filter lies in the integration of a specialized indicator that operates on a scale of 0 to 100. This ingenious indicator dynamically measures the distance between the middle Bollinger band and either the upper or lower Bollinger band. By analyzing the values of the last 504 candlesticks, it maps the range from 50 to 100 for the largest and smallest distances between the middle and upper Bollinger bands. Similarly, for values ranging from 0 to 50, it measures the distance between the middle and lower Bollinger bands.
Unveiling the Signal Execution Process:
The brilliance of this filter is revealed in its meticulous execution of buy and sell signals, which significantly reduces false crossovers. Let's explore the process step-by-step:
Buy Signal Precision:
To initiate a buy signal, the price must be positioned above the 200-period Simple Moving Average (SMA).
The filter validates the crossover by checking the indicator's value, ensuring it falls below the threshold of 25.
Sell Signal Accuracy:
For a sell signal, the price must be below the 200-period Simple Moving Average (SMA).
The filter confirms the crossover by verifying the indicator's value, which should exceed the threshold of 75.
This selective approach ensures that only high-confidence crossovers are considered, maximizing the potential for profitable trades.
Fine-Tuning the Filter for Optimal Performance:
While the MA crossover filter exhibits its prowess in GBPUSD and EURUSD currency pairs, it may require adjustments for other pairs. Currency pairs possess unique characteristics, and adapting the filter to specific behavior is crucial for its success.
To fine-tune the filter for alternative currency pairs, traders should conduct rigorous backtesting and analyze historical price data. By experimenting with indicator threshold values, traders can calibrate the filter to accurately match the dynamics of the target currency pair. This iterative process allows for customization, ultimately resulting in a finely-tuned filter that aligns with the unique behavior of the selected market.
Conclusion:
The MA crossover filter represents a paradigm shift in long-term Forex trading strategies. By intelligently filtering false signals, this precision tool unleashes the true potential of the MA crossover technique, elevating its profitability and enhancing overall trading performance. While no strategy guarantees absolute success, incorporating this filter empowers traders with a heightened level of confidence in their buy and sell signals. Embracing the power of this innovative filter can be a transformative step towards mastering Forex profits and staying ahead in the dynamic world of currency trading.

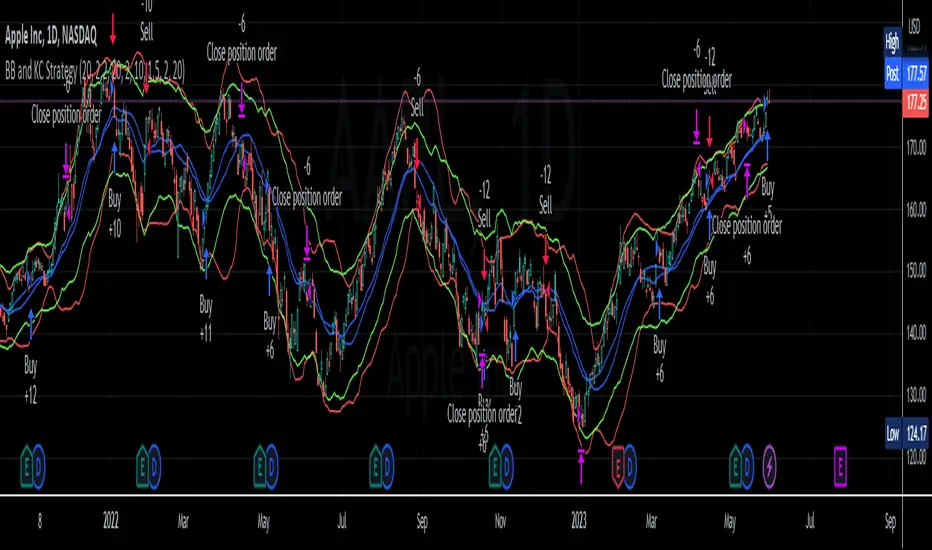
BB and KC StrategyThis script is designed as a TradingView strategy that uses Bollinger Bands (BB) and Keltner Channels (KC) as the primary indicators for generating trade signals. It aims to catch potential market trends by comparing the movements of these two popular volatility measures.
Key aspects of this strategy:
1. **Bollinger Bands and Keltner Channels:** Both are volatility-based indicators. The Bollinger Bands consist of a middle band (simple moving average) and two outer bands calculated based on standard deviation, which adjusts itself to market conditions. Keltner Channels are a set of bands placed above and below an exponential moving average of the price. The distance between the bands is calculated based on the Average True Range (ATR), a measure of price volatility.
2. **Entry Signals:** The strategy enters a long position when the upper KC line crosses above the upper BB line and the volume is above its moving average. Conversely, it enters a short position when the lower KC line crosses below the lower BB line and the volume is above its moving average.
3. **Exit Signals:** The strategy exits a position under two conditions. First, if the trade has been open for a certain number of bars defined by the user (default 20 bars). Second, a stop loss and trailing stop are in place to limit potential losses and lock in profits as the price moves favorably. The stop loss is set at a percentage of the entry price (default 1.5% for long and -1.5% for short), and the trailing stop is also a percentage of the entry price (default 2%).
4. **Trade Quantity:** The script allows specifying the investment amount for each trade, set to a default of 1000 currency units.
Remember, this is a strategy script, which means it is used for backtesting and not for real-time signals or live trading. It is also recommended that it is used as a tool to aid your trading, not as a standalone system. As with any strategy, it should be tested over different market conditions and used in conjunction with other aspects of technical and fundamental analysis to ensure robustness and effectiveness.
Flying Dragon Trend StrategyFlying Dragon Trend Strategy can be used to indicate the trend on all timeframes by finetuning the input settings.
The Flying Dragon Trend family includes both the strategy and the indicator, where the strategy supports of selecting the optimal set of inputs for the indicator in each scenario. Highly recommended to get familiar with the strategy first to get the best out of the indicator.
Flying Dragon Trend plots the trend bands into the ribbon, where the colours indicate the trend of each band. The plotting of the bands can be turned off in the input settings. Based on the user selectable Risk Level the strategy is executed when the price crosses the certain moving average line, or at the Lowest risk level all the bands have the same colour.
The main idea is to combine two different moving averages to cross each other at the possible trend pivot point, but trying to avoid any short term bounces to affect the trend indication. The ingenuity resides in the combination of selected moving average types, lengths and especially the offsets. The trend bands give visual hint for the user while observing the price interaction with the bands, one could say that when "the Dragon swallows the candles the jaws wide open", then there is high possibility for the pivot. The leading moving average should be fast while the lagging moving average should be, well, lagging behind the leading one. There is Offset selections for each moving average, three for leading one and one for the lagging one, those are where the magic happens. After user has selected preferred moving average types and lengths, by tuning each offset the optimal sweet spot for each timeframe and equity will be found. The default values are good enough starting points for longer (4h and up) timeframes, but shorter timeframes (minutes to hours) require different combination of settings, some hints are provided in tooltips. Basically the slower the "leading" moving average (like HMA75 or HMA115) and quicker the "lagging" moving average (like SMA12 or SMA5) become, the better performance at the Lowest risk level on minute scales. This "reversed" approach at the minute scales is shown also as reversed colour for the "lagging" moving average trend band, which seems to make it work surprisingly well.
The Flying Dragon Trend does not necessarily work well on zig zag and range bounce scenarios without additional finetuning of the input settings to fit the current condition.
Strategy direction selector by DashTrader.

Smart Fib StrategySmart Fibonacci Strategy
This advanced trading strategy combines the power of adaptive SMA entries with Fibonacci-based exit levels to create a comprehensive trend-following system that self-optimizes based on historical market conditions. Credit goes to Julien_Eche who created the "Best SMA Finder" which received an Editors Pick award.
Strategy Overview
The Smart Fibonacci Strategy employs a two-pronged approach to trading:
1. Intelligent Entries: Uses a self-optimizing SMA (Simple Moving Average) to identify optimal entry points. The system automatically tests multiple SMA lengths against historical data to determine which period provides the most robust trading signals.
2. Fibonacci-Based Exits: Implements ATR-adjusted Fibonacci bands to establish precise exit targets, with risk-management options ranging from conservative to aggressive.
This dual methodology creates a balanced system that adapts to changing market conditions while providing clear visual reference points for trade management.
Key Features
- **Self-Optimizing Entries**: Automatically calculates the most profitable SMA length based on historical performance
- **Adjustable Risk Parameters**: Choose between low-risk and high-risk exit targets
- **Directional Flexibility**: Trade long-only, short-only, or both directions
- **Visualization Tools**: Customizable display of entry lines and exit bands
- **Performance Statistics**: Comprehensive stats table showing key metrics
- **Smoothing Option**: Reduces noise in the Fibonacci bands for cleaner signals
Trading Rules
Entry Signals
- **Long Entry**: When price crosses above the blue center line (optimal SMA)
- **Short Entry**: When price crosses below the blue center line (optimal SMA)
### Exit Levels
- **Low Risk Option**: Exit at the first Fibonacci band (1.618 * ATR)
- **High Risk Option**: Exit at the second Fibonacci band (2.618 * ATR)
Strategy Parameters
Display Settings
- Toggle visibility of the stats table and indicator components
Strategy Settings
- Select trading direction (long, short, or both)
- Choose exit method (low risk or high risk)
- Set minimum trades threshold for SMA optimization
SMA Settings
- Option to use auto-optimized or fixed-length SMA
- Customize SMA length when using fixed option
Fibonacci Settings
- Adjust ATR period and SMA basis for Fibonacci bands
- Enable/disable smoothing function
- Customize Fibonacci ratio multipliers
Appearance Settings
- Modify colors, line widths, and transparency
Optimization Methodology
The strategy employs a sophisticated optimization algorithm that:
1. Tests multiple SMA lengths against historical data
2. Evaluates performance based on trade count, profit factor, and win rate
3. Calculates a "robustness score" that balances profitability with statistical significance
4. Selects the SMA length with the highest robustness score
This ensures that the strategy's entry signals are continuously adapting to the most effective parameters for current market conditions.
Risk Management
Position sizing is fixed at $2,000 per trade, allowing for consistent exposure across all trading setups. The Fibonacci-based exit system provides two distinct risk management approaches:
- **Conservative Approach**: Using the first Fibonacci band for exits produces more frequent but smaller wins
- **Aggressive Approach**: Using the second Fibonacci band allows for larger potential gains at the cost of increased volatility
Ideal Usage
This strategy is best suited for:
- Trending markets with clear directional moves
- Timeframes from 4H to Daily for most balanced results
- Instruments with moderate volatility (stocks, forex, commodities)
Traders can further enhance performance by combining this strategy with broader market analysis to confirm the prevailing trend direction.

External Signals Strategy Tester v5External Signals Strategy Tester v5 – User Guide (English)
1. Purpose
This Pine Script strategy is a universal back‑tester that lets you plug in any external buy/sell series (for example, another indicator, webhook feed, or higher‑time‑frame condition) and evaluate a rich set of money‑management rules around it – with a single click on/off workflow for every module.
2. Core Workflow
Feed signals
Buy Signal / Sell Signal inputs accept any series (price, boolean, output of request.security(), etc.).
A crossover above 0 is treated as “signal fired”.
Date filter
Start Date / End Date restricts the test window so you can exclude unwanted history.
Trade engine
Optional Long / Short enable toggles.
Choose whether opposite signals simply close the trade or reverse it (flip direction in one transaction).
Risk modules – all opt‑in via check‑boxes
Classic % block – fixed % Take‑Profit / Stop‑Loss / Break‑Even.
Fibonacci Bollinger Bands (FBB) module
Draws dynamic VWMA/HMA/SMA/EMA/DEMA/TEMA mid‑line with ATR‑scaled Fibonacci envelopes.
Every line can be used for stops, trailing, or multi‑target exits.
Separate LONG and SHORT sub‑modules
Each has its own SL plus three Take‑Profits (TP1‑TP3).
Per TP you set line, position‑percentage to close, and an optional trailing flag.
Executed TP/SLs deactivate themselves so they cannot refire.
Trailing behaviour
If Trail is checked, the selected line is re‑evaluated once per bar; the order is amended via strategy.exit().
3. Inputs Overview
Group Parameter Notes
Trade Settings Enable Long / Enable Short Master switches
Close on Opposite / Reverse Position How to react to a counter‑signal
Risk % Use TP / SL / BE + their % Traditional fixed‑distance management
Fibo Bands FIBO LEVELS ENABLE + visual style/length Turn indicator overlay on/off
FBB LONG SL / TP1‑TP3 Enable, Line, %, Trail Rules applied only while a long is open
FBB SHORT SL / TP1‑TP3 Enable, Line, %, Trail Rules applied only while a short is open
Line choices: Basis, 0.236, 0.382, 0.5, 0.618, 0.764, 1.0 – long rules use lower bands, short rules use upper bands automatically.
4. Algorithm Details
Position open
On the very first bar after entry, the script checks the direction and activates the corresponding LONG or SHORT module, deactivating the other.
Order management loop (every bar)
FBB Stop‑Loss: placed/updated at chosen band; if trailing, follows the new value.
TP1‑TP3: each active target updates its limit price to the selected band (or holds static if trailing is off).
The classic % block runs in parallel; its exits have priority because they call strategy.close_all().
Exit handling
When any strategy.exit() fires, the script reads exit_id and flips the *_Active flag so that order will not be recreated.
A Stop‑Loss (SL) also disables all remaining TPs for that leg.
5. Typical Use Cases
Scenario Suggested Setup
Scalping longs into VWAP‐reversion Enable LONG TP1 @ 0.382 (30 %), TP2 @ 0.618 (40 %), SL @ 0.236 + trailing
Fade shorts during news spikes Enable SHORT SL @ 1.0 (no trail) and SHORT TP1,2,3 on consecutive lowers with small size‑outs
Classic trend‑follow Use only classic % TP/SL block and disable FBB modules
6. Hints & Tips
Signal quality matters – this script manages exits, it does not generate entries.
Keep TV time zone in mind when picking start/end dates.
For portfolio‑style testing allocate smaller default_qty_value than 100 % or use strategy.percent_of_equity sizing.
You can combine FBB exits with fixed‑% ones for layered management.
7. Limitations / Safety
No pyramiding; the script holds max one position at a time.
All calculations are bar‑close; intra‑bar touches may differ from real‑time execution.
The indicator overlay is optional, so you can run visual‑clean tests by unchecking FIBO LEVELS ENABLE.

Nifty 50 5mint Strategy
The script defines a specific trading session based on user inputs. This session is specified by a time range (e.g., "1000-1510") and selected days of the week (e.g., Monday to Friday). This session definition is crucial for trading only during specific times.
Lookback and Breakout Conditions:
The script uses a lookback period and the highest high and lowest low values to determine potential breakout points. The lookback period is user-defined (default is 10 periods).
The script also uses Bollinger Bands (BB) to identify potential breakout conditions. Users can enable or disable BB crossover conditions. BB consists of an upper and lower band, with the basis.
Additionally, the script uses Dema (Double Exponential Moving Average) and VWAP (Volume Weighted Average Price) . Users can enable or disable this condition.
Buy and Sell Conditions:
Buy conditions are met when the close price exceeds the highest high within the specified lookback period, Bollinger Bands conditions are satisfied, Dema-VWAP conditions are met, and the script is within the defined trading session.
Sell conditions are met when the close price falls below the lowest low within the lookback period, Bollinger Bands conditions are satisfied, Dema-VWAP conditions are met, and the script is within the defined trading session.
When either condition is met, it triggers a "long" or "short" position entry.
Trailing Stop Loss (TSL):
Users can choose between fixed points ( SL by points ) or trailing stop (Profit Trail).
For fixed points, users specify the number of points for the stop loss. A fixed stop loss is set at a certain distance from the entry price if a position is opened.
For Profit Trail, users can enable or disable this feature. If enabled, the script uses a "trail factor" (lookback period) to determine when to adjust the stop loss.
If the price moves in the direction of the trade and reaches a certain level (determined by the trail factor), the stop loss is adjusted, trailing behind the price to lock in profits.
If the close price falls below a certain level (lowest low within the trail factor(lookback)), and a position is open, the "long" position is closed (strategy.close("long")).
If the close price exceeds a certain level (highest high within the specified trail factor(lookback)), and a position is open, the "short" position is closed (strategy.close("short")).
Positions are also closed if they are open outside of the defined trading session.
Background Color:
The script changes the background color of the chart to indicate buy (green) and sell (red) signals, making it visually clear when the strategy conditions are met.
In summary, this script implements a breakout trading strategy with various customizable conditions, including Bollinger Bands, Dema-VWAP crossovers, and session-specific rules. It also includes options for setting stop losses and trailing stop losses to manage risk and lock in profits. The "trail factor" helps adjust trailing stops dynamically based on recent price movements. Positions are closed under certain conditions to manage risk and ensure compliance with the defined trading session.
CE=Buy, CE_SL=stoploss_buy, tCsl=Trailing Stop_buy.
PE=sell, PE_SL= stoploss_sell, tpsl=Trailing Stop_sell.
Remember that trading involves inherent risks, and past performance is not indicative of future results. Exercise caution, manage risk diligently, and consider the advice of financial experts when using this script or any trading strategy.

Quantum Reversal# 🧠 Quantum Reversal
## **Quantitative Mean Reversion Framework**
This algorithmic trading system employs **statistical mean reversion theory** combined with **adaptive volatility modeling** to capitalize on Bitcoin's inherent price oscillations around its statistical mean. The strategy integrates multiple technical indicators through a **multi-layered signal processing architecture**.
---
## ⚡ **Core Technical Architecture**
### 📊 **Statistical Foundation**
- **Bollinger Band Mean Reversion Model**: Utilizes 20-period moving average with 2.2 standard deviation bands for volatility-adjusted entry signals
- **Adaptive Volatility Threshold**: Dynamic standard deviation multiplier accounts for Bitcoin's heteroscedastic volatility patterns
- **Price Action Confluence**: Entry triggered when price breaches lower volatility band, indicating statistical oversold conditions
### 🔬 **Momentum Analysis Layer**
- **RSI Oscillator Integration**: 14-period Relative Strength Index with modified oversold threshold at 45
- **Signal Smoothing Algorithm**: 5-period simple moving average applied to RSI reduces noise and false signals
- **Momentum Divergence Detection**: Captures mean reversion opportunities when momentum indicators show oversold readings
### ⚙️ **Entry Logic Architecture**
```
Entry Condition = (Price ≤ Lower_BB) OR (Smoothed_RSI < 45)
```
- **Dual-Condition Framework**: Either statistical price deviation OR momentum oversold condition triggers entry
- **Boolean Logic Gate**: OR-based entry system increases signal frequency while maintaining statistical validity
- **Position Sizing**: Fixed 10% equity allocation per trade for consistent risk exposure
### 🎯 **Exit Strategy Optimization**
- **Profit-Lock Mechanism**: Positions only closed when showing positive unrealized P&L
- **Trend Continuation Logic**: Allows winning trades to run until momentum exhaustion
- **Dynamic Exit Timing**: No fixed profit targets - exits based on profitability state rather than arbitrary levels
---
## 📈 **Statistical Properties**
### **Risk Management Framework**
- **Long-Only Exposure**: Eliminates short-squeeze risk inherent in cryptocurrency markets
- **Mean Reversion Bias**: Exploits Bitcoin's tendency to revert to statistical mean after extreme moves
- **Position Management**: Single position limit prevents over-leveraging
### **Signal Processing Characteristics**
- **Noise Reduction**: SMA smoothing on RSI eliminates high-frequency oscillations
- **Volatility Adaptation**: Bollinger Bands automatically adjust to changing market volatility
- **Multi-Timeframe Coherence**: Indicators operate on consistent timeframe for signal alignment
---
## 🔧 **Parameter Configuration**
| Technical Parameter | Value | Statistical Significance |
|-------------------|-------|-------------------------|
| Bollinger Period | 20 | Standard statistical lookback for volatility calculation |
| Std Dev Multiplier | 2.2 | Optimized for Bitcoin's volatility distribution (95.4% confidence interval) |
| RSI Period | 14 | Traditional momentum oscillator period |
| RSI Threshold | 45 | Modified oversold level accounting for Bitcoin's momentum characteristics |
| Smoothing Period | 5 | Noise reduction filter for momentum signals |
---
## 📊 **Algorithmic Advantages**
✅ **Statistical Edge**: Exploits documented mean reversion tendency in Bitcoin markets
✅ **Volatility Adaptation**: Dynamic bands adjust to changing market conditions
✅ **Signal Confluence**: Multiple indicator confirmation reduces false positives
✅ **Momentum Integration**: RSI smoothing improves signal quality and timing
✅ **Risk-Controlled Exposure**: Systematic position sizing and long-only bias
---
## 🔬 **Mathematical Foundation**
The strategy leverages **Bollinger Band theory** (developed by John Bollinger) which assumes that prices tend to revert to the mean after extreme deviations. The RSI component adds **momentum confirmation** to the statistical price deviation signal.
**Statistical Basis:**
- Mean reversion follows the principle that extreme price deviations from the moving average are temporary
- The 2.2 standard deviation multiplier captures approximately 97.2% of price movements under normal distribution
- RSI momentum smoothing reduces noise inherent in oscillator calculations
---
## ⚠️ **Risk Considerations**
This algorithm is designed for traders with understanding of **quantitative finance principles** and **cryptocurrency market dynamics**. The strategy assumes mean-reverting behavior which may not persist during trending market phases. Proper risk management and position sizing are essential.
---
## 🎯 **Implementation Notes**
- **Market Regime Awareness**: Most effective in ranging/consolidating markets
- **Volatility Sensitivity**: Performance may vary during extreme volatility events
- **Backtesting Recommended**: Historical performance analysis advised before live implementation
- **Capital Allocation**: 10% per trade sizing assumes diversified portfolio approach
---
**Engineered for quantitative traders seeking systematic mean reversion exposure in Bitcoin markets through statistically-grounded technical analysis.**

Keltner Channel Strategy by Kevin DaveyKeltner Channel Strategy Description
The Keltner Channel Strategy is a volatility-based trading approach that uses the Keltner Channel, a technical indicator derived from the Exponential Moving Average (EMA) and Average True Range (ATR). The strategy helps identify potential breakout or mean-reversion opportunities in the market by plotting upper and lower bands around a central EMA, with the channel width determined by a multiplier of the ATR.
Components:
1. Exponential Moving Average (EMA):
The EMA smooths price data by placing greater weight on recent prices, allowing traders to track the market’s underlying trend more effectively than a simple moving average (SMA). In this strategy, a 20-period EMA is used as the midline of the Keltner Channel.
2. Average True Range (ATR):
The ATR measures market volatility over a 14-period lookback. By calculating the average of the true ranges (the greatest of the current high minus the current low, the absolute value of the current high minus the previous close, or the absolute value of the current low minus the previous close), the ATR captures how much an asset typically moves over a given period.
3. Keltner Channel:
The upper and lower boundaries are set by adding or subtracting 1.5 times the ATR from the EMA. These boundaries create a dynamic range that adjusts with market volatility.
Trading Logic:
• Long Entry Condition: The strategy enters a long position when the closing price falls below the lower Keltner Channel, indicating a potential buying opportunity at a support level.
• Short Entry Condition: The strategy enters a short position when the closing price exceeds the upper Keltner Channel, signaling a potential selling opportunity at a resistance level.
The strategy plots the upper and lower Keltner Channels and the EMA on the chart, providing a visual representation of support and resistance levels based on market volatility.
Scientific Support for Volatility-Based Strategies:
The use of volatility-based indicators like the Keltner Channel is supported by numerous studies on price momentum and volatility trading. Research has shown that breakout strategies, particularly those leveraging volatility bands such as the Keltner Channel or Bollinger Bands, can be effective in capturing trends and reversals in both trending and mean-reverting markets  .
Who is Kevin Davey?
Kevin Davey is a highly respected algorithmic trader, author, and educator, known for his systematic approach to building and optimizing trading strategies. With over 25 years of experience in the markets, Davey has earned a reputation as an expert in quantitative and rule-based trading. He is particularly well-known for winning several World Cup Trading Championships, where he consistently demonstrated high returns with low risk.

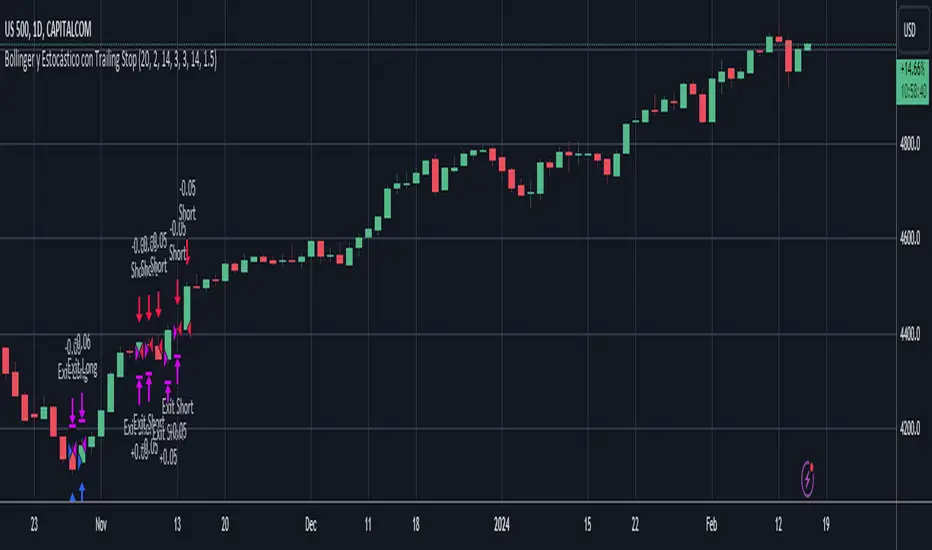
Bollinger and Stochastic with Trailing Stop - D.M.P.This trading strategy combines Bollinger Bands and the Stochastic indicator to identify entry opportunities in oversold and overbought conditions in the market. The aim is to capitalize on price rebounds from the extremes defined by the Bollinger Bands, with the confirmation of the Stochastic to maximize the probability of success of the operations.
Indicators Used
- Bollinger Bands Used to measure volatility and define oversold and overbought levels. When the price touches or breaks through the lower band, it indicates a possible oversold condition. Similarly, when it touches or breaks through the upper band, it indicates a possible overbought condition.
- Stochastic: A momentum oscillator that compares the closing price of an asset with its price range over a certain period. Values below 20 indicate oversold, while values above 80 indicate overbought.
Strategy Logic
- Long Entry (Buy): A purchase operation is executed when the price closes below the lower Bollinger band (indicating oversold) and the Stochastic is also in the oversold zone.
- Short Entry (Sell): A sell operation is executed when the price closes above the upper Bollinger band (indicating overbought) and the Stochastic is in the overbought zone.
BTC 1m Chop Top/Bottom Reversal (Stable Entries)Strategy Description: BTC 5m Chop Top/Bottom Reversal (Stable Entries)
This strategy is engineered to capture precise reversal points during Bitcoin’s choppy or sideways price action on the 5-minute timeframe. It identifies short-term tops and bottoms using a confluence of volatility bands, momentum indicators, and price structure, optimized for high-probability scalping and intraday reversals.
Core Logic:
Volatility Filter: Uses an EMA with ATR bands to define overextended price zones.
Momentum Divergence: Confirms reversals using RSI and MACD histogram shifts.
Price Action Filter: Requires candle confirmation in the direction of the trade.
Locked Signal Logic: Prevents repaints and disappearing trades by confirming signals only once per bar.
Trade Parameters:
Short Entry: Above upper band + overbought RSI + weakening MACD + bearish candle
Long Entry: Below lower band + oversold RSI + strengthening MACD + bullish candle
Take Profit: ±0.75%
Stop Loss: ±0.4%
This setup is tuned for traders using tight risk control and leverage, where execution precision and minimal drawdown tolerance are critical.

TrendMaster Pro 2.3 with Alerts
Hello friends,
A member of the community approached me and asked me how to write an indicator that would achieve a particular set of goals involving comprehensive trend analysis, risk management, and session-based trading controls. Here is one example method of how to create such a system:
Core Strategy Components
Multi-Moving Average System - Uses configurable MA types (EMA, SMA, SMMA) with short-term (9) and long-term (21) periods for primary signal generation through crossovers
Higher Timeframe Trend Filter - Optional trend confirmation using a separate MA (default 50-period) to ensure trades align with broader market direction
Band Power Indicator - Dynamic high/low bands calculated using different MA types to identify price channels and volatility zones
Advanced Signal Filtering
Bollinger Bands Volatility Filter - Prevents trading during low-volatility ranging markets by requiring sufficient band width
RSI Momentum Filter - Uses customizable thresholds (55 for longs, 45 for shorts) to confirm momentum direction
MACD Trend Confirmation - Ensures MACD line position relative to signal line aligns with trade direction
Stochastic Oscillator - Adds momentum confirmation with overbought/oversold levels
ADX Strength Filter - Only allows trades when trend strength exceeds 25 threshold
Session-Based Trading Management
Four Trading Sessions - Asia (18:00-00:00), London (00:00-08:00), NY AM (08:00-13:00), NY PM (13:00-18:00)
Individual Session Limits - Separate maximum trade counts for each session (default 5 per session)
Automatic Session Closure - All positions close at specified market close time
Risk Management Features
Multiple Stop Loss Options - Percentage-based, MA cross, or band-based SL methods
Risk/Reward Ratio - Configurable TP levels based on SL distance (default 1:2)
Auto-Risk Calculation - Dynamic position sizing based on dollar risk limits ($150-$250 range)
Daily Limits - Stop trading after reaching specified TP or SL counts per day
Support & Resistance System
Multiple Pivot Types - Traditional, Fibonacci, Woodie, Classic, DM, and Camarilla calculations
Flexible Timeframes - Auto-adjusting or manual timeframe selection for S/R levels
Historical Levels - Configurable number of past S/R levels to display
Visual Customization - Individual color and display settings for each S/R level
Additional Features
Alert System - Customizable buy/sell alert messages with once-per-bar frequency
Visual Trade Management - Color-coded entry, SL, and TP levels with fill areas
Session Highlighting - Optional background colors for different trading sessions
Comprehensive Filtering - All signals must pass through multiple confirmation layers before execution
This approach demonstrates how to build a professional-grade trading system that combines multiple technical analysis methods with robust risk management and session-based controls, suitable for algorithmic trading across different market sessions.
Good luck and stay safe!

Keltner Channel StrategyOverview
The Keltner Channel Strategy is a powerful trend-following and mean-reversion system that leverages the Keltner Channels, EMA crossovers, and ATR-based stop-losses to optimize trade entries and exits. This strategy has proven to be highly effective, particularly when applied to Gold (XAUUSD) and other commodities with strong trend characteristics.
📈 How It Works
This strategy incorporates two trading approaches: 1️⃣ Keltner Channel Reversal Trades – Identifies overbought and oversold conditions when price touches the outer bands.
2️⃣ Trend Following Trades – Uses the 9 EMA & 21 EMA crossover, with confirmation from the 50 EMA, to enter trades in the direction of the trend.
🔍 Entry & Exit Criteria
📊 Keltner Channel Entries (Reversal Strategy)
✅ Long Entry: When the price crosses below the lower Keltner Band (potential reversal).
✅ Short Entry: When the price crosses above the upper Keltner Band (potential reversal).
⏳ Exit Conditions:
Long positions close when price crosses back above the mid-band (EMA-based).
Short positions close when price crosses back below the mid-band (EMA-based).
📈 Trend Following Entries (Momentum Strategy)
✅ Long Entry: When the 9 EMA crosses above the 21 EMA, and price is above the 50 EMA (bullish momentum).
✅ Short Entry: When the 9 EMA crosses below the 21 EMA, and price is below the 50 EMA (bearish momentum).
⏳ Exit Conditions:
Long positions close when the 9 EMA crosses back below the 21 EMA.
Short positions close when the 9 EMA crosses back above the 21 EMA.
📌 Risk Management & Profit Targeting
ATR-based Stop-Losses:
Long trades: Stop set at 1.5x ATR below entry price.
Short trades: Stop set at 1.5x ATR above entry price.
Take-Profit Levels:
Long trades: Profit target 2x ATR above entry price.
Short trades: Profit target 2x ATR below entry price.
🚀 Why Use This Strategy?
✅ Works exceptionally well on Gold (XAUUSD) due to high volatility.
✅ Combines reversal & trend strategies for improved adaptability.
✅ Uses ATR-based risk management for dynamic position sizing.
✅ Fully automated alerts for trade entries and exits.
🔔 Alerts
This script includes automated TradingView alerts for:
🔹 Keltner Band touches (Reversal signals).
🔹 EMA crossovers (Momentum trades).
🔹 Stop-loss & Take-profit activations.
📊 Ideal Markets & Timeframes
Best for: Gold (XAUUSD), NASDAQ (NQ), Crude Oil (CL), and trending assets.
Recommended Timeframes: 15m, 1H, 4H, Daily.
⚡️ How to Use
1️⃣ Add this script to your TradingView chart.
2️⃣ Select a 15m, 1H, or 4H timeframe for optimal results.
3️⃣ Enable alerts to receive trade notifications in real time.
4️⃣ Backtest and tweak ATR settings to fit your trading style.
🚀 Optimize your Gold trading with this Keltner Channel Strategy! Let me know how it performs for you. 💰📊

Hull Suite by MRS**Hull Suite by MRS Strategy Indicator**
The Hull Suite by MRS Strategy is a technical analysis tool designed to provide insights into market trends using variations of the Hull Moving Average (HMA). This strategy aims to help traders identify optimal entry points for both long and short positions by utilizing multiple types of Hull-based indicators.
### Key Features:
1. **Hull Moving Average Variations**: The indicator offers three different Hull Moving Average variants:
- **HMA (Hull Moving Average)**: A fast-moving average that minimizes lag and reacts quickly to price changes.
- **EHMA (Enhanced Hull Moving Average)**: A smoother version of HMA with reduced noise, offering a clearer view of market trends.
- **THMA (Triple Hull Moving Average)**: A more complex Hull average that aims to provide a stronger confirmation of trend direction.
2. **Customizable Parameters**:
- **Source Selection**: Allows traders to choose the source for calculation (e.g., closing prices).
- **Length**: A configurable parameter to adjust the period over which the moving average is calculated (e.g., 55-period for swing entries).
- **Trend Coloring**: Users can enable automatic color-coding of the Hull moving average to reflect whether the market is in an uptrend (green) or downtrend (red).
- **Candle Color**: Option to color candles based on Hull's trend, further improving the visual clarity of trend direction.
3. **Entry and Exit Signals**:
- **Buy Signal**: Generated when the Hull moving average crosses above its historical value, indicating a potential upward price movement.
- **Sell Signal**: Triggered when the Hull moving average crosses below its historical value, signaling a potential downward price movement.
- The strategy can be customized to work with long, short, or both directions, making it adaptable for various market conditions.
4. **Visual Representation**:
- **Hull Bands**: The indicator can plot the Hull moving average as bands, with customizable transparency to suit individual preferences.
- **Band Filler**: The area between the two Hull moving averages is filled, making it easier to identify trends at a glance.
5. **Backtesting and Strategy Execution**: This strategy can be tested on historical data with adjustable backtest start and stop dates, providing traders with a better understanding of its performance before live trading.
### Purpose:
The Hull Suite by MRS Strategy is designed to assist traders in determining the optimal time to enter and exit the market based on robust Hull moving averages. With its flexibility, it can be used for trend-following, swing trading, or other strategic applications.

CCI based support and resistance strategy
WARNING:
Commissions and slippage has not been considered! Don’t take it easy adding commissions and slippage could turns a fake-profitable strategy to a real disaster.
We consider account size as 10k and we enter 1000 for each trade.
Less than 100 trades is too small sample community and it’s not reliable, Also the performance of the past do not guarantee future performance. This result was handpicked by author and will differ by other timeframes, instruments and settings.
*PLEASE SHARE YOUR SETTINGS THAT WORK WITH THE COMMUNITY.
Introduction:
The CCI-based dynamic support and resistance is a "Bands and Channels" kind of indicator consisting an upper and lower band. This is a strategy which uses CCI-based (Made by me) indicator to execute trades.
SL and TP are calculated based on max ATR during last selected time period. You can edit strategy settings using "Ksl", "Ktp" and the other button for time period. “KSL” and “KTP” are 2.5 and 5 by default.
Bands are calculated regarding CCI previous high and low pivot. CCI length, right pivot length and left pivot length are 50.
A dynamic support and resistance has been calculated using last upper-cci minus a buffer and last lower-cci plus the buffer. The buffer is 10.
If "Trend matter?" button is on you can detect trend by color of the upper and lower line. Green is bullish and red is bearish! "Trend matter?" is on.
The "show mid?" button makes mid line visible, which is average of upper and lower lines, visible. The button is not active by default.
Reaction to the support could be a buy signal while a reaction to the resistance could interpreted as a sell signal.
How this strategy work?
Donald Lambert, a technical analyst, created the CCI, or Commodity Channel Index, which he first published in 1980. CCI is calculated regarding CCI can be used both as trend-detector or an oscillator. As an oscillator most traders believe in static predefined levels. Overbought and oversold candles which are clear in the chart could be used as sell and buy signals.
During my trading career I’ve noticed that there might be some reversal points for the CCI. I believe CCI could have to potential to reverse more from lately reversal point. Of course, just like other trading strategies we are talking about probabilities. We do not expect a win trade each time.
On price chart
Now this the question! What price should the instrument reach that CCI turns to be equal to our reversing aim for CCI? Imagine we have found last important bearish reversal of CCI in 200. Now, if we need the CCI to be 200 what price should we wait for?
How to calculate?
This is the CCI formula:
CCI = (Typical Price - SMA of TP) / (0.015 x Mean Deviation)
Where, Typical Price (TP) = (High + Low + Close)/3
For probable reversing points, high and low pivots of 50 bars have been used.
So we do have an Upper CCI and a Lower CCI. They are valid until the next pivot is available.
By relocating factors in CCI formula you can reach the “Typical Price”.
“
Typical Price = CCI (0.015 * Mean Deviation) + SMA of TP
So we could have a Support or Resistance by replacing CCI with Upper and Lower CCI.
A buy signal is valid if the trend is bullish (or “trend matter” is off) and lowest low of last 2 candles is lower than support and close is greater than both support and open.
A Sell signal is produced in opposite situation.
There are 2+1 options for trend!
Trend matter box is on by default, which means we’ll just open trades in direction of the trend. It’s available to turn it off.
Other 2 options are cross and slope. Cross calculated by comparing fast SMA and slow SMA. The slope one differentiate slow SMA to last “n” one.
Considering last day and today highest ATR as the ATR to calculating SL and TP is our unique technique.

Shorting when Bollinger Band Above Price with RSI (by Coinrule)The Bollinger Bands are among the most famous and widely used indicators. A Bollinger Band is a technical analysis tool defined by a set of trendlines plotted two standard deviations (positively and negatively) away from a simple moving average ( SMA ) of a security's price, but which can be adjusted to user preferences. They can suggest when an asset is oversold or overbought in the short term, thus providing the best time for buying and selling it.
The relative strength index ( RSI ) is a momentum indicator used in technical analysis. RSI measures the speed and magnitude of a security's recent price changes to evaluate overvalued or undervalued conditions in the price of that security. The RSI can do more than point to overbought and oversold securities. It can also indicate securities primed for a trend reversal or corrective pullback in price. It can signal when to buy and sell. Traditionally, an RSI reading of 70 or above indicates an overbought situation. A reading of 30 or below indicates an oversold condition.
The short order is placed on assets that present strong momentum when it's more likely that it is about to reverse. The rule strategy places and closes the order when the following conditions are met:
ENTRY
The closing price is greater than the upper standard deviation of the Bollinger Bands
The RSI is less than 70.
EXIT
The trade is closed when the RSI is less than 70
The lower standard deviation of the Bollinger Band is less than the closing price.
This strategy was backtested from the beginning of 2022 to capture how this strategy would perform in a bear market.
The strategy assumes each order to trade 70% of the available capital to make the results more realistic. A trading fee of 0.1% is taken into account. The fee is aligned to the base fee applied on Binance, which is the largest cryptocurrency exchange by volume.

Bollinger Pair TradeNYSE:MA-1.6*NYSE:V
Revision: 1
Author: @ozdemirtrading
Revision 2 Considerations :
- Simplify and clean up plotting
Disclaimer: This strategy is currently working on the 5M chart. Change the length input to accommodate your needs.
For the backtesting of more than 3 months, you may need to upgrade your membership.
Description:
The general idea of the strategy is very straightforward: it takes positions according to the lower and upper Bollinger bands.
But I am mainly using this strategy for pair trading stocks. Do not forget that you will get better results if you trade with cointegrated pairs.
Bollinger band: Moving average & standard deviation are calculated based on 20 bars on the 1H chart (approx 240 bars on a 5m chart). X-day moving averages (20 days as default) are also used in the background in some of the exit strategy choices.
You can define position entry levels as the multipliers of standard deviation (for exp: mult2 as 2 * standard deviation).
There are 4 choices for the exit strategy:
SMA: Exit when touches simple moving average (SMA)
SKP: Skip SMA and do not stop if moving towards 20D SMA, and exit if it touches the other side of the band
SKPXDSMA: Skip SMA if moving towards 20D SMA, and exit if it touches 20D SMA
NoExit: Exit if it touches the upper & lower band only.
Options:
- Strategy hard stop: if trade loss reaches a point defined as a percent of the initial capital. Stop taking new positions. (not recommended for pair trade)
- Loss per trade: close position if the loss is at a defined level but keeps watching for new positions.
- Enable expected profit for trade (expected profit is calculated as the distance to SMA) (recommended for pair trade)
- Enable VIX threshold for the following options: (recommended for volatile periods)
- Stop trading if VIX for the previous day closes above the threshold
- Reverse active trade direction if VIX for the previous day is above the threshold
- Take reverse positions (assuming the Bollinger band is going to expand) for all trades
Backtesting:
Close positions after a defined interval: mark this if you want the close the final trade for backtesting purposes. Unmark it to get live signals.
Use custom interval: Backtest specific time periods.
Other Options:
- Use EMA: use an exponential moving average for the calculations instead of simple moving average
- Not against XDSMA: do not take a position against 20D SMA (if X is selected as 20) (recommended for pairs with a clear trend)
- Not in XDSMA 1 DEV: do not take a position in 20D SMA 1*standart deviation band (recommended if you need to decrease # of trades and increase profit for trade)
- Not in XDSMA 2 DEV: do not take a position in 20D SMA 2*standart deviation band
Session management:
- Not in session: Session start and end times can be defined here. If you do not want to trade in certain time intervals, mark that session.(helps to reduce slippage and get more realistic backtest results)

Rudy's BB with MartingaleMy first strategy script that uses Bollinger Bands and Martingale to increase contract size after negative profit.