Market Facilitation Index (MFI) Backtest The Market Facilitation Index is an indicator that relates price range to
volume and measures the efficency of price movement. Use the indicator to
determine if the market is trending. If the Market Facilitation Index increased,
then the market is facilitating trade and is more efficient, implying that the
market is trending. If the Market Facilitation Index decreased, then the market
is becoming less efficient, which may indicate a trading range is developing that
may be a trend reversal.
You can change long to short in the Input Settings
WARNING:
- For purpose educate only
- This script to change bars colors.
Pesquisar nos scripts por "backtesting"

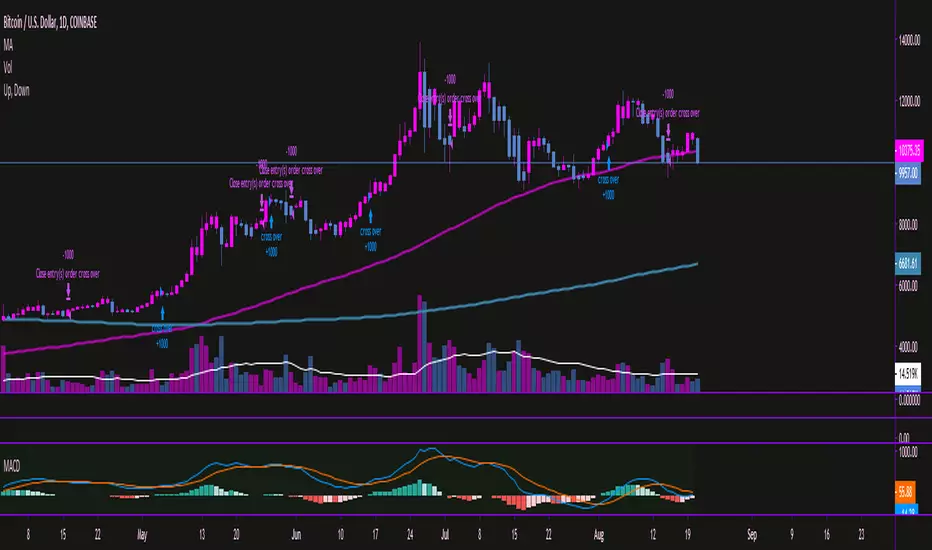
Moving Average Convergence/Divergence MaCD BackestingMade this to backtest simple macd trading strategy, had to set it to open long and short positions because i'm not sure how you get it to calculate otherwise.
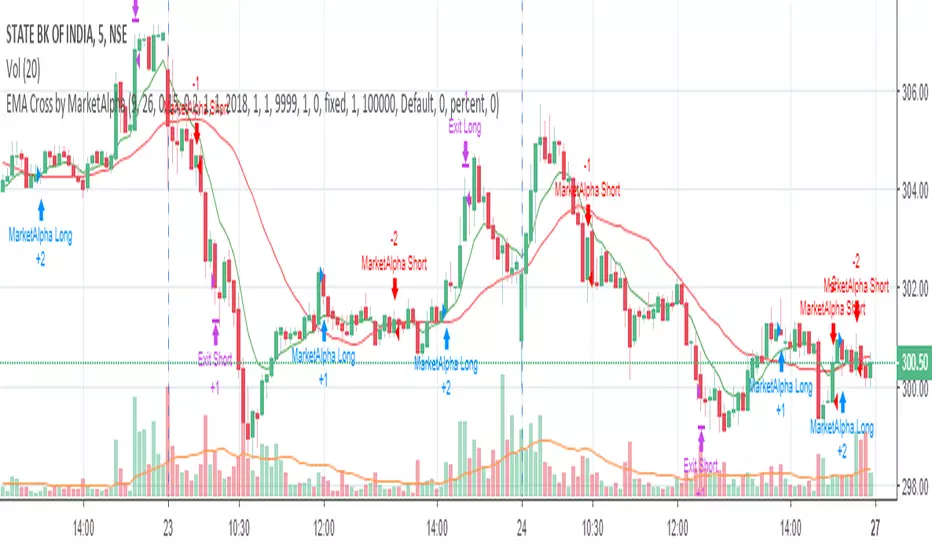
EMA Cross by MarketAlphaSignals are generated when EMA(FastLength) and EMA(SlowLength) cross each other.
Below are the additional user parameters:
1. User defined backtesting period
2. User defined Target and StopLoss percentage points
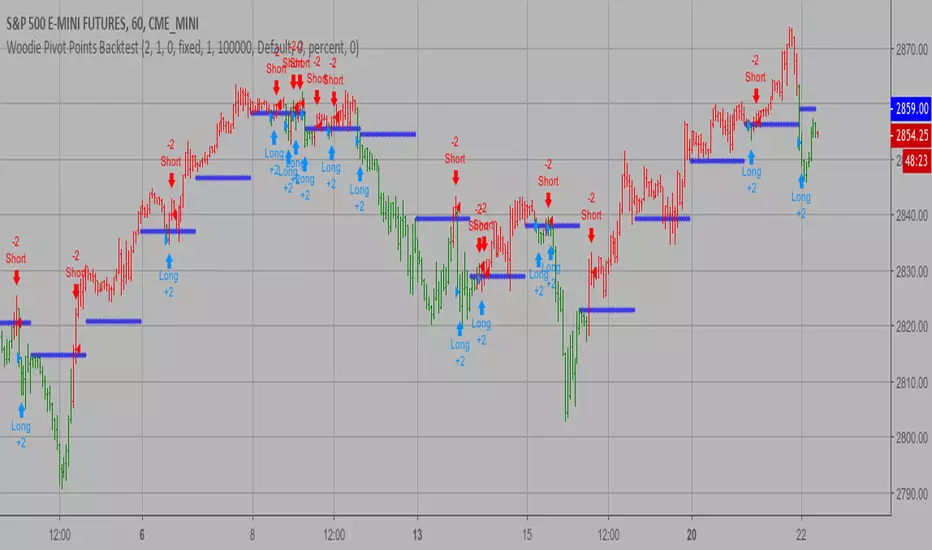
Woodie Pivot Points Backtest Simply input the vales of the high, low and closing price of the previous
period to calculate the Woodie pivot point and the associated resistance
and support levels for the present period.
You can change long to short in the Input Settings
WARNING:
- For purpose educate only
- This script to change bars colors.
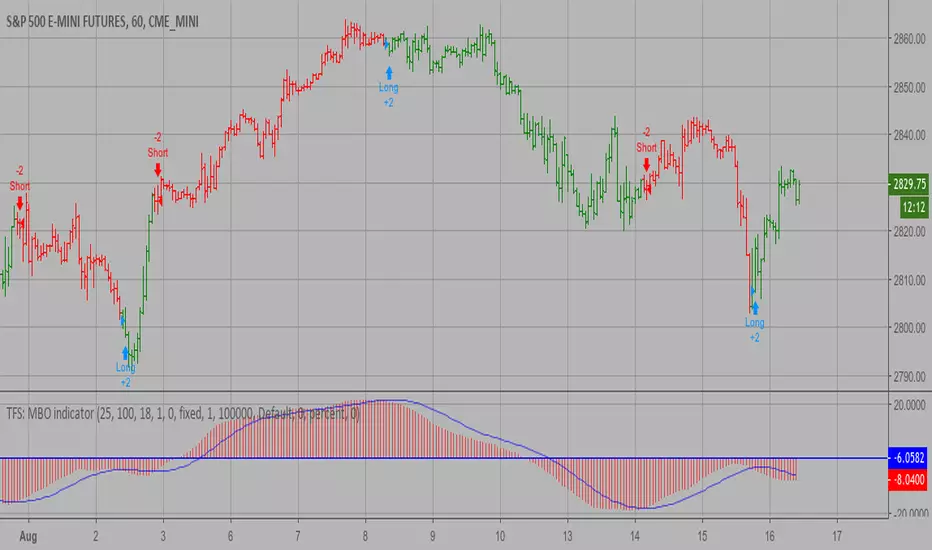
TFS: MBO Backtest MBO indicator is the third component of TFS trading system. This indicator
was developed by Bryan Strain and Mark Whitley.
The idea of MBO is similar to moving average convergence/divergence (MACD)
indicator. It is calculated by subtracting the 200-day moving average from
the 25-day moving average.
You can change long to short in the Input Settings
WARNING:
- For purpose educate only
- This script to change bars colors.
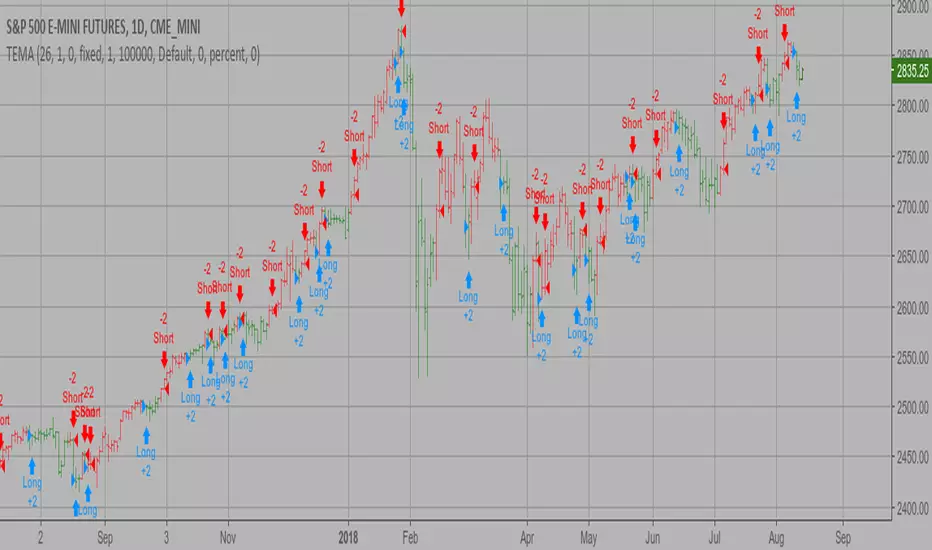
TEMA1 Backtest This study plots the TEMA1 indicator. TEMA1 ia s triple MA (Moving Average),
and is calculated as 3*MA - (3*MA(MA)) + (MA(MA(MA)))
You can change long to short in the Input Settings
WARNING:
- For purpose educate only
- This script to change bars colors.
Percent difference between price and MA Backtest Percent difference between price and MA
You can change long to short in the Input Settings
WARNING:
- For purpose educate only
- This script to change bars colors.

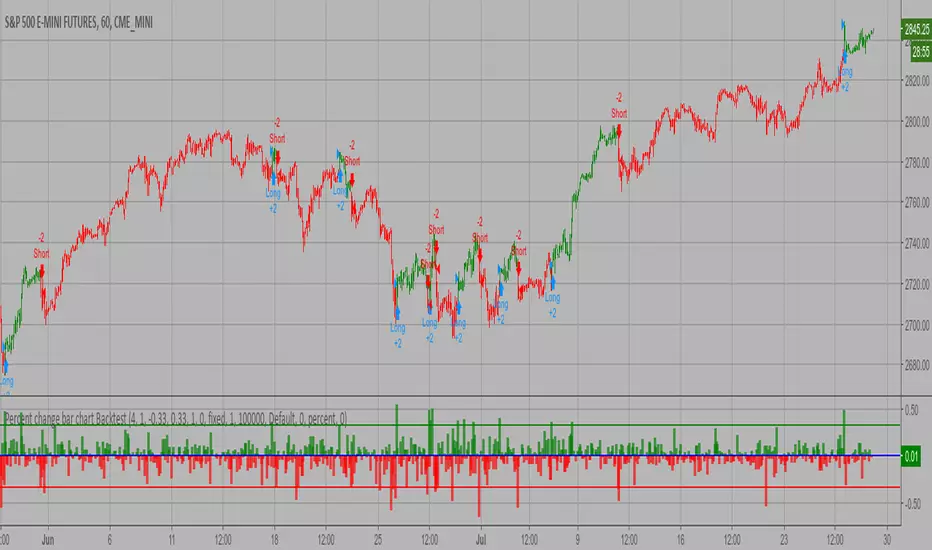
Percent change bar chart Backtest This histogram displays price or % change from previous bar.
You can change long to short in the Input Settings
WARNING:
- For purpose educate only
- This script to change bars colors.
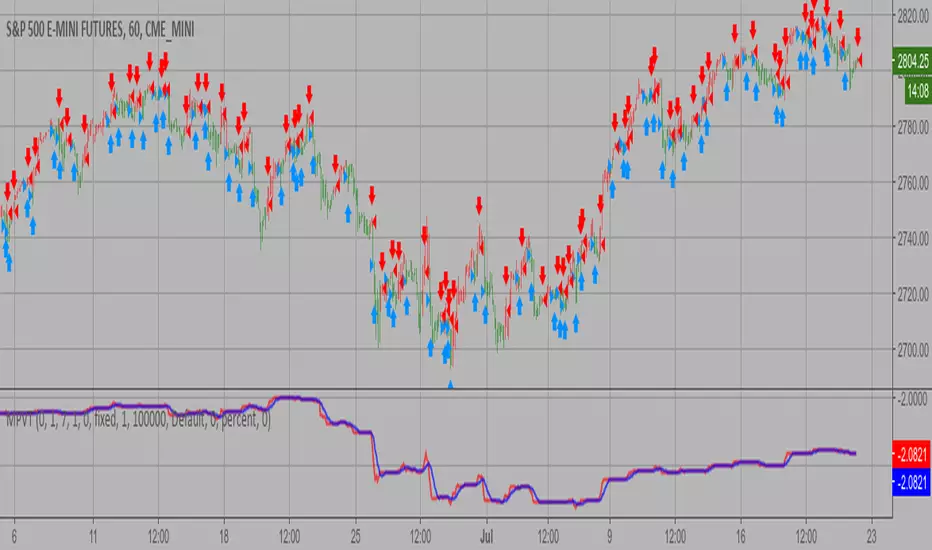
Modified Price-Volume Trend Backtest The related article is copyrighted material from
Stocks & Commodities.
Strategy by HPotter.
You can change long to short in the Input Settings
WARNING:
- For purpose educate only
- This script to change bars colors.
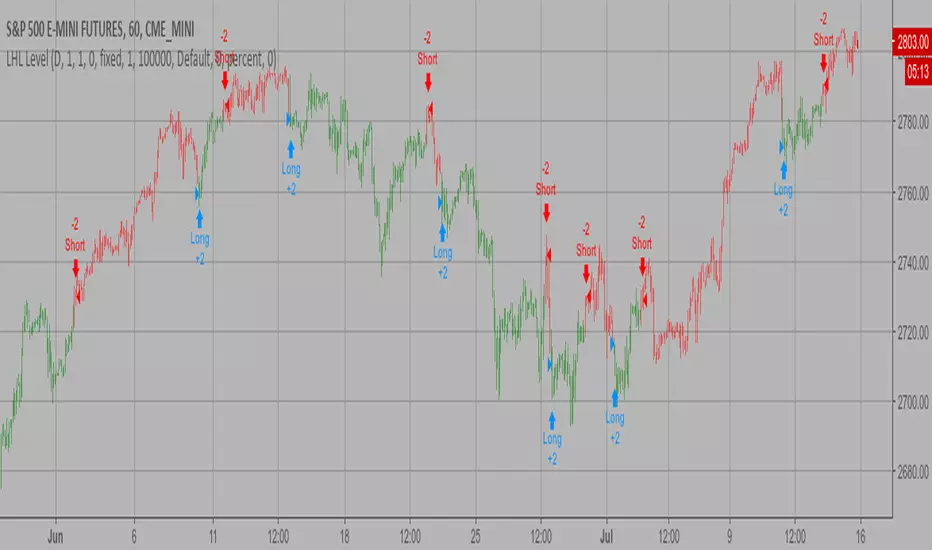
Last High and Low Level Backtest This script shows a high and low period value.
SelectPeriod - Day or Week or Month and etc.
LookBackPeriods - Shift levels 0 - current period, 1 - previous and etc.
You can change long to short in the Input Settings
WARNING:
- For purpose educate only
- This script to change bars colors.
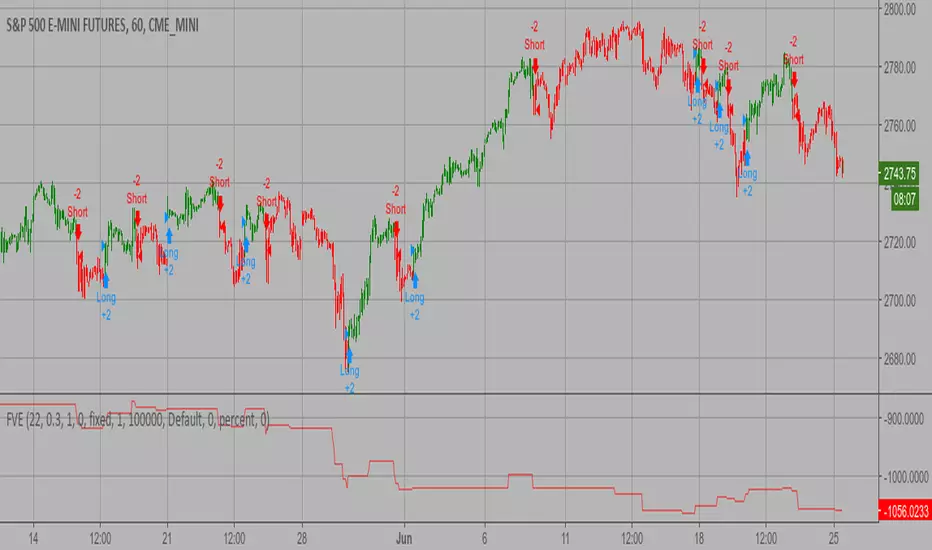
Finite Volume Elements (FVE) Backtest The FVE is a pure volume indicator. Unlike most of the other indicators
(except OBV), price change doesn?t come into the equation for the FVE (price
is not multiplied by volume), but is only used to determine whether money is
flowing in or out of the stock. This is contrary to the current trend in the
design of modern money flow indicators. The author decided against a price-volume
indicator for the following reasons:
- A pure volume indicator has more power to contradict.
- The number of buyers or sellers (which is assessed by volume) will be the same,
regardless of the price fluctuation.
- Price-volume indicators tend to spike excessively at breakouts or breakdowns.
You can change long to short in the Input Settings
WARNING:
- For purpose educate only
- This script to change bars colors.
Ergodic CSI Backtest This is one of the techniques described by William Blau in his book
"Momentum, Direction and Divergence" (1995). If you like to learn more,
we advise you to read this book. His book focuses on three key aspects
of trading: momentum, direction and divergence. Blau, who was an electrical
engineer before becoming a trader, thoroughly examines the relationship between
price and momentum in step-by-step examples. From this grounding, he then looks
at the deficiencies in other oscillators and introduces some innovative techniques,
including a fresh twist on Stochastics. On directional issues, he analyzes the
intricacies of ADX and offers a unique approach to help define trending and
non-trending periods.
This indicator plots Ergotic CSI and smoothed Ergotic CSI to filter out noise.
You can change long to short in the Input Settings
WARNING:
- For purpose educate only
- This script to change bars colors.

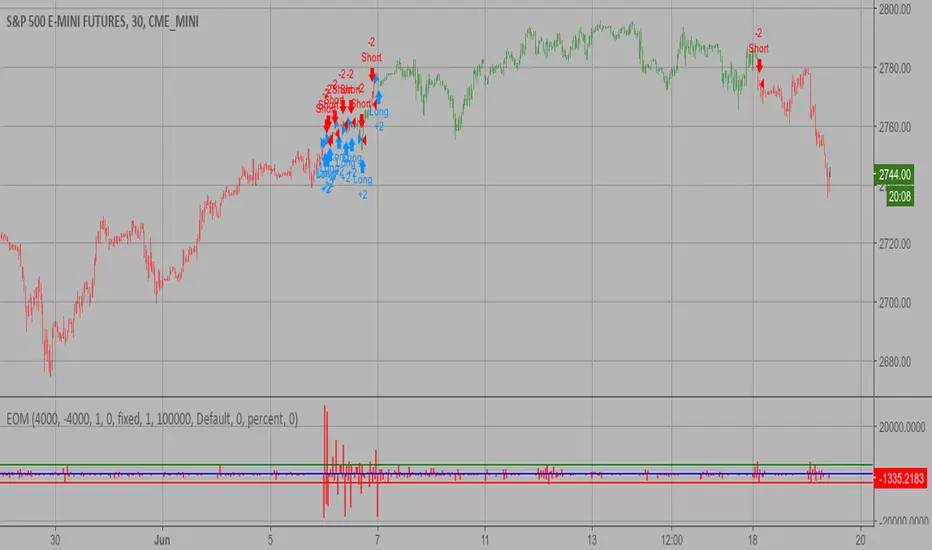
Ease of Movement (EOM) Backtest This indicator gauges the magnitude of price and volume movement.
The indicator returns both positive and negative values where a
positive value means the market has moved up from yesterday's value
and a negative value means the market has moved down. A large positive
or large negative value indicates a large move in price and/or lighter
volume. A small positive or small negative value indicates a small move
in price and/or heavier volume.
A positive or negative numeric value. A positive value means the market
has moved up from yesterday's value, whereas, a negative value means the
market has moved down.
You can change long to short in the Input Settings
WARNING:
- For purpose educate only
- This script to change bars colors.
[STRATEGY]Kagi Emulator OCC & SLTP V3It is a Kagi candle emulator without resolution multiplier.
Also with take profit and stop loss.
Modify the value of "reversal" according to current symbol.
It's the backtest, coming soon, same script but with no-repainting alerts
Enjoy!

Dynamic Momentum Index (DMI) Backtest This indicator plots Dynamic Momentum Index indicator. The Dynamic Momentum
Index (DMI) was developed by Tushar Chande and Stanley Kroll. The indicator
is covered in detail in their book The New Technical Trader.
The DMI is identical to Welles Wilder`s Relative Strength Index except the
number of periods is variable rather than fixed. The variability of the time
periods used in the DMI is controlled by the recent volatility of prices.
The more volatile the prices, the more sensitive the DMI is to price changes.
In other words, the DMI will use more time periods during quiet markets, and
less during active markets. The maximum time periods the DMI can reach is 30
and the minimum is 3. This calculation method is similar to the Variable
Moving Average, also developed by Tushar Chande.
The advantage of using a variable length time period when calculating the RSI
is that it overcomes the negative effects of smoothing, which often obscure short-term moves.
The volatility index used in controlling the time periods in the DMI is based
on a calculation using a five period standard deviation and a ten period average
of the standard deviation.
You can change long to short in the Input Settings
WARNING:
- For purpose educate only
- This script to change bars colors.

[Autoview][BackTest] Blank R0.13BThis is a fork of JustUncleL's
Dual MA Ribbons R0.13
It is now a blank template for making new strategies / alerts for autoview
The changes are as follows:
Removed actual algo
Establish functions for long Signal, long Close Signal and short Signal, short Close Signal to minimize the places code must be edited to update / replace algos
Make allow Long and allow short and invert trade directions independent options
Added support for alternate candle types
Added autoset backtest period feature, and optional coloring
Moved strategy calls in to functions so they can all be commented out or activated / disabled in a single block at the top of the script
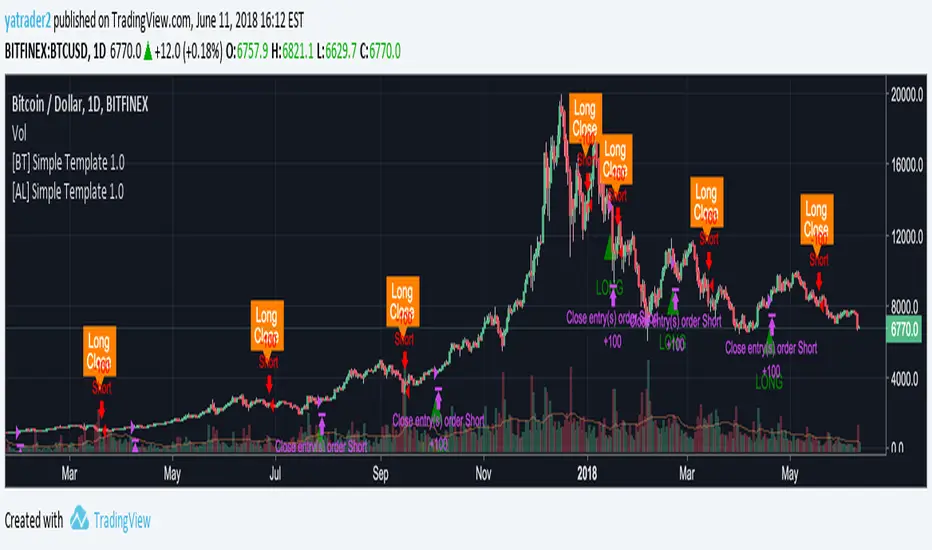
[Autoview][BackTest]Dual MA Ribbons R0.12 by JustUncleLThis is an implementation of a strategy based on two MA Ribbons, a Fast Ribbon and a Slow Ribbon. This strategy can be used on Normal candlestick charts or Renko charts (if you are familiar with them).
The strategy revolves around a pair of scripts: One to generate alerts signals for Autoview and one for Backtesting, to tune your settings.
The risk management options are performed within the script to set SL(StopLoss), TP(TargetProfit), TSL(Trailing Stop Loss) and TTP (Trailing Target Profit). The only requirement for Autoview is to Buy and Sell as directed by this script, no complicated syntax is required.
The Dual Ribbons are designed to capture the inferred behavior of traders and investors by using two groups of averages:
> Traders MA Ribbon: Lower MA and Upper MA (Aqua=Uptrend, Blue=downtrend, Gray=Neutral), with center line Avg MA (Orange dotted line).
> Investors MAs Ribbon: Lower MA and Upper MA (Green=Uptrend, Red=downtrend, Gray=Neutral), with center line Avg MA (Fuchsia dotted line).
> Anchor time frame (0=current). This is the time frame that the MAs are calculated for. This way 60m MA Ribbons can be viewed on a 15 min chart to establish tighter Stop Loss conditions.
Trade Management options:
Option to specify Backtest start and end time.
Trailing Stop, with Activate Level (as % of price) and Trailing Stop (as % of price)
Target Profit Level, (as % of price)
Stop Loss Level, (as % of price)
BUY green triangles and SELL dark red triangles
Trade Order closed colour coded Label:
>> Dark Red = Stop Loss Hit
>> Green = Target Profit Hit
>> Purple = Trailing Stop Hit
>> Orange = Opposite (Sell) Order Close
Trade Management Indication:
Trailing Stop Activate Price = Blue dotted line
Trailing Stop Price = Fuschia solid stepping line
Target Profit Price = Lime '+' line
Stop Loss Price = Red '+' line
Dealing With Renko Charts:
If you choose to use Renko charts, make sure you have enabled the "IS This a RENKO Chart" option, (I have not so far found a way to Detect the type of chart that is running).
If you want non-repainting Renko charts you MUST use TRADITIONAL Renko Bricks. This type of brick is fixed and will not change size.
Also use Renko bricks with WICKS DISABLED. Wicks are not part of Renko, the whole idea of using Renko bricks is not to see the wick noise.
Set you chart Time Frame to the lowest possible one that will build enough bricks to give a reasonable history, start at 1min TimeFrame. Renko bricks are not dependent on time, they represent a movement in price. But the chart candlestick data is used to create the bricks, so lower TF gives more accurate Brick creation.
You want to size your bricks to 2/1000 of the pair price, so for ETHBTC the price is say 0.0805 then your Renko Brick size should be about 2*0.0805/1000 = 0.0002 (round up).
You may find there is some slippage in value, but this can be accounted for in the Backtest by setting your commission a bit higher, for Binance for example I use 0.2%
Special thanks goes to @CryptoRox for providing the initial Risk management Framework in his "How to automate this strategy for free using a chrome extension" example.

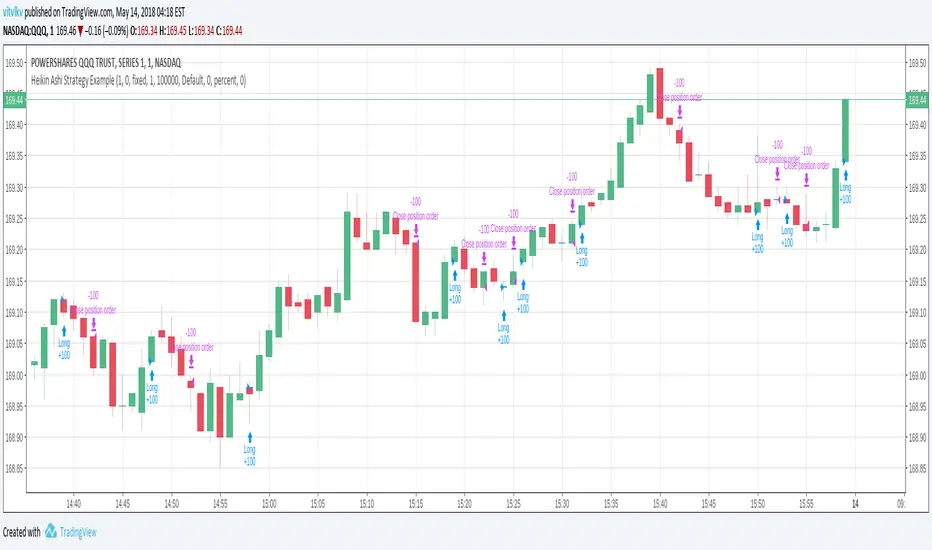
Heikin Ashi Strategy ExampleA strategy which calculates it's entry/exit conditions using HeikinAshi prices and executes orders using real prices (usual candles). NOTE that strategy should be added on a usual candles chart. Heikin Ashi prices are requested in the Pine code using 'security' function.
This is a possible solution to a question getsatisfaction.com =19502808#reply_19502808
MASelect Crossover StratBasic Crossover Strategy for backtesting purposes, to use with the study+alert script.
Use "Format" to change your settings. Both Moving Averages can be changed individually to swap between EMA (Exponential Moving Average), SMA (Simple Moving Average), WMA (Weighted Moving Average), DEMA (Double Exponential Moving Average) and VWMA (Volume Weighted Moving Average).
"Active Length" should be shorter than "Base Length". As usual with crossover strategies, candle resolution will affect results greatly. Longer=better.
Strategy options are "Long+Short" or "Long Only".
Entries/Exits are based on crossovers/crossunders only, but I encourage you to add further exit conditions and play around with the code.
I made this for beginners on Autoview discord to have something to play with, and added some unnecessary visual changes just to give code examples (changing things like background color, candle color, line color, plotting shapes, different plot styles).
Play around combining different types of Moving Averages of different lengths.

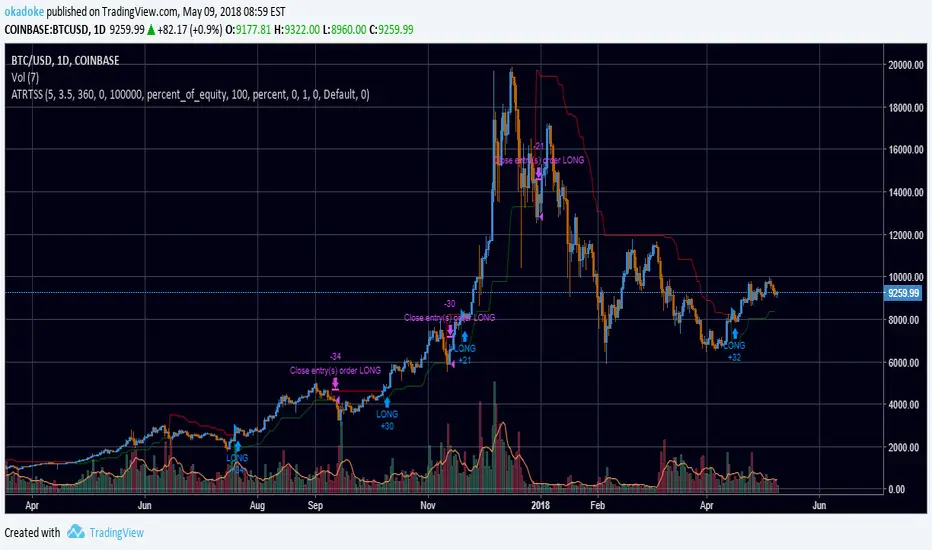
ATR Trailing Stops StrategyUpdate of Average True Range Trailing Stops Strategy by HPotter to include backtesting support
Opens longs when price crosses over trailing stop line, closes when price crosses below
Option to open/close shorts when longs are closed/opened
Option to specify a time range to test over. For example, set Max Days Back to 360 and Min Days Back to 180 to test from 1 year ago to 6 months ago. To test the entire range of data, set both to 0.
Average Directional Movement Index Rating Backtest The Average Directional Movement Index Rating (ADXR) measures the strength
of the Average Directional Movement Index (ADX). It's calculated by taking
the average of the current ADX and the ADX from one time period before
(time periods can vary, but the most typical period used is 14 days).
Like the ADX, the ADXR ranges from values of 0 to 100 and reflects strengthening
and weakening trends. However, because it represents an average of ADX, values
don't fluctuate as dramatically and some analysts believe the indicator helps
better display trends in volatile markets.
You can change long to short in the Input Settings
WARNING:
- For purpose educate only
- This script to change bars colors.

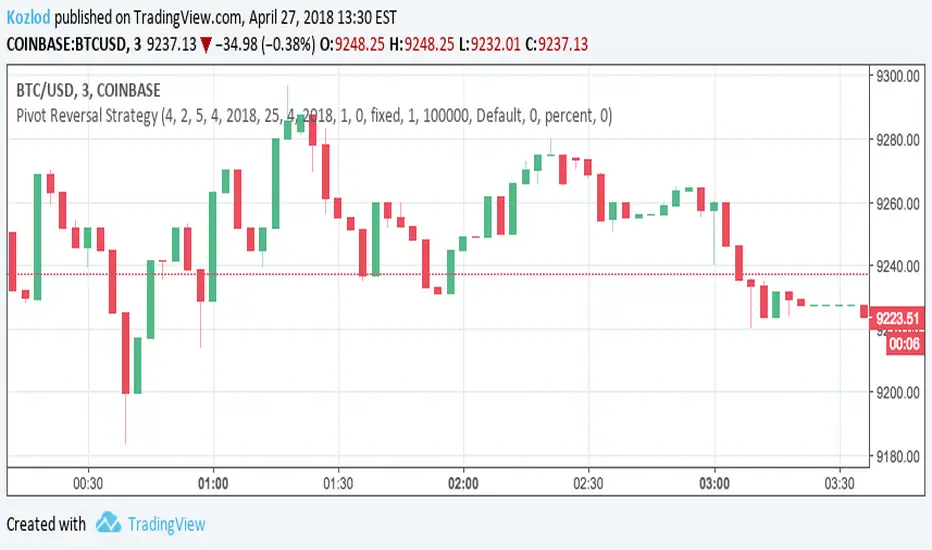
Pivot Reversal Strategy with backtest date rangeThis is standard Pivot Reversal Strategy with backtest date range added.
In parameters you can select from/to date for backtesting range.
Vertical Horizontal Filter BacktestVertical Horizontal Filter was initiated by Adam White. It was first published
in a magazine called “Issues of Futures” in August, 1991. The Vertical Horizontal
Filter (VHF) is a very common Indicator used by traders to find out the Phase of
a Price Trend. Normally, a price trend can be in a Trending Phase or a Congestion
Phase/Choppy Movement Phase. Adam White created this particular Technical Indicator
to determine whether prices are trending in a particular direction or are they going
through a transitional period. He used it to measure the range of Futures available
in the market.
You can change long to short in the Input Settings
WARNING:
- For purpose educate only
- This script to change bars colors.
