(JS) Ultimate Multi Time Frame Moving AveragesSick of having to pull up tons of charts to check the moving averages on various time frames? Me too, so I decided to make the "Ultimate Multi Time Frame Moving Averages" overlay.
So what's it do? Simple. It allows you to plot moving averages from other time frames on your current chart. There's a bunch of built in MA's, and I also added space for two custom SMAs and three custom EMAs.
The custom moving averages can be set to any length or time frame that you desire.
The ones that come built in include:
5 Day SMA
10 Day SMA
20 Day SMA
50 Day SMA
100 Day SMA
200 Day SMA
5 Week SMA
10 Week SMA
20 Week SMA
50 Week SMA
100 Week SMA
200 Week SMA
Now you can simply check or un-check any of the following to see where these MAs fall on your current chart, no more flipping back and forth! Enjoy!
Pesquisar nos scripts por "averages"

MTF 5 Moving Averages//@version=5
indicator("Multi-Timeframe 5 Moving Averages", shorttitle="MTF MA x5", overlay=true)
// ============== MOVING AVERAGE 1 ==============
ma1_enabled = input(true, title="Enable MA1", group="Moving Average 1")
ma1_period = input.int(9, title="MA1 Period", minval=1, group="Moving Average 1")
ma1_type = input.string("EMA", title="MA1 Type", options= , group="Moving Average 1")
ma1_color = input(color.new(#FF6B35, 0), title="MA1 Color", group="Moving Average 1")
// ============== MOVING AVERAGE 2 ==============
ma2_enabled = input(true, title="Enable MA2", group="Moving Average 2")
ma2_period = input.int(20, title="MA2 Period", minval=1, group="Moving Average 2")
ma2_type = input.string("EMA", title="MA2 Type", options= , group="Moving Average 2")
ma2_color = input(color.new(#004E89, 0), title="MA2 Color", group="Moving Average 2")
// ============== MOVING AVERAGE 3 ==============
ma3_enabled = input(true, title="Enable MA3", group="Moving Average 3")
ma3_period = input.int(50, title="MA3 Period", minval=1, group="Moving Average 3")
ma3_type = input.string("SMA", title="MA3 Type", options= , group="Moving Average 3")
ma3_color = input(color.new(#F7931E, 0), title="MA3 Color", group="Moving Average 3")
// ============== MOVING AVERAGE 4 ==============
ma4_enabled = input(true, title="Enable MA4", group="Moving Average 4")
ma4_period = input.int(100, title="MA4 Period", minval=1, group="Moving Average 4")
ma4_type = input.string("SMA", title="MA4 Type", options= , group="Moving Average 4")
ma4_color = input(color.new(#1E88E5, 0), title="MA4 Color", group="Moving Average 4")
// ============== MOVING AVERAGE 5 ==============
ma5_enabled = input(true, title="Enable MA5", group="Moving Average 5")
ma5_period = input.int(200, title="MA5 Period", minval=1, group="Moving Average 5")
ma5_type = input.string("EMA", title="MA5 Type", options= , group="Moving Average 5")
ma5_color = input(color.new(#43A047, 0), title="MA5 Color", group="Moving Average 5")
// ============== FUNCTION TO CALCULATE MA ==============
calcMA(period, maType, source) =>
switch maType
"SMA" => ta.sma(source, period)
"EMA" => ta.ema(source, period)
"WMA" => ta.wma(source, period)
=> ta.sma(source, period)
// ============== CALCULATE MOVING AVERAGES (CHART TIMEFRAME ONLY) ==============
ma1_value = calcMA(ma1_period, ma1_type, close)
ma2_value = calcMA(ma2_period, ma2_type, close)
ma3_value = calcMA(ma3_period, ma3_type, close)
ma4_value = calcMA(ma4_period, ma4_type, close)
ma5_value = calcMA(ma5_period, ma5_type, close)
// ============== PLOT MOVING AVERAGES ==============
plot(ma1_enabled ? ma1_value : na, title="MA1", color=ma1_color, linewidth=2)
plot(ma2_enabled ? ma2_value : na, title="MA2", color=ma2_color, linewidth=2)
plot(ma3_enabled ? ma3_value : na, title="MA3", color=ma3_color, linewidth=2)
plot(ma4_enabled ? ma4_value : na, title="MA4", color=ma4_color, linewidth=2)
plot(ma5_enabled ? ma5_value : na, title="MA5", color=ma5_color, linewidth=2)

Multi-Timeframe Trend MA&BB Suite: 6x Moving Averages by Jenn.ioMulti-Timeframe Trend MA & BB Suite: 6x Moving Averages + 5x MTF View by Jenn.io
Indicator Overview
This indicator is a comprehensive, all-in-one trend and volatility tool designed for traders who rely on Moving Averages (MAs) and Bollinger Bands (BBs). It stands out by allowing users to plot up to six fully customized MAs on the current chart, while simultaneously projecting the values of those same MAs from up to five higher timeframes (MTF).
It's the essential tool for top-down analysis and identifying high-probability confluence zones.
Key Features and Customization
1. The Core: 6x MAs and Bollinger Bands: six Independent MAs: Plot up to six separate Moving Averages on your current chart. Each MA is fully customizable in terms of:
Type: Choose from SMA, EMA, SMMA (RMA), WMA, or VWMA.
Source and Length: Set the calculation source (Close, Open, etc.) and the lookback period.
Style: Customize color, thickness, and line style (Solid, Dashed, Dotted).
Integrated Bollinger Bands (BB): Includes standard Bollinger Bands with customization for length, standard deviation, MA type, and the option to enable or disable the band fill color.
2. Advanced: Multi-Timeframe (MTF) Projection
a. 5x MTF Timeframes: The user can enable and fully customize up to five distinct higher timeframes (e.g., Daily, Weekly, Monthly, 4H, 15m).
b. Dynamic MTF Visualization: The indicator fetches the value of the 6 MAs from these higher timeframes and displays them on the current chart using one of three customizable modes:
Extended Mode: Projects the MTF MA value as a continuous line extending to the right, simulating where the MA is moving on the higher chart.
Floating Segment: Draws a short, visible line segment near the current price action, showing the MA value without cluttering the whole chart.
Floating Label: Displays the MA value as a text label anchored to the right of the current bar, providing clean, non-obtrusive data.
Recommended Usage
1. MTF Confluence: Look for instances where the MTF MA lines align closely with the MAs or BBs of your current timeframe. These areas represent strong support/resistance zones.
2. Trend Filter: Use the Extended Mode MTF lines to quickly determine the higher-timeframe trend without changing your chart. For example, if the Daily 200 EMA is above the current price, the bias is bearish.
3. Precision Entries: Use the Floating Label Mode to see the precise MA value from a higher timeframe. This is useful for placing limit orders near key structural levels.

Four Moving AveragesOverview
This customizable indicator displays up to four moving averages simultaneously on your chart, giving traders complete flexibility to monitor multiple trends and timeframes at once. Each moving average is independently configurable, allowing you to create your perfect combination of trend indicators.
How It Works
The indicator calculates and plots four separate moving averages based on your specifications. Each moving average can be customized independently, allowing you to mix different types, lengths, and timeframes. For example, you could display a 20-period EMA on the current timeframe alongside a 200-period SMA from a daily chart, all while viewing an intraday chart.
Key Features
Multiple MA Types Supported:
SMA (Simple Moving Average) - Equal weight to all periods
EMA (Exponential Moving Average) - More weight to recent prices
WMA (Weighted Moving Average) - Linear weighting
RMA (Rolling Moving Average) - Also known as Smoothed MA
HMA (Hull Moving Average) - Reduced lag with smooth curve
VWMA (Volume Weighted Moving Average) - Incorporates volume data
Fully Customizable Parameters for Each MA:
Length: Set any period from 1 to infinity (common: 20, 50, 100, 200)
Source: Choose from Close, Open, High, Low, HL2, HLC3, OHLC4, and more
Timeframe: Display MAs from any timeframe regardless of your chart timeframe
Offset: Shift the MA forward or backward on the chart
Enable/Disable: Toggle each MA on or off without losing settings
Visual Customization:
Custom Colors: Choose any color for each MA line
Line Styles: Select from Solid, Dashed, or Dotted lines
Line Width: Adjust thickness from 1 to 4 for better visibility
Organized Settings: Each MA has its own settings group for easy configuration
Default Configuration
Out of the box, the indicator comes with these preset values:
MA1: 20-period SMA (Blue) - Short-term trend
MA2: 50-period SMA (Red) - Medium-term trend
MA3: 100-period SMA (Green) - Longer-term trend
MA4: 200-period SMA (Orange) - Long-term trend/support-resistance
Use Cases
Trend Identification: Use multiple timeframes to confirm trend direction
Support/Resistance: Moving averages often act as dynamic support and resistance levels
Crossover Strategies: Identify when faster MAs cross slower MAs for potential signals
Multi-Timeframe Analysis: Display daily MAs on an hourly chart for broader context
Custom Setups: Create your own unique combination of MAs that fit your trading style

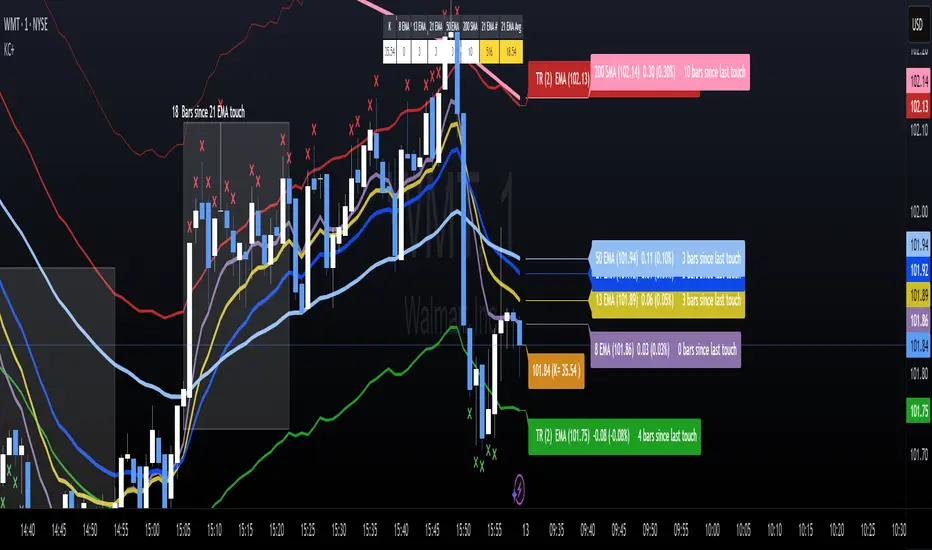
Keltner Channels with Moving AveragesOverview
A comprehensive technical analysis indicator combining multiple trading systems into one powerful tool. This indicator integrates trend channel analysis with Keltner channel bands and up to 5 moving averages Bollinger bands to aid traders to catch extreme conditions in the market. Works across all markets and timeframes.
Key Features
- Keltner channels
- can configure to use ATR or true range.
- configurable for up to 2 Keltner channel bands provides multiplier and extreme multiplier.
- alerts when price crosses Keltner bands. including higher timeframe alerts.
- Bollinger Bands
- can add Bollinger bands to the chart.
- Dynamic Trend Channel
- based on previous pivot point displays a regression trend channel.
- pivot points and channels size are configurable.
- Custom labels
- configure custom labels on moving averages and Keltner channels
- labels display how far away moving average is away from current price.
- how long it has been since the moving average has been touched.
- labels can be enabled/disabled and adjusted on the screen.
- EMA Touch Box
- display a box showing how long it has been since price has touched an EMA.
- configurable in setting to change MA and minimum length
- Stat Table
- display last time an EMA touch price
- display the K value to determine overbought oversold conditions.
- display the average time price is away from an Moving average.
- Display Options
- features can be toggled on off in settings.
- Customize stat table can be positioned in 9 positions and moved down up to 4 rows.
- labels can be enabled/disabled and moved closer or further from the latest bar.
Alerts
- Alerts are are available when price crosses Keltner bands.
Important Notes
⚠️ **Risk Disclaimer**: This indicator is for educational and informational purposes only. Past performance does not guarantee future results. The win rates shown in the dashboard are historical calculations and should not be considered predictive. Always conduct your own analysis and use proper risk management.
⚠️ **Not Financial Advice**: This tool does not constitute financial, investment, or trading advice. All trading decisions are your own responsibility.
Credits
This indicator combines concepts from various technical analysis methodologies including Keltner, Bollinger, Moving Averages, K value, Pivot point trend channel.
---
Version: 1.0
Compatible With: All markets (Forex, Crypto, Stocks, Indices, Commodities)
Recommended Timeframes: Works on all timeframes; optimized for 15m or lower.
Chanpreet Moving AveragesChanpreet Moving Averages
by Chanpreet Singh
This script plots up to four customizable moving averages (SMA, EMA, SMMA/RMA, WMA, VWMA).
You can adjust:
Moving average type
Source (close, open, hl2, etc.)
Length
Color
An optional input lets you select a higher or custom timeframe for the moving averages (e.g., daily MA on a 1-hour chart). If left empty, the script calculates them on the current chart timeframe, so the lines scale and move naturally when zooming or panning.
This tool is designed for educational and visualization purposes, helping traders see trend direction and potential areas of dynamic support/resistance.
⚠️ Disclaimer: This script does not provide financial advice or trading signals. Use it at your own risk. Always do your own research before making trading decisions.
Multiple Colored Moving AveragesMULTIPLE COLORED MOVING AVERAGES - USER GUIDE
DISCLAIMER
----------
Both the code and this documentation were created heavily using artificial intelligence. I'm lazy...
This indicator was inspired by repo32's "Moving Average Colored EMA/SMA" indicator. *
What is this indicator?
-----------------------
This is a TradingView indicator that displays up to 4 different moving averages on your chart simultaneously. Each moving average can be customized with different calculation methods, colors, and filtering options.
Why would I use multiple moving averages?
-----------------------------------------
- See trend direction across different timeframes at once
- Identify support and resistance levels
- Spot crossover signals between fast and slow MAs
- Reduce false signals with filtering options
- Compare how different MA types react to price action
What moving average types are available?
----------------------------------------
11 different types:
- SMA: Simple average, equal weight to all periods
- EMA: Exponential, more weight to recent prices
- WMA: Weighted, linear weighting toward recent data
- RMA: Running average, smooth like EMA
- DEMA: Double exponential, reduced lag
- TEMA: Triple exponential, even less lag
- HMA: Hull, fast and smooth combination
- VWMA: Volume weighted, includes volume data
- LSMA: Least squares, based on linear regression
- TMA: Triangular, double-smoothed
- ZLEMA: Zero lag exponential, compensated for lag
How do I set up the indicator?
------------------------------
Each MA has these settings:
- Enable/Disable: Turn each MA on or off
- Type: Choose from the 11 calculation methods
- Length: Number of periods (21, 50, 100, 200 are common)
- Smoothing: 0-10 levels of extra smoothing
- Noise Filter: 0-5% to ignore small changes
- Colors: Bullish (rising) and bearish (falling) colors
- Line Width: 1-5 pixels thickness
What does the smoothing feature do?
-----------------------------------
Smoothing applies extra calculations to make the moving average line smoother. Higher levels reduce noise but make the MA respond slower to price changes. Use higher smoothing in choppy markets, lower smoothing in trending markets.
What is the noise filter?
--------------------------
The noise filter ignores small percentage changes in the moving average. For example, a 0.3% filter will ignore any MA movement smaller than 0.3%. This helps eliminate false signals from minor price fluctuations.
When should I use this indicator?
---------------------------------
- Trend analysis: See if market is going up, down, or sideways
- Entry timing: Look for price bounces off MA levels
- Exit signals: Watch for MA slope changes or crossovers
- Support/resistance: MAs often act as dynamic levels
- Multi-timeframe analysis: Use different lengths for different perspectives
What are some good settings to start with?
-------------------------------------------
Conservative approach:
- MA 1: EMA 21 (short-term trend)
- MA 2: SMA 50 (medium-term trend)
- MA 3: SMA 200 (long-term trend)
- Low noise filtering (0.1-0.3%)
Active trading:
- MA 1: HMA 9 (very responsive)
- MA 2: EMA 21 (short-term)
- MA 3: EMA 50 (medium-term)
- Minimal or no smoothing
How do I interpret the colors?
------------------------------
Each MA changes color based on its direction:
- Bullish color: MA is rising (upward trend)
- Bearish color: MA is falling (downward trend)
- Gray: MA is flat or unchanged
What should I look for in crossovers?
-------------------------------------
- Golden Cross: Fast MA crosses above slow MA (bullish signal)
- Death Cross: Fast MA crosses below slow MA (bearish signal)
- Multiple crossovers in same direction can confirm trend changes
- Wait for clear separation between MAs after crossover
How do I use MAs for support and resistance?
---------------------------------------------
- In uptrends: MAs often provide support when price pulls back
- In downtrends: MAs may act as resistance on rallies
- Multiple MAs create support/resistance zones
- Stronger levels where multiple MAs cluster together
Can I use this with other indicators?
-------------------------------------
Yes, it works well with:
- Volume indicators for confirmation
- RSI or MACD for timing entries
- Bollinger Bands for volatility context
- Price action patterns for setup confirmation
What if I get too many signals?
-------------------------------
- Increase smoothing levels
- Raise noise filter percentages
- Use longer MA periods
- Focus on major crossovers only
- Wait for multiple MA confirmation
What if signals are too slow?
-----------------------------
- Reduce smoothing to 0
- Lower noise filter values
- Switch to faster MA types (HMA, ZLEMA, DEMA)
- Use shorter periods
- Focus on the fastest MA only
Which MA types work best in different markets?
----------------------------------------------
Trending markets: EMA, DEMA, TEMA (responsive to trends)
Choppy markets: SMA, TMA, HMA with smoothing (less whipsaws)
High volatility: Use higher smoothing and noise filtering
Low volatility: Use minimal filtering for better responsiveness
Do I need all the advanced features?
------------------------------------
No. Start with basic settings:
- Choose MA type and length
- Set colors you prefer
- Leave smoothing at 0
- Leave noise filter at 0
Add complexity only if needed to improve signal quality.
How do I know if my settings are working?
-----------------------------------------
- Backtest on historical data
- Paper trade the signals first
- Adjust based on market conditions
- Keep a trading journal to track performance
- Be willing to modify settings as markets change
Can I save different configurations?
------------------------------------
Yes, save different indicator templates in TradingView for:
- Different trading styles (scalping, swing trading)
- Different market conditions (trending, ranging)
- Different instruments (stocks, forex, crypto)

Adaptive Moving AveragesThe Adaptive Moving Averages indicator stands out with several unique features that set it apart from traditional moving average indicators. Its most remarkable characteristic is the ability to automatically adjust the length of moving averages based on the chosen timeframe. This ensures consistency in analysis regardless of the time scale used, eliminating the need for manual recalculation of appropriate periods for each timeframe. It allows for a more fluid and accurate multi-temporal analysis.
Another innovative aspect is the indicator's consideration of different market types (stocks, forex, crypto). This approach recognizes the fundamental differences between these markets in terms of trading hours, allowing for more precise and representative calculations for each asset class. It offers increased flexibility for traders operating across various markets.
The method for calculating periods for different moving averages (week, month, quarter, semester, year) is particularly sophisticated. It takes into account the specifics of each market, such as trading days and opening hours, automatically adapting to timeframe changes. This ensures a more accurate representation of actual trading periods rather than arbitrary approximations.
The indicator offers a wide choice of moving average types, allowing traders to use their preferred method or compare different approaches. This flexibility adapts to various trading styles and technical analysis strategies, offering the possibility to experiment and find the most effective combination for each market or asset.
In conclusion, this indicator distinguishes itself through its ability to intelligently adapt to different trading contexts, offering a versatile and sophisticated solution for technical analysis. Its flexibility and adaptive approach make it a particularly interesting tool for traders seeking consistent analysis across different markets and time scales.

Kenji Indicator Version 2.0KenJi Indicator Version 2.0
Indicator Class : Average analysis/trend following
Trading type : Any
Time frame : Any
Purpose : Trend-based trading
Level of aggressiveness : Flexible
Introduction
The basic rule of trading is as follows: "trend is your friend." Means, it is extremely important to follow the current market sentiments rather than resisting them. Following this principle allows a trader to feel as comfortable as possible during the trading: positions typically are in a profit zone and there is no psychological pressure of a negative financial result that often leads to hasty position closures.
Despite the advantages of trend-following strategies, many traders struggle to accurately identify the prevailing trend and market sentiments, resulting in bad trading decisions and, consequently, unfavorable trading outcomes.
To address these challenges, streamline the analysis process, and enhance the overall quality of trading decisions, our team of analysts has developed The KenJi Indicator Version 2.0.
About the KenJi Indicator Version 2.0
The KenJi Indicator Version 2.0 offers a novel approach to traditional average-based analysis. Many conventional strategies relying on averages tend to generate numerous false signals, especially in “flat” markets where frequent crossovers and shifts in direction are common. This reduces the overall effectiveness of average analysis.
The KenJi Indicator Version 2.0 addresses these issues by incorporating a unique algorithm, which combines correlation and moving average analysis to avoid the pitfalls of traditional methods. It accurately identifies market conditions—indicated by colors: red for a downtrend, blue for an uptrend, and green for a “flat” market—thereby improving the quality of signals and helping traders manage trends more effectively.
The KenJi Indicator Version 2.0 indicator not only identifies optimal entry points but also assists in timing exits for profit-taking. Moreover, it assesses the aggressiveness of signals, making it suitable for both novice and experienced traders.
Trading Rules
Using the KenJi Indicator Version 2.0 is straightforward. When the price enters the buy or sell zone—represented by a blue or red area between the fast and slow averages—it generates a signal to enter a position. This position remains active until the market condition changes (such as a shift from a downtrend to “flat”) or until a close signal appears, indicated by a significant divergence shown by a blue or red cross.
Indicator Structure
The KenJi Indicator Version 2.0 consists of colored zones, level lines and stop crosses:
Trend Zones : These are color-coded (blue, red, or green) to highlight trend conditions and entry points.
Level Lines : The lines indicate the nearest support/resistance lines (red for resistance, blue for support). Available for 4H time-frame and below
Stop Crosses : Blue or Red crosses are displayed on the Chart to show the moments of extreme price divergence from the current trend. A good moment to fix profits.
For ease of use, the indicator shows buy and sell signals directly on the chart.
Signal Types:
Standard : Uses the basic lot size for trades.
Aggressive : Uses double the standard lot size for higher risk/reward trades.
Profit zones are marked by blue/red x-crosses: red x-crosses indicate "sell" take-profit zones, while blue x-crosses indicate "buy" take-profit zones.
Alerts and Notifications
The indicator includes built-in alerts and notifications, ensuring traders don’t miss any "buy" or "sell" signals.
Input Parameters
The KenJi Indicator Version 2.0 offers several input parameters for customization:
Slow Average Period : Defines the period for the slow average. Longer periods provide a more stable, conservative response to price changes.
Fast Average Period : Defines the period for the fast average. Similar to the slow average, a longer period provides more conservative signals.
Correlation Period : Used to calculate the Pearson correlation coefficient and estimate the relationship between the fast and slow averages, improving trend identification.
Divergence Sensitivity : Determines the placement of take-profit zones, with higher values increasing the distance of these zones.
Access to the KenJi Indicator Version 2.0
For more information or to request access to the Kenji 2.0 Indicator, please send inquiries via private messages.

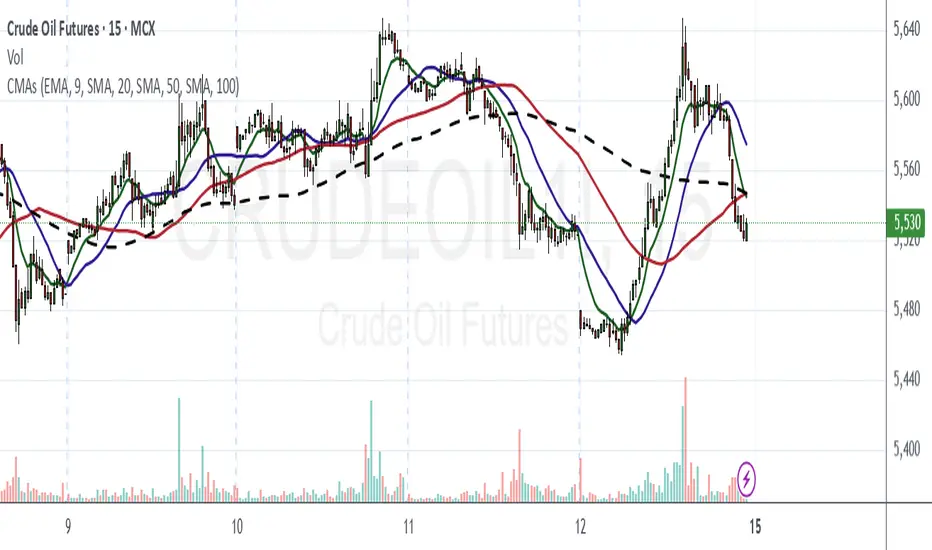
Dual SMA/EMA BandsThe Dual SMA/EMA Bands indicator provides a clear view of market trends, combining Simple Moving Averages (SMA) and Exponential Moving Averages (EMA) in one customizable tool. Designed for any timeframe, it features Aqua and Purple Bands for 50-period and 200-period averages , respectively, aiding in trend analysis and volatility insights.
Features:
Adaptive Timeframes : Automatically aligns with the chart’s timeframe or can be manually set for cross-timeframe analysis.
Customization : Offers easy adjustments for colors, line thickness, and opacity to suit personal preferences and enhance readability.
Insights : Facilitates trend confirmation and volatility assessment, essential for informed trading decisions.
Usage Tips:
Use the bands to gauge market direction; above the bands suggests bullish conditions, below them indicates bearish trends.
The gap between EMA and SMA within each band can signal market volatility.
Apply customizable timeframes for a comprehensive market overview.
Conclusion:
With its straightforward setup and versatile application, the Dual SMA/EMA Bands indicator is a valuable tool for traders looking to deepen their market analysis and uncover trading opportunities.

GKD-C Chaos Visual Averages [Loxx]The Giga Kaleidoscope GKD-C Chaos Visual Averages is a confirmation module included in Loxx's "Giga Kaleidoscope Modularized Trading System."
? GKD-C Chaos Visual Averages
One of the most common errors made by inexperienced traders is attempting to extract excessive information from a single chart by employing numerous unnecessary indicators. The outcome often entails a cluttered chart filled with lines, erratic patterns, and an assortment of distracting elements, all of which weave a conflicting narrative for the trader.
This on-screen "clutter" can bewilder new traders, compelling them to open or maintain unprofitable positions until the dreaded Margin Call looms.
The advice is clear: Keep it simple. But how can one achieve this simplicity?
Enter the Chaos Visual Averages indicator
This indicator not only generates the most precise reversal signals available but also equips traders to seamlessly align with prevailing trends and engage in counter-trend trading to realign with the overall market direction.
For traders opting to employ Chaos, a clean and uncluttered chart is recommended, eschewing the use of additional oscillators, as all the necessary components are already integrated into Visual Chaos.
Tip: Crafting a straightforward and profitable trading system with Chaos involves marking Weekly and Daily Support and Resistance lines and executing counter-trend trades as price approaches these key levels, utilizing the Overbought Extreme and Oversold Extreme signals from the 15-minute Chaos.
Pros:
Remarkable precision in identifying market reversals.
Visually appealing and easily interpretable market conditions.
Suitable for both trend-following and counter-trend trading.
Robust back-testing results (nearly 95% accuracy on "Extreme" signals).
An all-encompassing indicator capable of supporting a livelihood through trading.
Cons:
In rare instances, even with Overbought "Extreme" and Oversold "Extreme" conditions, the indicator may lead to trading against a robust trend, resulting in significant drawdowns before eventual price reversal.
Overbought "Extreme" and Oversold "Extreme" signals can be infrequent when trading on the 15-minute timeframe and above. To mitigate this, it is advisable to trade at least 8 major currency pairs to receive "Extreme" signals with greater frequency."
? Giga Kaleidoscope Modularized Trading System
Core components of an NNFX algorithmic trading strategy
The NNFX algorithm is built on the principles of trend, momentum, and volatility. There are six core components in the NNFX trading algorithm:
1. Volatility - price volatility; e.g., Average True Range, True Range Double, Close-to-Close, etc.
2. Baseline - a moving average to identify price trend
3. Confirmation 1 - a technical indicator used to identify trends
4. Confirmation 2 - a technical indicator used to identify trends
5. Continuation - a technical indicator used to identify trends
6. Volatility/Volume - a technical indicator used to identify volatility/volume breakouts/breakdown
7. Exit - a technical indicator used to determine when a trend is exhausted
8. Metamorphosis - a technical indicator that produces a compound signal from the combination of other GKD indicators*
*(not part of the NNFX algorithm)
What is Volatility in the NNFX trading system?
In the NNFX (No Nonsense Forex) trading system, ATR (Average True Range) is typically used to measure the volatility of an asset. It is used as a part of the system to help determine the appropriate stop loss and take profit levels for a trade. ATR is calculated by taking the average of the true range values over a specified period.
True range is calculated as the maximum of the following values:
-Current high minus the current low
-Absolute value of the current high minus the previous close
-Absolute value of the current low minus the previous close
ATR is a dynamic indicator that changes with changes in volatility. As volatility increases, the value of ATR increases, and as volatility decreases, the value of ATR decreases. By using ATR in NNFX system, traders can adjust their stop loss and take profit levels according to the volatility of the asset being traded. This helps to ensure that the trade is given enough room to move, while also minimizing potential losses.
Other types of volatility include True Range Double (TRD), Close-to-Close, and Garman-Klass
What is a Baseline indicator?
The baseline is essentially a moving average, and is used to determine the overall direction of the market.
The baseline in the NNFX system is used to filter out trades that are not in line with the long-term trend of the market. The baseline is plotted on the chart along with other indicators, such as the Moving Average (MA), the Relative Strength Index (RSI), and the Average True Range (ATR).
Trades are only taken when the price is in the same direction as the baseline. For example, if the baseline is sloping upwards, only long trades are taken, and if the baseline is sloping downwards, only short trades are taken. This approach helps to ensure that trades are in line with the overall trend of the market, and reduces the risk of entering trades that are likely to fail.
By using a baseline in the NNFX system, traders can have a clear reference point for determining the overall trend of the market, and can make more informed trading decisions. The baseline helps to filter out noise and false signals, and ensures that trades are taken in the direction of the long-term trend.
What is a Confirmation indicator?
Confirmation indicators are technical indicators that are used to confirm the signals generated by primary indicators. Primary indicators are the core indicators used in the NNFX system, such as the Average True Range (ATR), the Moving Average (MA), and the Relative Strength Index (RSI).
The purpose of the confirmation indicators is to reduce false signals and improve the accuracy of the trading system. They are designed to confirm the signals generated by the primary indicators by providing additional information about the strength and direction of the trend.
Some examples of confirmation indicators that may be used in the NNFX system include the Bollinger Bands, the MACD (Moving Average Convergence Divergence), and the MACD Oscillator. These indicators can provide information about the volatility, momentum, and trend strength of the market, and can be used to confirm the signals generated by the primary indicators.
In the NNFX system, confirmation indicators are used in combination with primary indicators and other filters to create a trading system that is robust and reliable. By using multiple indicators to confirm trading signals, the system aims to reduce the risk of false signals and improve the overall profitability of the trades.
What is a Continuation indicator?
In the NNFX (No Nonsense Forex) trading system, a continuation indicator is a technical indicator that is used to confirm a current trend and predict that the trend is likely to continue in the same direction. A continuation indicator is typically used in conjunction with other indicators in the system, such as a baseline indicator, to provide a comprehensive trading strategy.
What is a Volatility/Volume indicator?
Volume indicators, such as the On Balance Volume (OBV), the Chaikin Money Flow (CMF), or the Volume Price Trend (VPT), are used to measure the amount of buying and selling activity in a market. They are based on the trading volume of the market, and can provide information about the strength of the trend. In the NNFX system, volume indicators are used to confirm trading signals generated by the Moving Average and the Relative Strength Index. Volatility indicators include Average Direction Index, Waddah Attar, and Volatility Ratio. In the NNFX trading system, volatility is a proxy for volume and vice versa.
By using volume indicators as confirmation tools, the NNFX trading system aims to reduce the risk of false signals and improve the overall profitability of trades. These indicators can provide additional information about the market that is not captured by the primary indicators, and can help traders to make more informed trading decisions. In addition, volume indicators can be used to identify potential changes in market trends and to confirm the strength of price movements.
What is an Exit indicator?
The exit indicator is used in conjunction with other indicators in the system, such as the Moving Average (MA), the Relative Strength Index (RSI), and the Average True Range (ATR), to provide a comprehensive trading strategy.
The exit indicator in the NNFX system can be any technical indicator that is deemed effective at identifying optimal exit points. Examples of exit indicators that are commonly used include the Parabolic SAR, the Average Directional Index (ADX), and the Chandelier Exit.
The purpose of the exit indicator is to identify when a trend is likely to reverse or when the market conditions have changed, signaling the need to exit a trade. By using an exit indicator, traders can manage their risk and prevent significant losses.
In the NNFX system, the exit indicator is used in conjunction with a stop loss and a take profit order to maximize profits and minimize losses. The stop loss order is used to limit the amount of loss that can be incurred if the trade goes against the trader, while the take profit order is used to lock in profits when the trade is moving in the trader's favor.
Overall, the use of an exit indicator in the NNFX trading system is an important component of a comprehensive trading strategy. It allows traders to manage their risk effectively and improve the profitability of their trades by exiting at the right time.
What is an Metamorphosis indicator?
The concept of a metamorphosis indicator involves the integration of two or more GKD indicators to generate a compound signal. This is achieved by evaluating the accuracy of each indicator and selecting the signal from the indicator with the highest accuracy. As an illustration, let's consider a scenario where we calculate the accuracy of 10 indicators and choose the signal from the indicator that demonstrates the highest accuracy.
The resulting output from the metamorphosis indicator can then be utilized in a GKD-BT backtest by occupying a slot that aligns with the purpose of the metamorphosis indicator. The slot can be a GKD-B, GKD-C, or GKD-E slot, depending on the specific requirements and objectives of the indicator. This allows for seamless integration and utilization of the compound signal within the GKD-BT framework.
How does Loxx's GKD (Giga Kaleidoscope Modularized Trading System) implement the NNFX algorithm outlined above?
Loxx's GKD v2.0 system has five types of modules (indicators/strategies). These modules are:
1. GKD-BT - Backtesting module (Volatility, Number 1 in the NNFX algorithm)
2. GKD-B - Baseline module (Baseline and Volatility/Volume, Numbers 1 and 2 in the NNFX algorithm)
3. GKD-C - Confirmation 1/2 and Continuation module (Confirmation 1/2 and Continuation, Numbers 3, 4, and 5 in the NNFX algorithm)
4. GKD-V - Volatility/Volume module (Confirmation 1/2, Number 6 in the NNFX algorithm)
5. GKD-E - Exit module (Exit, Number 7 in the NNFX algorithm)
6. GKD-M - Metamorphosis module (Metamorphosis, Number 8 in the NNFX algorithm, but not part of the NNFX algorithm)
(additional module types will added in future releases)
Each module interacts with every module by passing data to A backtest module wherein the various components of the GKD system are combined to create a trading signal.
That is, the Baseline indicator passes its data to Volatility/Volume. The Volatility/Volume indicator passes its values to the Confirmation 1 indicator. The Confirmation 1 indicator passes its values to the Confirmation 2 indicator. The Confirmation 2 indicator passes its values to the Continuation indicator. The Continuation indicator passes its values to the Exit indicator, and finally, the Exit indicator passes its values to the Backtest strategy.
This chaining of indicators requires that each module conform to Loxx's GKD protocol, therefore allowing for the testing of every possible combination of technical indicators that make up the six components of the NNFX algorithm.
What does the application of the GKD trading system look like?
Example trading system:
Backtest: Multi-Ticker CC Backtest
Baseline: Hull Moving Average
Volatility/Volume: Hurst Exponent
Confirmation 1: Advance Trend Pressure as shown on the chart above
Confirmation 2: uf2018
Continuation: Coppock Curve
Exit: Rex Oscillator
Metamorphosis: Baseline Optimizer
Each GKD indicator is denoted with a module identifier of either: GKD-BT, GKD-B, GKD-C, GKD-V, GKD-M, or GKD-E. This allows traders to understand to which module each indicator belongs and where each indicator fits into the GKD system.
? Giga Kaleidoscope Modularized Trading System Signals
Standard Entry
1. GKD-C Confirmation gives signal
2. Baseline agrees
3. Price inside Goldie Locks Zone Minimum
4. Price inside Goldie Locks Zone Maximum
5. Confirmation 2 agrees
6. Volatility/Volume agrees
1-Candle Standard Entry
1a. GKD-C Confirmation gives signal
2a. Baseline agrees
3a. Price inside Goldie Locks Zone Minimum
4a. Price inside Goldie Locks Zone Maximum
Next Candle
1b. Price retraced
2b. Baseline agrees
3b. Confirmation 1 agrees
4b. Confirmation 2 agrees
5b. Volatility/Volume agrees
Baseline Entry
1. GKD-B Baseline gives signal
2. Confirmation 1 agrees
3. Price inside Goldie Locks Zone Minimum
4. Price inside Goldie Locks Zone Maximum
5. Confirmation 2 agrees
6. Volatility/Volume agrees
7. Confirmation 1 signal was less than 'Maximum Allowable PSBC Bars Back' prior
1-Candle Baseline Entry
1a. GKD-B Baseline gives signal
2a. Confirmation 1 agrees
3a. Price inside Goldie Locks Zone Minimum
4a. Price inside Goldie Locks Zone Maximum
5a. Confirmation 1 signal was less than 'Maximum Allowable PSBC Bars Back' prior
Next Candle
1b. Price retraced
2b. Baseline agrees
3b. Confirmation 1 agrees
4b. Confirmation 2 agrees
5b. Volatility/Volume agrees
Volatility/Volume Entry
1. GKD-V Volatility/Volume gives signal
2. Confirmation 1 agrees
3. Price inside Goldie Locks Zone Minimum
4. Price inside Goldie Locks Zone Maximum
5. Confirmation 2 agrees
6. Baseline agrees
7. Confirmation 1 signal was less than 7 candles prior
1-Candle Volatility/Volume Entry
1a. GKD-V Volatility/Volume gives signal
2a. Confirmation 1 agrees
3a. Price inside Goldie Locks Zone Minimum
4a. Price inside Goldie Locks Zone Maximum
5a. Confirmation 1 signal was less than 'Maximum Allowable PSVVC Bars Back' prior
Next Candle
1b. Price retraced
2b. Volatility/Volume agrees
3b. Confirmation 1 agrees
4b. Confirmation 2 agrees
5b. Baseline agrees
Confirmation 2 Entry
1. GKD-C Confirmation 2 gives signal
2. Confirmation 1 agrees
3. Price inside Goldie Locks Zone Minimum
4. Price inside Goldie Locks Zone Maximum
5. Volatility/Volume agrees
6. Baseline agrees
7. Confirmation 1 signal was less than 7 candles prior
1-Candle Confirmation 2 Entry
1a. GKD-C Confirmation 2 gives signal
2a. Confirmation 1 agrees
3a. Price inside Goldie Locks Zone Minimum
4a. Price inside Goldie Locks Zone Maximum
5a. Confirmation 1 signal was less than 'Maximum Allowable PSC2C Bars Back' prior
Next Candle
1b. Price retraced
2b. Confirmation 2 agrees
3b. Confirmation 1 agrees
4b. Volatility/Volume agrees
5b. Baseline agrees
PullBack Entry
1a. GKD-B Baseline gives signal
2a. Confirmation 1 agrees
3a. Price is beyond 1.0x Volatility of Baseline
Next Candle
1b. Price inside Goldie Locks Zone Minimum
2b. Price inside Goldie Locks Zone Maximum
3b. Confirmation 1 agrees
4b. Confirmation 2 agrees
5b. Volatility/Volume agrees
Continuation Entry
1. Standard Entry, 1-Candle Standard Entry, Baseline Entry, 1-Candle Baseline Entry, Volatility/Volume Entry, 1-Candle Volatility/Volume Entry, Confirmation 2 Entry, 1-Candle Confirmation 2 Entry, or Pullback entry triggered previously
2. Baseline hasn't crossed since entry signal trigger
4. Confirmation 1 agrees
5. Baseline agrees
6. Confirmation 2 agrees

Triple Moving Averages + RSI Divergence + Trade Creator [CSJ7]This indicator uses triple moving averages to identify the prevailing trend, and calculates the linear regression of the closing price, and of the RSI, to either confirm the current trend direction, or to identify a potential trade reversal. Additionally, it includes a trade management tool that allows you to rate your trade setup according to your selected entry minimums and preferences, plus you obtain an estimated P&L with profitability metrics of your trade.
The key features are:
Dashboard : Includes entry/exit amounts, prices, quantities, estimated Profit & Loss, ROI, ROE, RRR, insights into market trends, entry conditions, and operational logs.
Trade Setup : Allows you to design your trade in detail. Select entry/exit levels, and let the tool suggest optimal target levels based on your ROI and RRR preferences. Specify your desired stop-loss type, and the tool will present the corresponding price.
Entry Conditions Management : Customize your trade entry prerequisites within the settings. The system evaluates these, offering a Trade Rating and displaying current values and entry statuses in the Entry Conditions table.
Trade Box : Visualize your trade strategy with a trade box that shows in alongside your chart, highlighting potential profit/loss zones and entry price points.
RSI & Close Price Linear Regressions : Calculates the linear regression of RSI and the close prices, since the beginning of the current trend, and presents them directly in the chart and alongside the active trend, to allow you to spot a potential trend continuation or reversal.
Adaptive price levels : The tool calculates the viability, trade rating and P&L based on contextual levels, like moving averages and highest or lowest prices, instead of using fixed prices; this allows for the results to adapt dynamically to market fluctuations, eliminating the need for manual recalibrations and adjustments.
Automatic Trade Side Detection : While manual input is available, the tool can intuitively determine the optimal trade side based on current data.
Market Outlook Events : By using the crossings of the three averages, the tool keeps track of the evolution of the current trend, providing points of interest like when the initial momentum is observed, when the trend initiates, when a potential entry zone starts, when a buy or sell opportunity arises and when the trend ends.
Alerts : You can set up two distinct alerts – one notifies on trend milestones and another for trade initiation conditions. Note: Manual activation is required in the Tradingview dashboard.
Logs : The tool provides a log section where you can find relevant information regarding the operation and any encountered errors via the dashboard's log section.
Usage
Choose your desired ticker and timeframe. If a tradable trend is detected and levels are set correctly, the trade box appears. Incorrect levels will trigger a warning in the error logs.
The tool will suggest the logical trade side, but manual adjustments are possible.
Customize ROI, maximum loss, and RRR in the settings. When in 'Auto', the tool will calculate the target price accordingly.
Adjust leverage to align with your risk and reward parameters.
View linear regressions for trend analysis and spotting RSI divergences.
Manage position sizing and risk in the settings, accounting for broker/exchange fees.
Activate alerts for trade notifications.
Enable 'Show Trade Levels' in settings to get the details of the necessary limit orders for the trade.
In the image below, you can view the expanded Trade Creator Dashboard, the Trade Box, and the Linear Regression Lines:
The linear regression lines are colored red when trending downward and green when trending upward.
The labels displaying information related to the entry and exit prices can be hidden, as demonstrated in the image above.

VWAP + 2 Moving Averages + RSI + Buy and SellIndicator: VWAP + 2 Moving Averages + RSI + Buy and Sell
Buy and Sell Arrows (Great for use alone or in conjunction with other scripts on the chart)
This indicator displays BUY (BUY) and SELL (SELL) arrows on the chart based on a combination of moving averages, VWAP and RSI. Arrows are a visual way to identify trading opportunities and can be useful for traders who want to follow a strategy based on these conditions.
The indicator uses two moving averages (20 and 50 periods) to identify upward crosses (buy) and downward crosses (sell). In addition, it takes into account VWAP (Volume Weighted Average Price) and RSI (Relative Strength Index) as additional filters to confirm buy and sell signals.
This script is great for use both independently and in conjunction with other indicators and strategies. You can combine it with other indicators and customize it to your preferences to create a more comprehensive trading strategy.
Please remember that this indicator is provided for educational purposes only and does not constitute financial advice. It is always recommended to carry out a thorough analysis before making any trading decisions.
Give this indicator a try and enjoy clear visualization of buy and sell arrows on your chart. Happy trading!

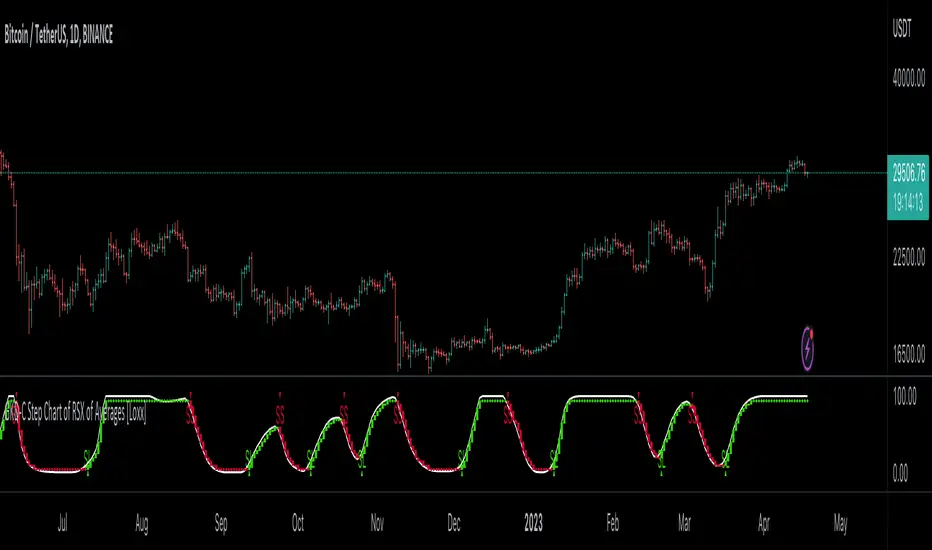
GKD-C Step Chart of RSX of Averages [Loxx]Giga Kaleidoscope GKD-C Step Chart of RSX of Averages is a Confirmation module included in Loxx's "Giga Kaleidoscope Modularized Trading System".
█ GKD-C Step Chart of RSX of Averages
What is the RSX?
The Jurik RSX is a technical indicator developed by Mark Jurik to measure the momentum and strength of price movements in financial markets, such as stocks, commodities, and currencies. It is an advanced version of the traditional Relative Strength Index (RSI), designed to offer smoother and less lagging signals compared to the standard RSI.
The main advantage of the Jurik RSX is that it provides more accurate and timely signals for traders and analysts, thanks to its improved calculation methods that reduce noise and lag in the indicator's output. This enables better decision-making when analyzing market trends and potential trading opportunities.
A Comprehensive Analysis of the stepChart() Algorithm for Financial Technical Analysis
Technical analysis is a widely adopted method for forecasting financial market trends by evaluating historical price data and utilizing various statistical tools. We examine an algorithm that implements the stepChart() function, a custom indicator designed to assist traders in identifying trends and making more informed decisions. We will provide an in-depth analysis of the code, exploring its structure, purpose, and functionality.
The code can be divided into two main sections: the stepChart() function definition and its application to charting data. We will first examine the stepChart() function definition, followed by its application.
stepChart() Function Definition
The stepChart() function takes two arguments: a floating-point number 'srcprice' representing the source price and a simple integer 'stepSize' to determine the increment for evaluating trends.
Within the function, five floating-point variables are initialized: steps, trend, rtrend, rbar_high, and rbar_low. These variables will be used to compute the step chart values and store the trends and bar high/low values.
The 'bar_index' variable is employed to identify the current bar in the price chart. If the current bar is the first one (bar_index == 0), the function initializes the steps, rbar_high, rbar_low, trend, and rtrend variables using the source price and step size. If stepSize is greater than 0, the variables are initialized using the rounded value of srcprice divided by stepSize, multiplied by stepSize. Otherwise, they are initialized to srcprice.
In the following part of the function, the code checks if the absolute difference between the source price and the previous steps value is less than the step size. If true, the current steps value remains unchanged. If not, the code enters a while loop that continues incrementing or decrementing the steps value by the step size until the absolute difference between the source price and the steps value is less than or equal to the step size.
Next, the trend variable is calculated based on the relationship between the current steps value and the previous steps value. The rbar_high, rbar_low, and rtrend variables are updated accordingly.
Finally, the function returns a list containing rbar_high, rbar_low, and rtrend values.
Application of the stepChart() Function
In this section, the stepChart() function is applied to the RSX of the smoothed moving average of the closing prices of a financial instrument. The moving average and RSX functions are used to calculate the moving average and RSX, respectively.
The stepChart() function is called with the RSX values and the user-defined step size. The resulting values are stored in the rbar_high, rbar_low, and rtrend variables.
Next, the bar_high, bar_low, bar_close, and bar_open variables are set based on the values of rbar_high, rbar_low, and rtrend. These variables will be used to plot the stepChart() on the price chart. The bar_high variable is set to rbar_high, and the bar_low variable is set to rbar_high if rbar_high is equal to rbar_low, or to rbar_low otherwise. The bar_close variable is set to bar_high if rtrend equals 1, and to bar_low otherwise. Lastly, the bar_open variable is set to bar_low if rtrend equals 1, and to bar_high otherwise.
Finally, we use the built in Pine function plotcandle to plot the candles on the chart.
The stepChart() function is an innovative technical analysis tool designed to help traders identify trends in financial markets. By combining the RSX and moving average indicators and utilizing the step chart approach, this custom indicator provides a visually appealing and intuitive representation of price trends. Understanding the intricacies of this code can prove invaluable for traders looking to make well-informed decisions
Core components of an NNFX algorithmic trading strategy
The NNFX algorithm is built on the principles of trend, momentum, and volatility. There are six core components in the NNFX trading algorithm:
1. Volatility - price volatility; e.g., Average True Range, True Range Double, Close-to-Close, etc.
2. Baseline - a moving average to identify price trend
3. Confirmation 1 - a technical indicator used to identify trends
4. Confirmation 2 - a technical indicator used to identify trends
5. Continuation - a technical indicator used to identify trends
6. Volatility/Volume - a technical indicator used to identify volatility/volume breakouts/breakdown
7. Exit - a technical indicator used to determine when a trend is exhausted
What is Volatility in the NNFX trading system?
In the NNFX (No Nonsense Forex) trading system, ATR (Average True Range) is typically used to measure the volatility of an asset. It is used as a part of the system to help determine the appropriate stop loss and take profit levels for a trade. ATR is calculated by taking the average of the true range values over a specified period.
True range is calculated as the maximum of the following values:
-Current high minus the current low
-Absolute value of the current high minus the previous close
-Absolute value of the current low minus the previous close
ATR is a dynamic indicator that changes with changes in volatility. As volatility increases, the value of ATR increases, and as volatility decreases, the value of ATR decreases. By using ATR in NNFX system, traders can adjust their stop loss and take profit levels according to the volatility of the asset being traded. This helps to ensure that the trade is given enough room to move, while also minimizing potential losses.
Other types of volatility include True Range Double (TRD), Close-to-Close, and Garman-Klass
What is a Baseline indicator?
The baseline is essentially a moving average, and is used to determine the overall direction of the market.
The baseline in the NNFX system is used to filter out trades that are not in line with the long-term trend of the market. The baseline is plotted on the chart along with other indicators, such as the Moving Average (MA), the Relative Strength Index (RSI), and the Average True Range (ATR).
Trades are only taken when the price is in the same direction as the baseline. For example, if the baseline is sloping upwards, only long trades are taken, and if the baseline is sloping downwards, only short trades are taken. This approach helps to ensure that trades are in line with the overall trend of the market, and reduces the risk of entering trades that are likely to fail.
By using a baseline in the NNFX system, traders can have a clear reference point for determining the overall trend of the market, and can make more informed trading decisions. The baseline helps to filter out noise and false signals, and ensures that trades are taken in the direction of the long-term trend.
What is a Confirmation indicator?
Confirmation indicators are technical indicators that are used to confirm the signals generated by primary indicators. Primary indicators are the core indicators used in the NNFX system, such as the Average True Range (ATR), the Moving Average (MA), and the Relative Strength Index (RSI).
The purpose of the confirmation indicators is to reduce false signals and improve the accuracy of the trading system. They are designed to confirm the signals generated by the primary indicators by providing additional information about the strength and direction of the trend.
Some examples of confirmation indicators that may be used in the NNFX system include the Bollinger Bands, the MACD (Moving Average Convergence Divergence), and the MACD Oscillator. These indicators can provide information about the volatility, momentum, and trend strength of the market, and can be used to confirm the signals generated by the primary indicators.
In the NNFX system, confirmation indicators are used in combination with primary indicators and other filters to create a trading system that is robust and reliable. By using multiple indicators to confirm trading signals, the system aims to reduce the risk of false signals and improve the overall profitability of the trades.
What is a Continuation indicator?
In the NNFX (No Nonsense Forex) trading system, a continuation indicator is a technical indicator that is used to confirm a current trend and predict that the trend is likely to continue in the same direction. A continuation indicator is typically used in conjunction with other indicators in the system, such as a baseline indicator, to provide a comprehensive trading strategy.
What is a Volatility/Volume indicator?
Volume indicators, such as the On Balance Volume (OBV), the Chaikin Money Flow (CMF), or the Volume Price Trend (VPT), are used to measure the amount of buying and selling activity in a market. They are based on the trading volume of the market, and can provide information about the strength of the trend. In the NNFX system, volume indicators are used to confirm trading signals generated by the Moving Average and the Relative Strength Index. Volatility indicators include Average Direction Index, Waddah Attar, and Volatility Ratio. In the NNFX trading system, volatility is a proxy for volume and vice versa.
By using volume indicators as confirmation tools, the NNFX trading system aims to reduce the risk of false signals and improve the overall profitability of trades. These indicators can provide additional information about the market that is not captured by the primary indicators, and can help traders to make more informed trading decisions. In addition, volume indicators can be used to identify potential changes in market trends and to confirm the strength of price movements.
What is an Exit indicator?
The exit indicator is used in conjunction with other indicators in the system, such as the Moving Average (MA), the Relative Strength Index (RSI), and the Average True Range (ATR), to provide a comprehensive trading strategy.
The exit indicator in the NNFX system can be any technical indicator that is deemed effective at identifying optimal exit points. Examples of exit indicators that are commonly used include the Parabolic SAR, the Average Directional Index (ADX), and the Chandelier Exit.
The purpose of the exit indicator is to identify when a trend is likely to reverse or when the market conditions have changed, signaling the need to exit a trade. By using an exit indicator, traders can manage their risk and prevent significant losses.
In the NNFX system, the exit indicator is used in conjunction with a stop loss and a take profit order to maximize profits and minimize losses. The stop loss order is used to limit the amount of loss that can be incurred if the trade goes against the trader, while the take profit order is used to lock in profits when the trade is moving in the trader's favor.
Overall, the use of an exit indicator in the NNFX trading system is an important component of a comprehensive trading strategy. It allows traders to manage their risk effectively and improve the profitability of their trades by exiting at the right time.
How does Loxx's GKD (Giga Kaleidoscope Modularized Trading System) implement the NNFX algorithm outlined above?
Loxx's GKD v1.0 system has five types of modules (indicators/strategies). These modules are:
1. GKD-BT - Backtesting module (Volatility, Number 1 in the NNFX algorithm)
2. GKD-B - Baseline module (Baseline and Volatility/Volume, Numbers 1 and 2 in the NNFX algorithm)
3. GKD-C - Confirmation 1/2 and Continuation module (Confirmation 1/2 and Continuation, Numbers 3, 4, and 5 in the NNFX algorithm)
4. GKD-V - Volatility/Volume module (Confirmation 1/2, Number 6 in the NNFX algorithm)
5. GKD-E - Exit module (Exit, Number 7 in the NNFX algorithm)
(additional module types will added in future releases)
Each module interacts with every module by passing data between modules. Data is passed between each module as described below:
GKD-B => GKD-V => GKD-C(1) => GKD-C(2) => GKD-C(Continuation) => GKD-E => GKD-BT
That is, the Baseline indicator passes its data to Volatility/Volume. The Volatility/Volume indicator passes its values to the Confirmation 1 indicator. The Confirmation 1 indicator passes its values to the Confirmation 2 indicator. The Confirmation 2 indicator passes its values to the Continuation indicator. The Continuation indicator passes its values to the Exit indicator, and finally, the Exit indicator passes its values to the Backtest strategy.
This chaining of indicators requires that each module conform to Loxx's GKD protocol, therefore allowing for the testing of every possible combination of technical indicators that make up the six components of the NNFX algorithm.
What does the application of the GKD trading system look like?
Example trading system:
Backtest: Strategy with 1-3 take profits, trailing stop loss, multiple types of PnL volatility, and 2 backtesting styles
Baseline: Hull Moving Average
Volatility/Volume: Hurst Exponent
Confirmation 1: Step Chart of RSX of Averages as shown on the chart above
Confirmation 2: Williams Percent Range
Continuation: Fisher Transform
Exit: Rex Oscillator
Each GKD indicator is denoted with a module identifier of either: GKD-BT, GKD-B, GKD-C, GKD-V, or GKD-E. This allows traders to understand to which module each indicator belongs and where each indicator fits into the GKD protocol chain.
Giga Kaleidoscope Modularized Trading System Signals (based on the NNFX algorithm)
Standard Entry
1. GKD-C Confirmation 1 Signal
2. GKD-B Baseline agrees
3. Price is within a range of 0.2x Volatility and 1.0x Volatility of the Goldie Locks Mean
4. GKD-C Confirmation 2 agrees
5. GKD-V Volatility/Volume agrees
Baseline Entry
1. GKD-B Baseline signal
2. GKD-C Confirmation 1 agrees
3. Price is within a range of 0.2x Volatility and 1.0x Volatility of the Goldie Locks Mean
4. GKD-C Confirmation 2 agrees
5. GKD-V Volatility/Volume agrees
6. GKD-C Confirmation 1 signal was less than 7 candles prior
Volatility/Volume Entry
1. GKD-V Volatility/Volume signal
2. GKD-C Confirmation 1 agrees
3. Price is within a range of 0.2x Volatility and 1.0x Volatility of the Goldie Locks Mean
4. GKD-C Confirmation 2 agrees
5. GKD-B Baseline agrees
6. GKD-C Confirmation 1 signal was less than 7 candles prior
Continuation Entry
1. Standard Entry, Baseline Entry, or Pullback; entry triggered previously
2. GKD-B Baseline hasn't crossed since entry signal trigger
3. GKD-C Confirmation Continuation Indicator signals
4. GKD-C Confirmation 1 agrees
5. GKD-B Baseline agrees
6. GKD-C Confirmation 2 agrees
1-Candle Rule Standard Entry
1. GKD-C Confirmation 1 signal
2. GKD-B Baseline agrees
3. Price is within a range of 0.2x Volatility and 1.0x Volatility of the Goldie Locks Mean
Next Candle:
1. Price retraced (Long: close < close or Short: close > close )
2. GKD-B Baseline agrees
3. GKD-C Confirmation 1 agrees
4. GKD-C Confirmation 2 agrees
5. GKD-V Volatility/Volume agrees
1-Candle Rule Baseline Entry
1. GKD-B Baseline signal
2. GKD-C Confirmation 1 agrees
3. Price is within a range of 0.2x Volatility and 1.0x Volatility of the Goldie Locks Mean
4. GKD-C Confirmation 1 signal was less than 7 candles prior
Next Candle:
1. Price retraced (Long: close < close or Short: close > close )
2. GKD-B Baseline agrees
3. GKD-C Confirmation 1 agrees
4. GKD-C Confirmation 2 agrees
5. GKD-V Volatility/Volume Agrees
1-Candle Rule Volatility/Volume Entry
1. GKD-V Volatility/Volume signal
2. GKD-C Confirmation 1 agrees
3. Price is within a range of 0.2x Volatility and 1.0x Volatility of the Goldie Locks Mean
4. GKD-C Confirmation 1 signal was less than 7 candles prior
Next Candle:
1. Price retraced (Long: close < close or Short: close > close)
2. GKD-B Volatility/Volume agrees
3. GKD-C Confirmation 1 agrees
4. GKD-C Confirmation 2 agrees
5. GKD-B Baseline agrees
PullBack Entry
1. GKD-B Baseline signal
2. GKD-C Confirmation 1 agrees
3. Price is beyond 1.0x Volatility of Baseline
Next Candle:
1. Price is within a range of 0.2x Volatility and 1.0x Volatility of the Goldie Locks Mean
2. GKD-C Confirmation 1 agrees
3. GKD-C Confirmation 2 agrees
4. GKD-V Volatility/Volume Agrees
]█ Setting up the GKD
The GKD system involves chaining indicators together. These are the steps to set this up.
Use a GKD-C indicator alone on a chart
1. Inside the GKD-C indicator, change the "Confirmation Type" setting to "Solo Confirmation Simple"
Use a GKD-V indicator alone on a chart
**nothing, it's already useable on the chart without any settings changes
Use a GKD-B indicator alone on a chart
**nothing, it's already useable on the chart without any settings changes
Baseline (Baseline, Backtest)
1. Import the GKD-B Baseline into the GKD-BT Backtest: "Input into Volatility/Volume or Backtest (Baseline testing)"
2. Inside the GKD-BT Backtest, change the setting "Backtest Special" to "Baseline"
Volatility/Volume (Volatility/Volume, Backte st)
1. Inside the GKD-V indicator, change the "Testing Type" setting to "Solo"
2. Inside the GKD-V indicator, change the "Signal Type" setting to "Crossing" (neither traditional nor both can be backtested)
3. Import the GKD-V indicator into the GKD-BT Backtest: "Input into C1 or Backtest"
4. Inside the GKD-BT Backtest, change the setting "Backtest Special" to "Volatility/Volume"
5. Inside the GKD-BT Backtest, a) change the setting "Backtest Type" to "Trading" if using a directional GKD-V indicator; or, b) change the setting "Backtest Type" to "Full" if using a directional or non-directional GKD-V indicator (non-directional GKD-V can only test Longs and Shorts separately)
6. If "Backtest Type" is set to "Full": Inside the GKD-BT Backtest, change the setting "Backtest Side" to "Long" or "Short
7. If "Backtest Type" is set to "Full": To allow the system to open multiple orders at one time so you test all Longs or Shorts, open the GKD-BT Backtest, click the tab "Properties" and then insert a value of something like 10 orders into the "Pyramiding" settings. This will allow 10 orders to be opened at one time which should be enough to catch all possible Longs or Shorts.
Solo Confirmation Simple (Confirmation, Backtest)
1. Inside the GKD-C indicator, change the "Confirmation Type" setting to "Solo Confirmation Simple"
1. Import the GKD-C indicator into the GKD-BT Backtest: "Input into Backtest"
2. Inside the GKD-BT Backtest, change the setting "Backtest Special" to "Solo Confirmation Simple"
Solo Confirmation Complex without Exits (Baseline, Volatility/Volume, Confirmation, Backtest)
1. Inside the GKD-V indicator, change the "Testing Type" setting to "Chained"
2. Import the GKD-B Baseline into the GKD-V indicator: "Input into Volatility/Volume or Backtest (Baseline testing)"
3. Inside the GKD-C indicator, change the "Confirmation Type" setting to "Solo Confirmation Complex"
4. Import the GKD-V indicator into the GKD-C indicator: "Input into C1 or Backtest"
5. Inside the GKD-BT Backtest, change the setting "Backtest Special" to "GKD Full wo/ Exits"
6. Import the GKD-C into the GKD-BT Backtest: "Input into Exit or Backtest"
Solo Confirmation Complex with Exits (Baseline, Volatility/Volume, Confirmation, Exit, Backtest)
1. Inside the GKD-V indicator, change the "Testing Type" setting to "Chained"
2. Import the GKD-B Baseline into the GKD-V indicator: "Input into Volatility/Volume or Backtest (Baseline testing)"
3. Inside the GKD-C indicator, change the "Confirmation Type" setting to "Solo Confirmation Complex"
4. Import the GKD-V indicator into the GKD-C indicator: "Input into C1 or Backtest"
5. Import the GKD-C indicator into the GKD-E indicator: "Input into Exit"
6. Inside the GKD-BT Backtest, change the setting "Backtest Special" to "GKD Full w/ Exits"
7. Import the GKD-E into the GKD-BT Backtest: "Input into Backtest"
Full GKD without Exits (Baseline, Volatility/Volume, Confirmation 1, Confirmation 2, Continuation, Backtest)
1. Inside the GKD-V indicator, change the "Testing Type" setting to "Chained"
2. Import the GKD-B Baseline into the GKD-V indicator: "Input into Volatility/Volume or Backtest (Baseline testing)"
3. Inside the GKD-C 1 indicator, change the "Confirmation Type" setting to "Confirmation 1"
4. Import the GKD-V indicator into the GKD-C 1 indicator: "Input into C1 or Backtest"
5. Inside the GKD-C 2 indicator, change the "Confirmation Type" setting to "Confirmation 2"
6. Import the GKD-C 1 indicator into the GKD-C 2 indicator: "Input into C2"
7. Inside the GKD-C Continuation indicator, change the "Confirmation Type" setting to "Continuation"
8. Inside the GKD-BT Backtest, change the setting "Backtest Special" to "GKD Full wo/ Exits"
9. Import the GKD-E into the GKD-BT Backtest: "Input into Exit or Backtest"
Full GKD with Exits (Baseline, Volatility/Volume, Confirmation 1, Confirmation 2, Continuation, Exit, Backtest)
1. Inside the GKD-V indicator, change the "Testing Type" setting to "Chained"
2. Import the GKD-B Baseline into the GKD-V indicator: "Input into Volatility/Volume or Backtest (Baseline testing)"
3. Inside the GKD-C 1 indicator, change the "Confirmation Type" setting to "Confirmation 1"
4. Import the GKD-V indicator into the GKD-C 1 indicator: "Input into C1 or Backtest"
5. Inside the GKD-C 2 indicator, change the "Confirmation Type" setting to "Confirmation 2"
6. Import the GKD-C 1 indicator into the GKD-C 2 indicator: "Input into C2"
7. Inside the GKD-C Continuation indicator, change the "Confirmation Type" setting to "Continuation"
8. Import the GKD-C Continuation indicator into the GKD-E indicator: "Input into Exit"
9. Inside the GKD-BT Backtest, change the setting "Backtest Special" to "GKD Full w/ Exits"
10. Import the GKD-E into the GKD-BT Backtest: "Input into Backtest"
Baseline + Volatility/Volume (Baseline, Volatility/Volume, Backtest)
1. Inside the GKD-V indicator, change the "Testing Type" setting to "Baseline + Volatility/Volume"
2. Inside the GKD-V indicator, make sure the "Signal Type" setting is set to "Traditional"
3. Import the GKD-B Baseline into the GKD-V indicator: "Input into Volatility/Volume or Backtest (Baseline testing)"
4. Inside the GKD-BT Backtest, change the setting "Backtest Special" to "Baseline + Volatility/Volume"
5. Import the GKD-V into the GKD-BT Backtest: "Input into C1 or Backtest"
6. Inside the GKD-BT Backtest, change the setting "Backtest Type" to "Full". For this backtest, you must test Longs and Shorts separately
7. To allow the system to open multiple orders at one time so you can test all Longs or Shorts, open the GKD-BT Backtest, click the tab "Properties" and then insert a value of something like 10 orders into the "Pyramiding" settings. This will allow 10 orders to be opened at one time which should be enough to catch all possible Longs or Shorts.
Requirements
Inputs
Confirmation 1: GKD-V Volatility / Volume indicator
Confirmation 2: GKD-C Confirmation indicator
Continuation: GKD-C Confirmation indicator
Solo Confirmation Simple: GKD-B Baseline
Solo Confirmation Complex: GKD-V Volatility / Volume indicator
Solo Confirmation Super Complex: GKD-V Volatility / Volume indicator
Stacked 1: None
Stacked 2+: GKD-C, GKD-V, or GKD-B Stacked 1
Outputs
Confirmation 1: GKD-C Confirmation 2 indicator
Confirmation 2: GKD-C Continuation indicator
Continuation: GKD-E Exit indicator
Solo Confirmation Simple: GKD-BT Backtest
Solo Confirmation Complex: GKD-BT Backtest or GKD-E Exit indicator
Solo Confirmation Super Complex: GKD-C Continuation indicator
Stacked 1: GKD-C, GKD-V, or GKD-B Stacked 2+
Stacked 2+: GKD-C, GKD-V, or GKD-B Stacked 2+ or GKD-BT Backtest
Additional features will be added in future releases.
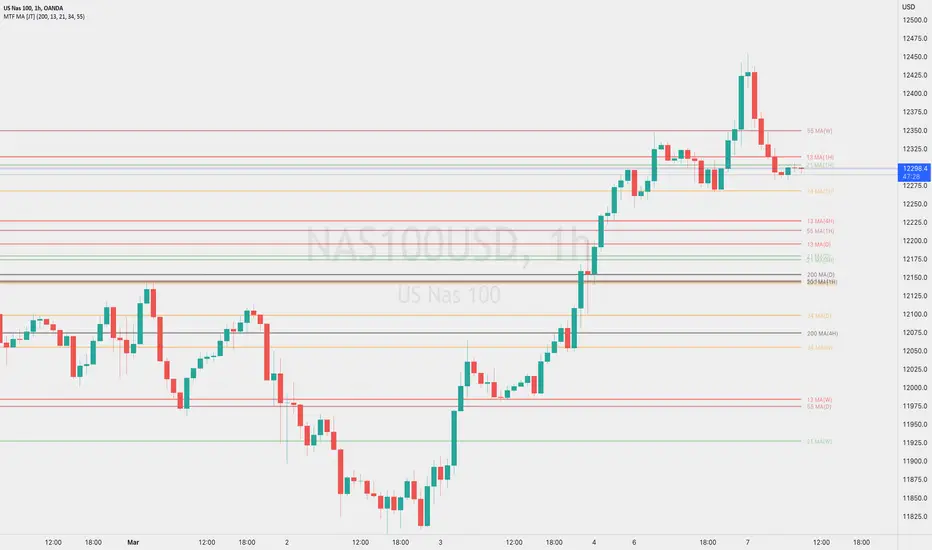
Multi Timeframe Moving AveragesThis indicator is designed to help traders analyze market trends by displaying five exponential moving averages (EMA) of their choice across four fixed intervals: weekly, daily, 4-hourly, and hourly.
The user can choose which moving averages and intervals to display, and can enable or disable these options as needed. The moving averages are drawn as lines and are updated in real-time based on the current EMA values in the respective intervals.
This indicator can help traders identify potential areas of support and resistance, as well as identify trends in the market. By displaying multiple EMAs across multiple time intervals, traders can get a more complete picture of the market and make more informed trading decisions.
[E5 Trading] Moving AveragesMoving Averages
Plot up to 12 moving averages and customize colors directly on the inputs tab.
Select from any of one of eight (8) moving averages types from the drop-down menu including 'EMA', 'HMA', 'LINREG', 'SWMA', 'SINE', 'SMA', 'VWMA', and 'WMA'.
Default 'SMA' for Plots 1 through 6, and default 'EMA' for plots 7 through 12.
Use this indicator to quickly transition between your favorite moving average combinations.
This indicator can also be used to create the Guppy Multiple Moving Average: www.investopedia.com
Definitions
'EMA' = Exponential Moving Average
'HMA' = Hull Moving Average
'LINREG' = Linear Regression Curve
'SWMA' = Symmetrically Weighted Moving Average
'SINE' = Sine Weighted Moving Average
'SMA' = Simple Moving Average
'VWMA' = Volume Weighted Moving Average
'WMA' = Weighted Moving Average

Odd_Moving AveragesMulti Moving Average Analysis
A highly customizable indicator to help discover moving averages being used in the market.
📈 Chart up to 15 Moving Averages in the same indicator
⏳ Changeable time frame resolution
Ⅲ Available types - Simple, Weighted, Volume-weighted
≡ Custom and pre configured length sets
🪄 Automatic hiding of moving averages a set % away from last price
🌈 14 selectable color sets for plot lines
🗻 Selectable themed legend of values
-Removes hidden values
-Selectable density of data
⇄ Selectable chart data locations

Moving Averages SelectionHello everyone, I present my first script. In it I collect a group of fully configurable moving averages, both in color, value and selection of the ones we want to observe.
The moving averages I collect are 3 of each of the following types:
EMA: An exponential moving average ( EMA ) is a type of moving average (MA) that places a greater weight and significance on the most recent data points.
SMA: It is simply the average price over the specified period. The average is called "moving" because it is plotted on the chart bar by bar, forming a line that moves along the chart as the average value changes.
HMA: The Hull Moving Average ( HMA ) attempts to minimize the lag of a traditional moving average while retaining the smoothness of the moving average line. Developed by Alan Hull in 2005, this indicator makes use of weighted moving averages to prioritize more recent values and greatly reduce lag.
RMA: The Rolling Moving Average, sometimes referred to as "Smoothed Moving Average", gives the recent prices most weighting, though the historic prices are also weighted, each given less weighting further back in time.
WMA: The weighted moving average ( WMA ) is a technical indicator that traders use to generate trade direction and make a buy or sell decision. It assigns greater weighting to recent data points and less weighting on past data points.
I am open to any opinion and advice for improvement, greetings, I hope you find it useful :)
Bermaui Variety Averages Bands [Loxx]Bermaui Variety Averages Bands is a reverse Bollinger Bands indicator with Loxx's Variety Moving Averages and Loxx's Expanded Source Types.
What are Bermaui Bands?
Bermaui Bands (BB) is a technical analysis tool that help filter between ranging and trending price movements. A buy signal is made when price crosses above the upper band, a sell signal is made when price crosses below the bottom band. The idea is when the bands are far apart, this is low volatility; when the bands are close together, this is high volatility.
Included
Loxx's Expanded Source Types
Loxx's Moving Averages
Alerts
Signals

Dragon Multi Moving Averages With labelThis script is for a many?! moving average strategy where the user can select from different types of moving averages, price sources, lookback periods and resolutions.
Features:
- 6 Moving Averages with variable MA types, periods, price sources, resolutions and the ability to disable each individually. Tow of moving averages are disable by default. you can enabel it
- Crossovers are plotted on the chart with detailed information regarding the crossover (Ex: 50 EMA crossed over 100 EMA ). there is only between 1-2, 2-3, 3-4, 4-5, 5-6 moving average cross label.
- Ribbons added and on by default. Optional setting to disable the ribbons. 5 ribbons between MA3 and MA4 and another 5 between MA4 and MA5 and another 5 between MA5 and MA6.

Multiple Moving AveragesBITSTAMP:BTCUSD This indicator consists on 9 independent Moving Averages and you can choose everything according to your needs.
There are a total of 9 Moving Averages and you can manipulate the Period, Source, TimeFrame, Smooth, and more.
It is good because if you need multiple Moving Averages and you have a free account on Trading View, you are limited to 3 Indicators.
Have fun with this!!

Dynamic Moving AveragesThis indicator uses what I call Dynamic Moving Averages to identify trends. The reason these moving averages are dynamic is that they track different sources based on the trend. Allow me to explain...
Low = identifies the least sellers were willing to sell for in a given period.
High = Identifies the most buyers were willing to buy for in a given period.
Avg Low = Shows the least sellers were willing to sell for over several periods.
Avg High = Shows the least buyers were willing to buy for over several periods.
If, in an uptrend, the closing price closes below the Avg Low, a trend change could be coming to the downside. If, in a downtrend, the closing price closes above the Avg high, a trend change could be coming to the upside.
This indicator uses a single moving average to identify the trend. If price is above this MA, we are in an uptrend. Below it, we are in a downtrend. I recommend using that 50 length as your trend. Any moving averages that are Dynamic, will track the low when above the Trend MA and track the High when below the trend MA.
When Price crosses a Dynamic Moving Average, the trend is likely changing. I recommend using 3 MAs at a time (trend + 2 shorter MAs), but I have provided 7 in total.

7 Moving Averages [Plus]Moving Averages are price based, lagging (or reactive) indicators that display the average price of a security over a set period of time. A Moving Average is a good way to gauge momentum as well as to confirm trends, and define areas of support and resistance. Essentially, Moving Averages smooth out the “noise” when trying to interpret charts. Noise is made up of fluctuations of both price and volume. Because a Moving Average is a lagging indicator and reacts to events that have already happened, it is not used as a predictive indicator but as an interpretive one for confirmations and analysis.
Bollinger Bands (BB) are a widely popular technical analysis instrument created by John Bollinger. The BB consist of a band of three lines which are plotted in relation to security prices. The line in the middle is usually a Simple Moving Average (SMA) set to a period of 20 days (the type of trend line and period can be changed by the trader; however a 20 day moving average is by far the most popular). The SMA then serves as a base for the Upper and Lower Bands which are used as a way to measure volatility by observing the relationship between the Bands and price. Typically the Upper and Lower Bands are set to two standard deviations away from the SMA (The Middle Line); however the number of standard deviations can also be adjusted by the trader.
This script shows 6 moving averages and Bollinger Bands.
Features:
- Standard MA inputs.
- MA type.
- MA period.
- MA source.
- MA resolution (time frame).
- MA Offset.
- Forecasting : forcasted prices are calculated using our MAType and MASource for the MAPeriod.
- Trail: Show only candles not included in the MA calculation.
The color of MA1 depends on the chosen strategy, by default this is the 3EMA strategy. You can also select "Pivot Point Supertrend" or "Ichimoku Trend"
Added "Parabolic Stop and Reverse (PSAR)" . The PSAR is a time and price technical analysis tool primarily used to identify points of potential stops and reverses. In fact, the SAR in Parabolic SAR stands for "Stop and Reverse". The indicator's calculations create a parabola which is located below price during a Bullish Trend and above Price during a Bearish Trend.
Added "Linear Regression Channel" which can be correctly plotted on logarithmic charts. A linear regression channel consists of a median line with 2 parallel lines, above and below it, at the same distance. Those lines can be seen as support and resistance. The median line is calculated based on linear regression of the closing prices but the source can also be set to open, high or low. The height of the channel is based on the deviation of price to the median line. Extrapolating the channel forward can help to provide a bias and to find trading opportunities.
