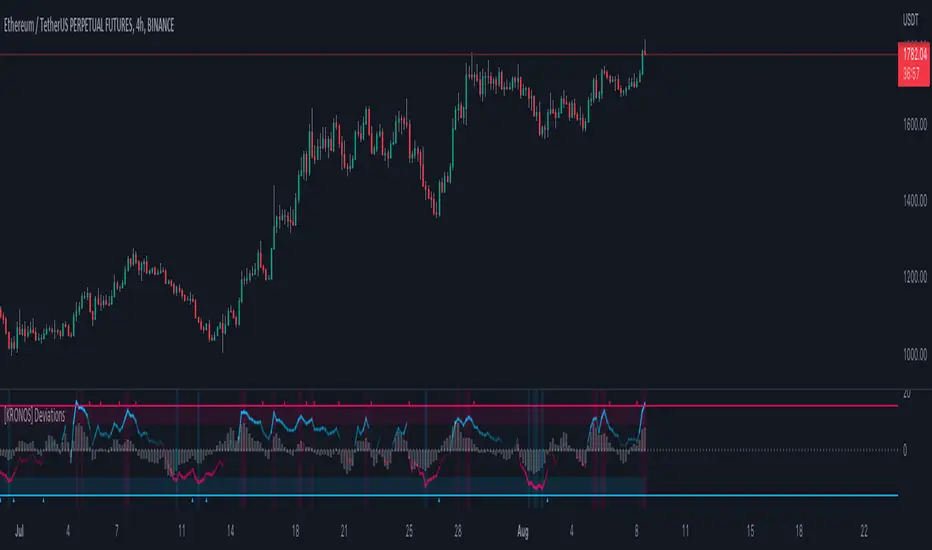
[KRONOS] DeviationsDescription
This indicator calculates the differences between the current price and the local support or resistance, and normalizes it into a range.
The value basis is calculated from a defined period of time that is then multiplied to get a standard deviations and a max. and min. value subtracted and divided into a final value.
It includes
Extreme zones. This value appears as blue and red lines which deviates from the oversold to overbought range.
Momentum. Lower time frame momentum is represented by a gray histogram as well as a signal line oscillating from a red to blue color.
Strong reversal. Red ( bearish ) and blue ( bullish ) columns will appear on the histogram when our algorithm detects that the strength of momentum is coming to an end indicative of a trend reversal.
Trend confirmation. Red or blue arrows will act as a trend confirmation.
Support and resistance . The zero line will frequently serve as a S/R area.
Divergences. You can use this indicator to detect potential pivot areas.
How to use?
Sell/Short when the histogram shows a red column and the signal line is in or above the overbought area (colored in red).
Buy/Long when the histogram shows a blue column and the signal line is in or below the oversold area (colored in blue).
extra tip: if you entered a trade based on the above conditions, you can partially increase your position each time you see a confirmation arrow.
Pesquisar nos scripts por "algo"
[KRONOS] MomentumDescription
This indicator is based on an algorithm which provides accurate momentum tracking on every timeframe. It is visualized as a colored histogram and through some other tools.
The value is calculated from an exponentially weighted moving average that is used to get a high and a low deviation, merging the last value into a range.
It includes
Overbought and oversold fixed areas. Their purpose is to facilitate the recognition of areas where the trend is likely to end or cool down. They are also marked with a background coloring.
Zero line. It typically represents a change of trend when the price crosses under or over it.
Volume shifts. Colored arrows will appear whenever a volume change is detected.
How to use?
Buy/Long on a blue confirmation arrow
Sell/Short on a red confirmation arrow
Take profit when the indicator starts showing a blue background
Take profit when the indicator starts showing a red background
extra tip: the zero line often acts as support / resistance similarly to the overbought and oversold areas

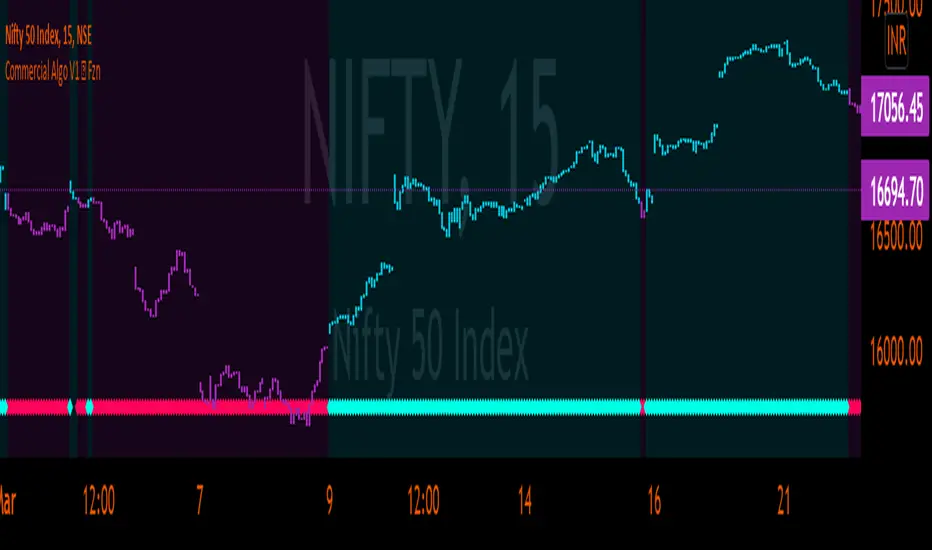
Commercial Algo Trend © Fzn V1Hello Traders,
Here i bring to you my 2nd Price Action Atr based Indictor combined with fib entry and exit trailing levels with minimum risk and maximum profit , as we must have seen at times as we enter the trend reverse and hits our stop losses . Keeping that in mind as i too struggled and made losses so i decided and focused more on minimizing the stop loss and only on confirmation of Long or Short trade is been initiated with proper Stop loss as explained in the images below , why should we give market our money ;) as we are here to make money :D .. There is no holy grail as Stop loss wont be hit but yes it will be way less and all alerts are based on candle close . One can use this on any chart and any timeframe and its very good for scalping too .ATR Trailing SL is added too just incase you want to enter and exit trend manually . Better results are on 15m and above . Hope you guys will like it and comment if you have any doubts..
-----------------
Disclaimer
Copyright by FaizanNawazz.
The information contained in my scripts/indicators/strategies/ideas does not constitute financial advice or a solicitation to buy or sell any securities of any type. I will not accept liability for any loss or damage, including without limitation any loss of profit, which may arise directly or indirectly from the use of or reliance on such information.
All investments involve risk, and the past performance of a security, industry, sector, market, financial product, trading strategy, or individual’s trading does not guarantee future results or returns. Investors are fully responsible for any investment decisions they make. Such decisions should be based solely on an evaluation of their financial circumstances, investment objectives, risk tolerance, and liquidity needs.
My scripts/indicators are only for educational purposes!
Happy Trading!
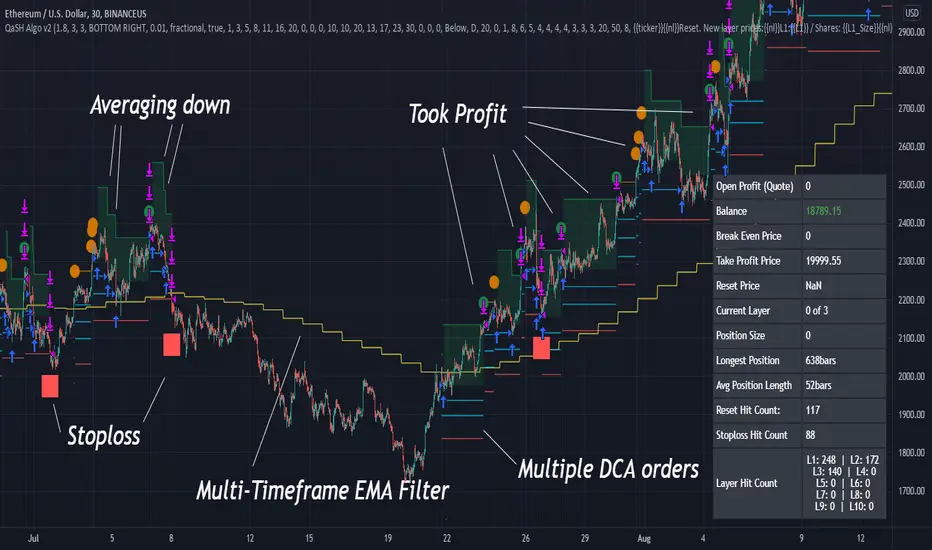
QaSH DCA Algorithm 2.0This is the strategy version of the QaSH DCA Algorithm indicator. This strategy version of the script includes live trading alert functionality, so it can be considered as a replacement that makes the indicator version obsolete. With this version, features have been added and also you can take advantage of TradingView's native backtesting system for more detailed backtest results.
QaSH DCA Algorithm implements a DCA strategy that takes advantage of price volatility by buying dips to average down, and adjusting price targets as the break-even price gets lower.
How does the DCA strategy work?
When the specified entry condition has occurred, the indicator will set up several limit orders below the current price. If price goes up a specified amount, then the layers will be overwritten at the higher prices. If price goes down and fills the first layer (limit order), then the Take Profit price is plotted and will be sent in an alert. If more layers are filled, then the TP price will move down accordingly as it’s based on the average entry price (alerts on each TP update). This action of lowering the average entry and TP price mitigates your risk, and increases the likelihood of a Take Profit event happening. This script uses a simple "ASAP" mode, where each deal will start exactly 2 bars after the last trade ended. An EMA filter and stoploss function was also added for risk management.
How does this differ from other DCA bots?
1) The layer placements, order volume , and “take profit %” for each layer or “safety order” is much more customizable than what you get from other services. For example, I can choose to have my TP% change, depending on how big the price dip was. Maybe on safety order 1 I want 10% TP, but on safety order 7 might want a 2% TP.
2) The entry condition is adjustable. For example, this script has an ema filter for entries.
3) Settings optimization. You can take advantage of the replay feature and TradingView's backtest system to see how trades would have played out, and how much PnL you would have made
4) You can use this indicator on more than just crypto. You can easily set up alerts for manual trades on stocks, or you can integrate it with your stock broker API of choice and automate your trades.
5) When combining this with an automation service, you will get unmatched execution speed by running it on your dedicated machine.
6) I can offer a lifetime subscription to the indicator upon request.
What kind of market is it best used on?
QaSH DCA Algorithm is best used on assets that are volatile. That means large and frequent swings up and down. Also I recommend running this on many uncorrelated assets at the same time. Better yet, run it with a variety of different settings simultaneously on the same asset.
What settings should I use?
The default settings are decent for most markets, and provide a good balance between profit potential and downside protection, although you can use a wide variety of settings. In a strong bull market its best to either bring up your layers to catch smaller dips, or you can go big on the first few layers (maybe 4 layers, 25% on each layer for example). In a sideways or brearish market you'll want more downside protection, so you'll want the larger orders to be at lower prices, or possibly use the stoploss and EMA filter.
BollingerBands Strat + pending order alerts via TradingConnectorSoftware part of algotrading is simpler than you think. TradingView is a great place to do this actually. To present it, I'm publishing each of the default strategies you can find in Pinescript editor's "built-in" list with slight modification - I'm only adding 2 lines of code, which will trigger alerts, ready to be forwarded to your broker via TradingConnector and instantly executed there. Alerts added in this script: 14, 17, 20 and 23.
SCRIPT INCLUDES PENDING ORDERS AND ALERTS! Alert will be sent to MetaTrader when order is triggered, but not yet filled. That means if market conditions change and order does not get filled, it needs to be cancelled as well, and there are alerts for that in the script as well.
How it works:
1. TradingView alert fires.
2. TradingConnector catches it and forwards to MetaTrader4/5 you got from your broker.
3. Trade gets executed inside MetaTrader within 1 second of fired alert.
When configuring alert, make sure to select "alert() function calls only" in CreateAlert popup. One alert per ticker is required.
Adding stop-loss, take-profit, trailing-stop, break-even or executing pending orders is also possible. These topics have been covered in other example posts.
This routing works for Forex, indices, stocks, crypto - anything your broker offers via their MetaTrader4 or 5.
Disclaimer: This concept is presented for educational purposes only. Profitable results of trading this strategy are not guaranteed even if the backtest suggests so. By no means this post can be considered a trading advice. You trade at your own risk.
If you are thinking to execute this particular strategy, make sure to find the instrument, settings and timeframe which you like most. You can do this by your own research only.

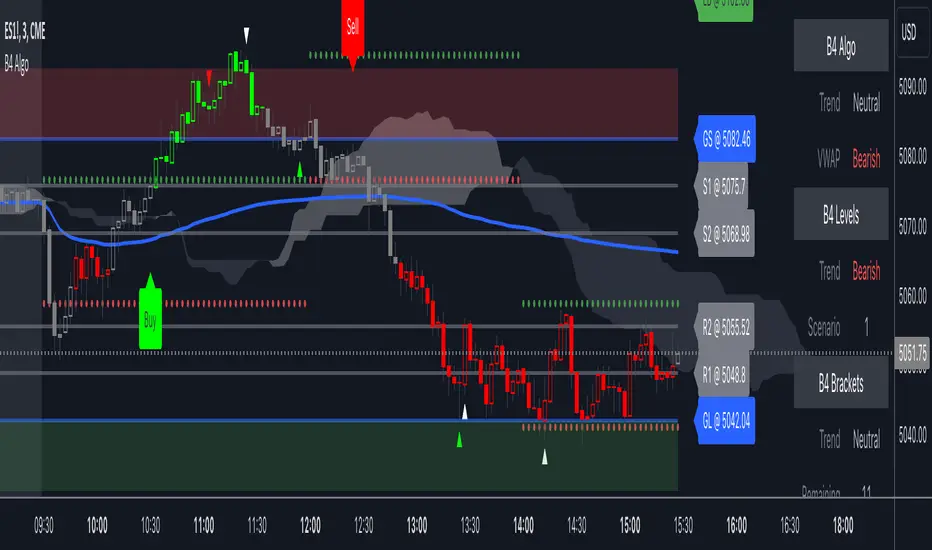
B4Signals Algo PremiumB4Signals Algo indicator is made up of more than 7+ innovative indicators carefully designed to generate high probability buy and sell signals while reducing risk. It derives its entries and exits from the B4Signals Indicator with added trend detection and volatility containment.
B4Signals Algo indicator detects the direction of trends for any asset and on any timeframe allowing traders to increase their confidence in positions, follow trends and stay in positions longer. Profit taking is up to the trader.
B4Signals Algo features:
Automatically generated buy and sell signals
Algo model selection in settings
Algo sensitivity selection in settings
Background chart shading for market hours
B4Signals Algo has two modes to choose from; each with an aggressive and a conservative approach to trading:
Algo 1 - Aggressive = Aims to detect very early trends, and is thus more reactive. Developed to catch both short term and long term trend reversal and provide clarity in the current trend direction. This setting attempts to make it easier to come in early in a new trend as well as to stay longer in that trend.
Algo 1 - Conservative = Aims to detect trend continuation where the stock price is likely to keep its current trend.
Algo 2 - Aggressive = Aims to detect very early confirmed trends, and is thus more reactive. Developed to catch both confirmed short term and confirmed long term trend reversals and provide confirmation in the current trend direction.
Algo 2 - Conservative = Aims to detect very early confirmed trends in conjunction with a filter to keep out false or choppy signals to leave the most accurate ones.
Disclaimer
Copyright by B4Signals.
The information contained in our scripts/indicators/ideas does not constitute financial advice or a solicitation to buy or sell any securities of any type. We will not accept liability for any loss or damage, including without limitation any loss of profit, which may arise directly or indirectly from the use of or reliance on such information.
All investments involve risk, and the past performance of a security, industry, sector, market, financial product, trading strategy, or individual’s trading does not guarantee future results or returns. Investors are fully responsible for any investment decisions they make. Such decisions should be based solely on an evaluation of their financial circumstances, investment objectives, risk tolerance, and liquidity needs.
Consecutive Up/Down Strat + alerts via TradingConnector to ForexSoftware part of algotrading is simpler than you think. TradingView is a great place to do this actually. To present it, I'm publishing each of the default strategies you can find in Pinescript editor's "built-in" list with slight modification - I'm only adding 2 lines of code, which will trigger alerts, ready to be forwarded to your broker via TradingConnector and instantly executed there. Alerts added in this script: 12 and 15.
How it works:
1. TradingView alert fires.
2. TradingConnector catches it and forwards to MetaTrader4/5 you got from your broker.
3. Trade gets executed inside MetaTrader within 1 second of fired alert.
When configuring alert, make sure to select "alert() function calls only" in CreateAlert popup. One alert per ticker is required.
Adding stop-loss, take-profit, trailing-stop, break-even or executing pending orders is also possible. These topics have been covered in other example posts.
This routing works for Forex, indices, stocks, crypto - anything your broker offers via their MetaTrader4 or 5.
Disclaimer: This concept is presented for educational purposes only. Profitable results of trading this strategy are not guaranteed even if the backtest suggests so. By no means this post can be considered a trading advice. You trade at your own risk.
If you are thinking to execute this particular strategy, make sure to find the instrument, settings and timeframe which you like most. You can do this by your own research only.

3Commas BotBjorgum 3Commas Bot
A strategy in a box to get you started today
With 3rd party API providers growing in popularity, many are turning to automating their strategies on their favorite assets. With so many options and layers of customization possible, TradingView offers a place no better for young or even experienced coders to build a platform from to meet these needs. 3Commas has offered easy access with straight forward TradingView compatibility. Before long many have their brokers hooked up and are ready to send their alerts (or perhaps they have been trying with mixed success for some time now) only they realize there might just be a little bit more to building a strategy that they are comfortable letting out of their sight to trade their money while they eat, sleep, etc. Many may have ideas for entry criteria they are excited to try, but further questions arise... "What about risk mitigation?" "How can I set stop or limit orders?" "Is there not some basic shell of a strategy that has laid some of this out for me to get me going?"
Well now there is just that. This strategy is meant for those that have begun to delve into the world of algorithmic trading providing a template that offers risk defined positions complete with stops, limit orders, and even trailing stops should one so choose to employ any of these criteria. It provides a framework that is easily manipulated (with some basic working knowledge of pine coding) to encompass ones own ideas and entry criteria, while also providing an already functioning strategy.
The default settings have a basic 1:1 risk to reward ratio, which sets a limit and a stop equal distance from the entry. The entry is a simple MA cross (up for long, down for short). There a variety of MA's to choose from and the user can define the lengths of the averages. The ratio can be adjusted from the menu along with a volatility based adder (ATR) that helps to distance a stop from support or resistance. These values are calculated off the swing low/high of the user defined lookback period. Risk is calculated from position entry to stop, and projected upwards to the limit as a function of the desired risk to reward ratio. Of note: the default settings include 0.05% commissions. Competitive commissions of the leading cryptocurrency exchanges are .1% round trip (one buy and one sell) for market orders. There is also some slippage to allow time for alerts to be sent and orders to fill giving the back test results a more accurate representation of real time conditions. Its recommended to research the going rates for your exchange and set them to default for the strategy you use or build.
To get started a user would:
1) Make a copy of the code and paste in their bot keys in the area provided under the "3Comma Keys" section
- eg. Long bot "start deal" copied from 3commas in to define "Long" etc. (code is commented)
2) Place alert on desired asset with desired settings ensuring to select "Order fills and alert() function calls"
3) Paste webhook into the webhook box and select webhook URL alerts (3rd party provided webhook)
3) Delete contents of alert message box and replace with {{strategy.order.alert_message}} and nothing else
- the codes will be sent to the webhook appropriately as the strategy enters and exits positions. Only 1 alert is needed
settings used for the display image:
1hr chart on BTCUSD
-ATR stop
-Risk adjustment 1.2
-ATR multiplier 1.3
-RnR 0.6
-MAs HEMA/SMA
-MA Length 50/100
-Order size percent of equity
-Trail trigger 60% of target
Experiment with your own settings on your crypto of choice or implement your own code!
Implementing your trailing stop (optional)
Among the options for possible settings is a trailing stop. This stop will ratchet higher once triggered as a function of the Average True Range (ATR). There is a variable level to choose where the user would like to begin trailing the stop during the trade. The level can be assigned with a decimal between 0 and 1 (eg. 0.5 = 50% of the distance between entry and the target which must be exceeded before the trail triggers to begin). This can allow for some dips to occur during the trade possibly keeping you in the trade for longer, while potentially reducing risk of drawdown over time. The default for this setting is 0 meaning unless adjusted, the trail will trigger on entry if the trailing stop exit method is selected. An example can be seen below:
Again, optional as well is the choice to implement a limit order. If one were to select a trailing stop they could choose not to set a limit, which could allow a trail to run further until hit. Drawdowns of this strategy would be foregoing locking gains at highs on target on other trades. This is a trade-off the user can decide on and test. An example of this working in favor can be observed below:
Conclusion
Although a simple strategy is implemented here, the benefits of this script allow a user a starting platform to build their strategies from with built in risk mitigation. This allows the user to sidestep some of the potential difficulties' that can arise while learning Pine and taking on the endeavor of automating their trading strategies. It is meant as an aid, a structure, and an educational piece that can be seen as a "pick-up-and-go" strategy with easy 3Commas compatibility. Additionally, this can help users become more comfortable with strategy alert messages and sending strings in the form of alerts from Pine. As well, FAQs are often littered with questions regarding "strategy.exit" calls, how to implement stops. how to properly set a trailing stop based on ATR, and more. The time this can save an individual to get started is likely of the best "take-aways" here.
Happy trading

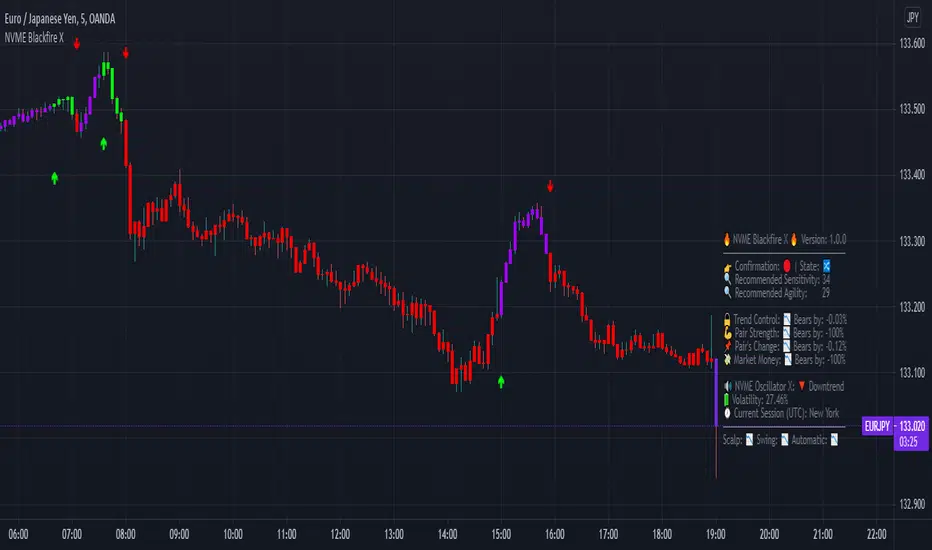
NVME Blackfire XNVME Blackfire X Indicator is a trend-confirmation indicator that includes Buy and Sell signals on the chart, Support & Resistance lines, Automatic Trendlines, Session Highs and Lows, Previous MTF Candle's Highs and Lows, Strategy Mode with Working Win/Loss Calculator, Built-In Position Size Calculator, Institutional Zones, Re-Entry Points and Filters, Customisable Market Dashboard and Alerts for Many Features.
The 2 main settings for the algorithm are 'Sensitivity' and 'Agility'. When you place Blackfire X onto your charts, you should be met automatically with the best settings we've found so far and don't worry if you are struggling to find settings because our system has an onboard system that provides you with an automatic "Best Settings" for the current pair that you are on. You can choose to enable this feature on the algorithm settings or simply see what is ideal on the dashboard too.
The 'Sensitivity' controls how quickly the algorithm responds to the market's trend changes. The higher the sensitivity, the less trades on the chart. The lower the sensitivity, the more trades you'll find on the chart.
The 'Agility' controls where the signals are placed within the trend change, a lower agility will give you signals closer to its reversal points and a higher agility will give you slower signals.
We also have the option to change the indicator to your trading style, there are four modes that heavily impacts the algorithm's calculations.
These are "default", "swing mode", "scalp mode", "strategy mode".
"Default" is our normal algorithm module that utilises the user's input to provide signals using a basic filtration system.
"Swing Mode" is our algorithm that has been modified to give signals that are more delayed for swing traders.
"Scalp Mode" is our algorithm that has been modified to give signals that are quick and fast for scalps.
"Strategy Mode" utilises our default mode but instead places the user in a mode where trades will only appear if a stop loss or a take profit area has been met by the price after the signal call.
Our third key option is our bar colour switches, there are multiple options such as "Cloud-Based", "Pivot Based", "S/R Based", "Change-Based" and "Two Colour Modes". NVME Blackfire X colours the candles in the direction of the trend and a green colour shows an uptrend, a purple colour shows an unconfirmed trend or often a ranging area and a red colour shows a downtrend.
We must let traders know that the signals should be used carefully and with a trader's strategy rather than following signals for the sake of it being printed there!
Since we want this algorithm to have necessary features and respond fast too, we have chosen only trend-following and analysis features that will be quick to use and easy to understand. We want this to be different from our Vanquisher X algorithm as that is a massive multi-tool full of features for traders to enjoy.
The first main feature is our 'Trend Cloud' system, it utilises two moving average plots that creates a cloud filling and with our algorithm you can customise both of the moving averages to any currently existing moving average in the PineScript Library.
The second feature is our 'Institutional Zones' system, which plots area of the market where the institutions have placed orders and these can be used as an extra support and resistance zone for trades. There is an input option that allows the user to get more or less zones and it is called "The Detection Strength", increasing this will show more zones whilst decreasing it will show less.
The third feature is our 'Automatic Trendlines' system, which utilises two input methods ('Trendline Period' and 'Trendline Detection Ratio'), the period controls how many bars of data to lookback to for the trend-lines and the detection ratio controls how many trend-lines are plotted onto the chart.
The fourth feature is our 'Session High and Lows' system, which plots the highest high and the lowest low of each session in the trading hours, these plots can be useful for breakout traders.
The fifth feature is our 'MTF Candle Info' system, which plots the candle's high and low or the candle's open and close for a timeframe and the previous candle of choice. This can also be used for breakout traders such as having a lower timeframe breakout for a higher timeframe plot.
The sixth feature is our 'Adaptive S/R Zones', which plots support and resistance zones into any market pair that are accurate points at which the market could react and reject from.
* Informative Market Dashboard *
Our simple panel on your chart displays the most relevant data from all of our features and calculations in real-time.
Confirmation
The confirmation simply tells the user what the previous signal was and this can be useful if the user may decide to have their signals turned off on the charts.
Market State
The market state informs the user the direction of the trend whether it be ranging, in an uptrend or downtrend, you'll see the emoji that corresponds to that.
Recommended Sensitivity
This feature will show the user what the recommended sensitivity is for the current pair that the user is on and the user may find this helpful if they don't know what settings to use.
Recommended Agility
This feature will show the user what the recommended agility is for the current pair that the user is on and the user may find this helpful if they don't know what settings to use.
Trend Control
The trend control feature calculates data using the user set bars back input and it determines all the factors within the trend to give you an informative response, an uptrend will have "Bulls by: " + percentage of control and a downtrend will have "Bears by" + percentage of control.
Pair Strength
The pair strength is measures the control of bulls or bears in the form of the market strength and it will give the same response as the trend control but the percentage will be based on the buying or selling pressure.
Pair's Change
The pairs change measures the change in price from point A to point B, if the change is greater than 0%, the dashboard will inform you that Bulls are in control, and if not the dashboard will inform you that Bears are in control.
Market Money
The market money measures the amount of volume and money that is going into the current asset and if the net change is greater than 0%, bulls will be in control, if not then bears are giving the market their money.
NVME Oscillator X
This is our very own oscillator that has been integrated into our dashboard, allowing the user to see the trend of our other indicator without having to fill their charts up with more noise. If the oscillator is in a downtrend then the dashboard will state that its in a downtrend and if it is in an uptrend then it will show an uptrend text.
Volatility
This feature measures the amount of volatility in any pair and provides user with the percentage value so they can see whether or not the market is extremely volatile at the current time.
Current Session
This feature will tell the user what session they are currently on such as London, Europe, New York, Asia, Australia.
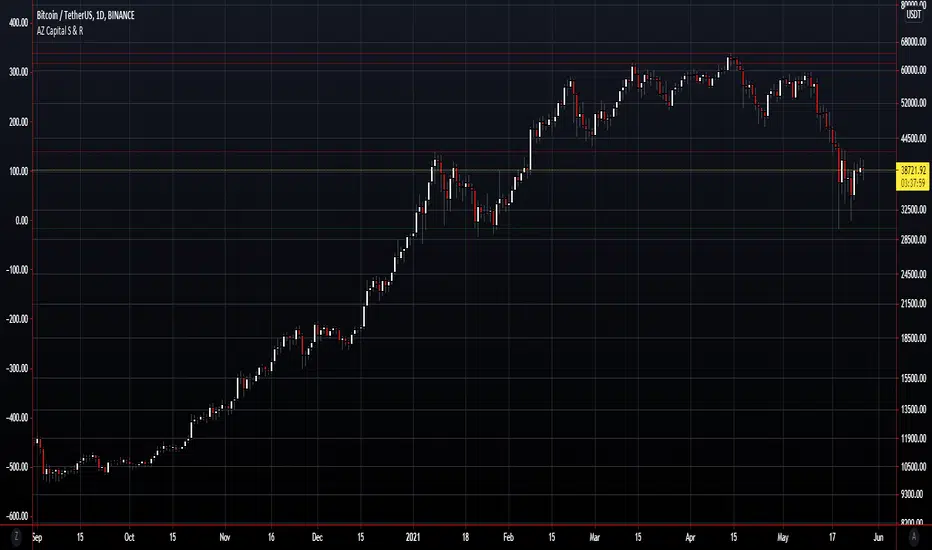
AZ Capital S & ROverview
The algorithm endeavours to robotize the identification of support and resistance levels by recognizing enormous swings/turns in authentic value activity.
These tops and bottoms in value activity shows where the bunches of buyers or sellers came into the market and may go about as future degrees of support or resistance.
The code identifies the last 3 huge swing highs and the last 3 swing lows. It at that point places lines on the outline to feature those levels.
In support and resistance hypothesis, frequently the support becomes resistance and the other way around. Along these lines, the algorithm doesn't just sort swings lows as "support" and swing highs as "resistance". All things considered, the algorithm takes a gander at the swing position comparative with the current close cost.
In the event that the price is over the level, the algorithm thinks of it as support. On the off chance that the price is beneath the level, the algorithm believes it to be resistance.
In light of this, the lines are naturally shaded by whether the prices are above or beneath the current close cost. At the point when any of the levels are beneath the nearby value, the lines are shaded green. Then again, at whatever point they are over the nearby, they are shaded red.
Spiral Guide Algorithm [V2]Spiral Guide Algorithm (SGA)
At its core, the Spiral Guide Algorithm is a low noise, un-bounded, oscillating cycle indicator designed to capture state change within a non-Gaussian distribution.
The idea, design, and application of the Spiral Guide Algorithm is rooted in first principles from four core areas of study, and in application proves to be an excellent trend following tool.
The Spiral Guide Algorithm produces and visualizes three principal components. Below we will cover each of those areas, as well as, how to apply this algorithm in trade analysis.
Principal Components
1. SGA Signal = waveform fundamental signal line
2. SGA Filtered Signal = finite impulse response filter of the SGA signal
3. SGA Histogram = delta between SGA signal and SGA filtered signal
Theory of Operation
1. Digital Signal Processing (DSP)
a. The SGA applies a DSP technique used in wireless transmission that decomposes a waveform into discrete components and then quantifies the interaction between each of those components.
2. Complex Systems Theory
a. In complex systems the tail often wags the dog and so SGA focuses not on the average of the distribution, but on the edges.
3. Game Theory
a. Positive feedback drives large changes from historical extremes, so targeting points of extreme oscillation offers the best chance of capturing large changes in the distribution.
4. Auction Theory
a. We know the auction process cycles between two phases:
i. At value
ii. Discovering value
b. SGA is designed to capture much of the “value discovery” phase between two “at value” areas.
Derivatives
1. When the SGA signal line is above 0 the time frame is up-trending
2. When the SGA signal line is below 0 the time frame is down-trending
3. A fundamental time frame shift is occurring when SGA signal line crosses 0
4. The ratio of SGA signal line time above 0 vs time below 0 will expose the current time frame bias (long, short, flat)
Application
1. Trades are signaled when the SGA signal line crosses the SGA filtered signal, and the trade is confirmed when the SGA filtered signal changes state.
2. Trades can be entered when the SGA signal line crosses 0.
3. SGA should align with the following before entering a trade: Structure, Cycles, Fractals.
4. The histogram is used for detecting divergence.
When and Where
1. Due to the large number of sample sets needed to calculate the SGA signal line, the SGA is designed for intraday charting.
2. Monitor multiple time frames around entry and exit time frame to satisfy the fractal requirements. As a rule, a 3-5x fractal above and below the entry and exit time frame is needed to align cycles.
3. For example:
a. Tick data or 1 second
b. 1 min
c. 5 min (entry/exit)
d. 15 min
4. This algorithm sees success in markets that are not mean reversion biased.
a. Trending markets with high volatility provide the best results.
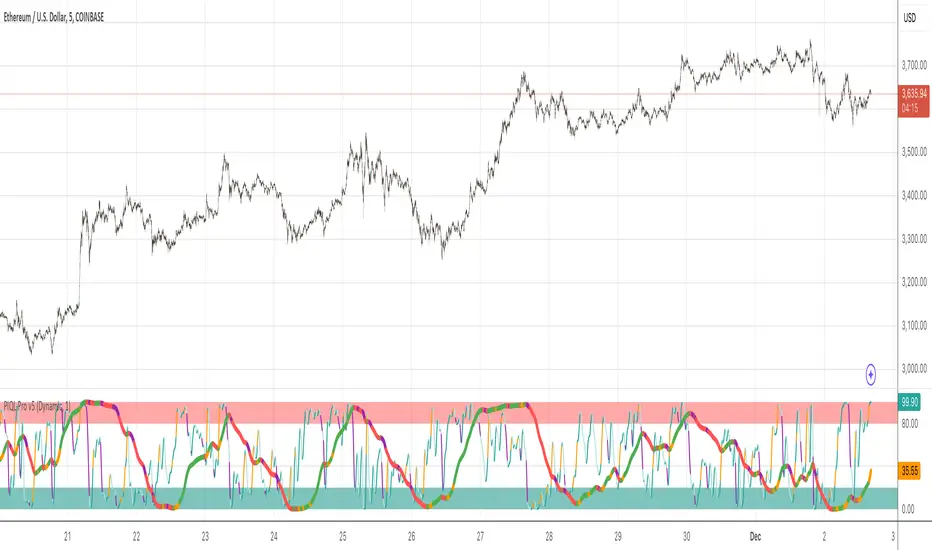
(FireflyTA) Algo Score MTFAlgo Score MTF
The Algo Score MTF is a meta-analytic oscillator telling you about the technical market strength . It is analyzing a variety of different indicators and metrics to come up with a score that gives you an impression on whether the medium timeframes have fuel to go higher or if it's running out and the risk increases to see corrective price action.
----------------------
About Technical Market Strength
Algo measures the technical strength with a score between -10 and 10 . A bullish or bearish technical market strength shows a high correlation with bullish or bearish PA soon after the score reaches the significant levels deviating from 0. However, optimal treshold values (meaning the score after which the strength can be considered bullish or bearish) vary depending on the market looked at. For BTCUSD, the default values used can be seen as reference. If you want to apply Algo to other markets, you will have to calibrate the tresholds yourself.
It is important to know that market strength is the fuel to drive price higher or lower, but it is not the trigger. The trend is of superior importance. So when price is in a strong uptrend (in this case on the MTF), and the score reaches a value of -4 or lower (which can be considered bearish), it can still take a while for the trend to shift because of the strong momentum. The score in this case can be used as an indicator to show you times when it is wise to take profits / de-risk or take extra care in your risk management in general.
----------------------
Indicators used
All the indicators mentioned are calculated separately and weighted by the significance value you can customize in the indicator UI. It is also possible to (1) deactivate certain indicators and (2) force them as required, so that a signal in the oscillator only occurs when the indicator(s) that is/are required support the thesis (bullish vs. bearish).
Daily VWAP
MTF Trend
Traditional Bollinger Bands
RSI
MTF RSI Divergence
Stoch RSI
Ichimoku Cloud
Fib Retracement Levels
MACD
TTM Squeeze
Moneyflow
Custom Levels you can define (3 categories: Major, medium, minor)
For some indicators, there are specific settings to customize how they contribute to the overall score (i.e. MACD cross vs. shift vs. trending phase). It is also important to know that Algo fetches the indicator data from multiple timeframes, thereby adding reliability to the overall results.
----------------------
Algo Custom Logic
Algo is using my custom logic on when a certain indicator can be interpreted as bullish or bearish in the MTF horizon. If you want to find out about the reliability of certain indicators, I recommend disabling all the indicators except for the one you want to examine, and then see how the score reacts to price action.
----------------------
Timeframes
Due to script limitations, this version can only analyze the medium timeframes . It is best used with charts 2H+, it works on some 90m as well but ceases to work at 1H and below . It is also not compatible with higher timeframes . Upon using the same settings on the same ticker with different timeframes, you will see that the score shows a minor variance. This is because data is consolidated to match the timeframe, so it ultimately leads to minor differences. Find out for yourself what timeframe is the best to use with which market and which settings.
----------------------
How to Use
I'm going to add tooltips for the settings in the indicator UI with upcoming updates, so it becomes more clear on how to set Algo up properly. To prevent a loss of your customized settings, write them down somewhere in case a script update reverts the settings back to default.
You can find in-depth tutorials on how to use this indicator by browsing the links and resources in my signature.

Percentile Rank Market FilterA simple script to filter bull and bear markets by using percentile rank filter. Using market regimes to filter by bull/bear/sideways markets helps to understand how your strategy will
behave in various market regimes and allows you to avoid unprofitable regimes and only trade in profitable ones.
The idea of market regime filtering is used in the most successful technical algorithmic trading strategies, as one should always design a trading strategy with a particular market in mind according to trading legend, Larry Connors
Feel free to use this script in your strategies to improve your profits and lower drawdowns.

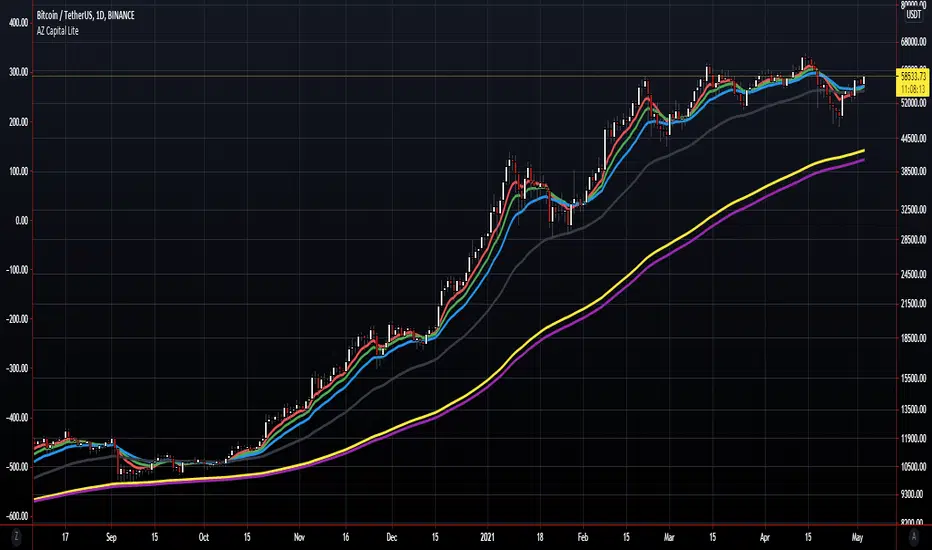
AZ Capital Lite 2.0
AZ Capital Lite 2.0 is the Updated Version of our Previous Lite Version of our trading algorithm/indicator. This algorithm is once again based on different indicators such as RSI and a combination of MA's along with ATR. Custom values that provide assistance to our PRO trading algorithm helping concluding analysis and finalising a trade even better.
AZ Capital Lite 2.0 combines various default indicators with custom values into One simple algorithm that helps the user to assess if an asset is moving upward or downwards.
AZ Capital Lite 2.0 works perfectly along with our AZ Capital PRO algorithm/indicator and helps the user to finalise the movement of an asset.
For Past Performances of this Algorithm/Indicator, Contact me Privately!
If you have any doubts on how to use the Algorithm/Indicator, Contact me Privately!
Commenting is RESTRICTED to only Comments about the Algorithm/Indicator and NOT asking for HOW-TO's and ACCESS!
Always DYOR and Trade Safely!
Regards,
Azyad (Founder of AZ Capital)

RogTrader HFT AlgoThis is a simple algorithm to generate Buy, Sell, Short, and Cover Signals. It uses the following:
RSI , MACD , Stochastic , Bollinger Bands , Ketler Channels, ATR Trailing Stop, Trend, and Volume .
Usage is simple: Green Background is Long and Red Background is Short positions.
LE = Long Entry
LX = Long Exit
SE = Short Entry
SX = Short Exit
This is not a trade recommendation, rather informative signals, and please do your due diligence. Thanks!

AZ Capital Lite
AZ Capital Lite is an additional feature of our AZ Capital PRO trading algorithm/indicator which is again based on different indicators such as RSI and EMA with custom values to provide assistance to our PRO trading algorithm helping in concluding analysis and finalising a trade.
RSI and EMA are two great indicators to access the movement of the asset and AZ Capital Lite makes those 2 different indicators into One simple indicator which helps the user to assess if an asset is moving upwards or downwards.
AZ Capital Lite also works along with our AZ Capital PRO algorithm/indicator helping to finalise the movement of an asset.
AZ Capital Lite is just using a customised and combined version of the regular EMA and RSI indicator available on TradingView.
For Past Performances of this Algorithm/Indicator, Contact me Privately!
If you have any doubts on how to use the Algorithm/Indicator, Contact me Privately!
Commenting is RESTRICTED to only Comments about the Algorithm/Indicator and NOT asking for HOW-TO's and ACCESS!
Always DYOR and Trade Safely!
Regards,
Azyad (Founder of AZ Capital)
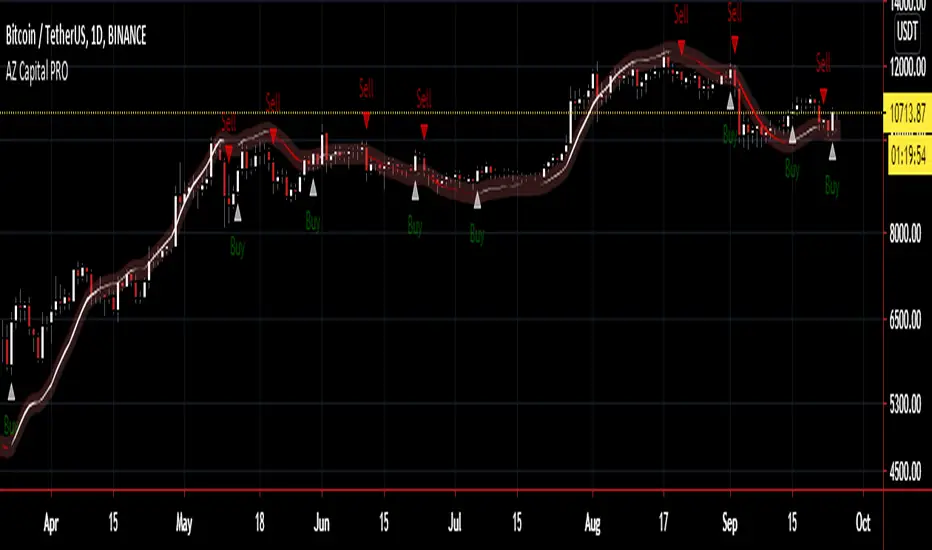
AZ Capital PRO
AZ Capital PRO is a Trading Algorithm/Indicator for TradingView that brings to the user the easiest way to trading.
The Algorithm depends on different indicators such as the EMA and TMA with custom values to point the user with the best occasions to set up a Long (Buy) or Short (Sell) position on any asset on the Financial Markets.
EMA and TMA are two great indicators to access the movement of the asset and AZ Capital PRO makes those 2 different indicators into One simple indicator which helps the user to access if an asset is moving upwards or downwards.
AZ Capital PRO is just using a customised and combined version of the regular EMA and TMA indicator available on TradingView.
Along with printing a Buy/Sell Signal on the Chart, AZ Capital PRO also indicates the trend.
Each sign in the chart will be shown while the candle is dynamic yet signs at candle close are conclusive and won't repaint. The Algorithm works with any candle accessible on whatever timeframe accessible for any market accessible in TradingView.
The Algorithm works best under littler timeframes since there's more information accessible than higher timeframes. For the most extreme benefit, check diverse periods for affirmation.
The Algorithm shows two unique signs for entry or exit on a resource to expand its gainfulness. Keep in mind, signs can show up whenever during an open candle, yet once the sign is displayed on the close candle; it's conclusive and won't change later on.
For the Algorithm/Indicator Past Performance, Contact me Privately!
If you have any doubts on how to use the Algorithm/Indicator, Contact me Privately!
Commenting is RESTRICTED to only Comments about the Algorithm/Indicator and NOT asking for HOW-TO's and ACCESS!
Always DYOR and Trade Safely!
Regards,
Azyad (Founder of AZ Capital)
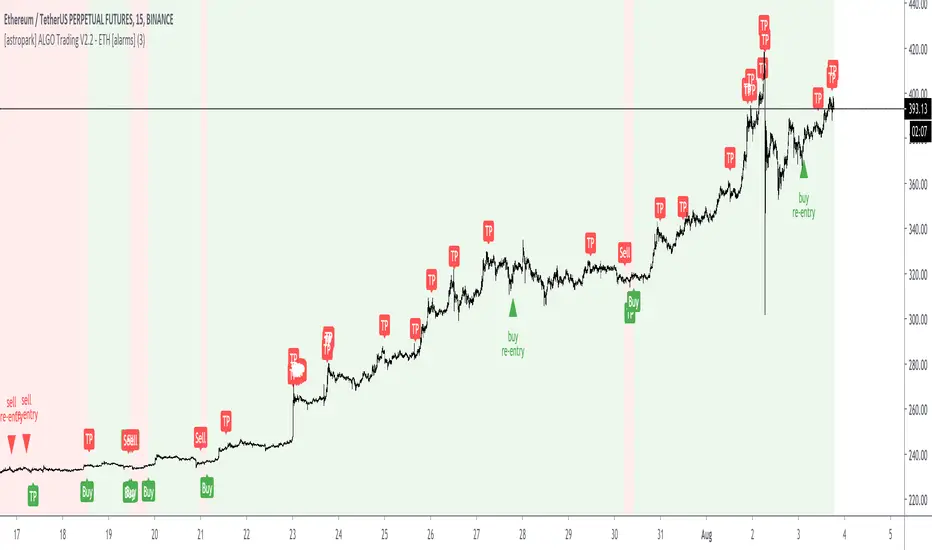
[astropark] ALGO Trading V2.2 - ETH [alarms]Dear Followers,
today another awesome Swing and Scalping Trading Strategy indicator : the upgraded version of ALGO Trading V2 for Binance Ethereum PERP on 15m timeframe!
It is runnable on a bot , just write me in order to help you do it.
If you are a scalper or you are a swing trader, you will love suggested entries for fast and long-lasting profit.
Keep in mind that a proper trailing stop strategy and risk management and money management strategies are very important (DM me if you need any clarification on these points).
This is an upgrade version of ALGO Trading V2 for Ethereum.
You can find ALGO Trading V2 indicator here below:
If you are interested in Bitcoin Trading, you will like for sure ALGO Trading V1.2, which is a customized version for Bitcoin trading:
This strategy has the following options:
enable/disable signals on chart
enable/disable bars and background coloring based on trend
enable/disable a Filter Noise option, which reduces overtrading
enable/disable a Trailing Stop option
enable/disable/config a Take Profit option, with Re-Entry
enable/disable a secret Smart Close Option which may improve profit on your chart (again, check it on you chart if it helps or not)
This strategy only trigger 1 buy (where to start a long trade) or 1 sell (for short trade). If you enable Take Profit / Stop Loss option, consider that many TP can be triggered before trend reversal, so take partial profit on every TP an eventually buy/sell back lower/higher on RE-ENTRY signal to maximize your profit.
This script will let you set all notifications you may need in order to be alerted on each triggered signals.
The one for backtesting purpose can be found by searching for the astropark's "ALGO Trading V2.2" and then choosing the indicator with "strategy" suffix in the name, or you can find here below:
This is not the "Holy Grail", so use proper money and risk management strategies.
This is a premium indicator , so send me a private message in order to get access to this script.
Stock Algorithm Trend AnalysisThis algorithm is meant to be used on stocks but also works well with cryptocurrencies, forex pairs and indexes. This software helps traders take advantage of momentum trading and by riding trends. It works best when playing the underlying symbol in a bullish sense when the algorithm says "likely to rise" and in a bearish sense when the algorithm says "likely to fall".
Send me a private message on TradingView to gain access.

Tradespot Quant Tradespot - Quant is an extensive trading algorithm, signal generator and technicals screener packed into one beautifully designed, functional indicator. The script is very customisable to not limit the trader using it but does have some very respectable settings for BTCUSD & ETHUSD on the 4H and 45M charts that we run in an automated fashion here a tradespot round the clock on Binance Futures.
What does Tradespot Quant do?
Trade following signals generated via our bespoke algorithm
Full customisation to allow a deeper use of the indicator across different assets
Beautifully illustrated 'Take Profit' and 'Stop Loss' levels that are configurable to easily see how successful the model can run
Presets for BTCUSD & ETHUSD on the 4H/45M timeframes avaliable instantly for your use.
Innovative trade panel that illustrates key information such as what trade the algorithm is looking for next? is altcoin trading deemed safe or risky right now? How are the technicals looking regarding the overal market trend?
More features being added all the time, we have great ideas and our only limitation is how fast we can program it!
Do you do a free trial?
Yes! Get in touch for a complimentary 48 hour free trial to the indicator, no strings attached.
Who are you?
Tradespot has been creating scripts for years on TradingView that we use to leverage our social trading and signal group offerings. We currently have over $200K in assets trading with our strategies across over 300 users.
You can learn more about us on our website. Please reach out to me or see the link on our profile.

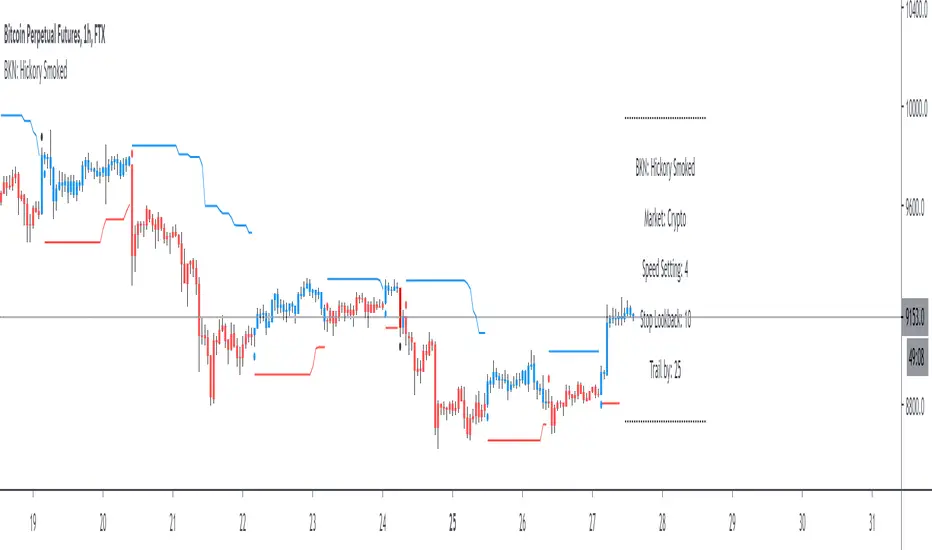
BKN: Hickory SmokedWelcome to the BKN: Hickory Smoked Indicator. This is an algorithmic indicator that thrives in trending environments. We've included settings for crypto and forex and speed options for lower timeframe entries.
The script offers a stop loss or trailing stop loss that will trigger when an entry is triggered. You can also choose to use it as long or short only.
This indicator is automation ready with alerts for both opening and closing positions.
***IMPORTANT***
For access, please do not comment below. Instead, send a DM here on TradingView or on my linked Twitter account.
LuxAlgo® - Signals & Overlays™Signals & Overlays™ is an all-in-one toolkit made up of more than 20+ features primarily focused on generating useful signals & overlays to fulfill any trader's technical analysis needs with relevant data.
Created directly with TradingView Pine Script Wizard, alexgrover - this is a first of its kind comprehensive script made fully from the ground-up to provide an all-in-one solution for traders.
Signals & Overlays™ can be used alongside other forms of technical analysis, however, it was also designed to be used as a stand-alone toolkit that can fit any trading style. Every feature included considers how not all technical indicators fit every market condition.
The ideal way to utilize this indicator is to explore through all of the features over time, pick & choose 2-3 features best suit your style of trading, and stick with those to create your own unique LuxAlgo trading strategy.
Providing Endless Possibilities Catering To All Trading Styles
Signals & Overlays™ works in any market for discretionary analysis & includes many features:
Beginner-friendly Presets to enable multiple features at once within one-click (locks other settings when enabled).
Confirmation Signals: Normal & Strong signals to help traders confirm trends (not to be followed blindly).
Contrarian Signals: Normal & Strong to help traders spot reversals (also not to be followed blindly).
Exit Signals: "x" marks that apply for both Confirmation Signals & Contrarian Signals to suggest potential take-profit areas during signals.
Signal Optimization Methods: Sensitivity / Agility, optimal sensitvity parameter displayed on dashboard, and Autopilot (dynamic setting).
Candle Coloring: Purple/Green/Red to visualize trends developing between 'normal' & 'strong'.
6+ Indicator Overlays that helps traders visualize trends, find reversal points, and get dynamic areas of support & resistance.
Filters within "Presets / Filters" to allow users to filter Confirmation Signals with Indicator Overlays & other metrics within LuxAlgo Premium.
A complete dashboard with highly actionable metrics such as Trend Strength, current volatility, volume analysis, etc.
Advanced Settings to display customizable TP/SL points, further enhance signal optimizations, & customize dashboard size/location.
Full Any Alert() Function Call Conditions included
Highly useful Filtered Alert Creator section to generate custom filtered signal alerts with Indicator Overlays & other metrics.
+ more. (Check the changelog below for current features)
🔶 USAGE
Basic Signals & Candle Coloring Demonstration
In the image below we can see a basic example of how these 2 core components function within Signals & Overlays™.
As explained earlier, the Confirmation Signals can generate normal labels as well as strong labels marked by the "+" symbol. These signals are directly correlated to the candle coloring in order to see the development of trends & navigate through different market conditions as best as possible.
The candle coloring comes especially in handy when using signals, whereas a positive sign for an uptrend to occur rather than a fake-out is to see candles consistently hold as green. This indicates the market is strong & is likely to continue an uptrend. Vice versa for sell signals & the candles holding as red.
Normal Confirmation Signals often occur with smaller trends, retracements within larger trends, or just as signals a user may not want to trust as much directly. In order to enhance your ability to trust signals more & find more actionable use cases out of LuxAlgo Premium, we recommend going to the settings menu of the indicator & activating some indicator overlays. These are covered in the next section.
🔶 INDICATOR OVERLAYS W/ SIGNALS
In the image below we have enabled the "Smart Trail" & "Reversal Zones" indicator overlays from within the settings of Signals & Overlays™. By using these overlays alongside the signals & candle coloring, users can find more confluence to create trading strategies or plans.
The Smart Trail provides an excellent area of dynamic support/resistance for traders, as well as an additional confluence for general trend following purposes alongside the Confirmation Signals.
The Reversal Zones are particularly useful for areas to immediately take profit on trades, however, during strong trends price may continue rising or falling through the Reversal Zones which makes a good use case of waiting for price to first exit the Reversal Zones before considering the next move in the market.
In the next image below we can see the market is generally ranging, making it more complicated for the standard Confirmation signals to perform greatly as they are meant to excel for finding developing trends. This image displays the Contrarian Signal Mode, Contrarian Gradient candle coloring, as well as the Trend Catcher Indicator Overlay to help us trade these market conditions specifically.
Paired with the Contrarian based candle coloring, these signals can be helpful to a trader looking to find confluent reversals. You can also see the Trend Catcher indicator overlay gives a hybrid approach to analyzing the underlying trend within this price action.
Some traders naturally are Contrarian in nature, so this signal mode may be of primary interest to them, however, most of the use cases will come from the standard Confirmation sigals paired with other overlays or regular technical analysis.
🔶 SIGNALS WITH AI CLASSIFICATION
Our toolkit is able to classify generated signals using a simple machine learning algorithm into four levels. These levels indicate if a signal will most likely indicate a trend continuation (level 3/4) or a reversal/retracement (1/2).
Users are able to filter out certain signals depending on their classification, only keeping signals of interest and potential filtering out false signals.
🔶 FILTERS
In the next image below we can see after resetting the Signals & Overlays™ indicator to it's defaults, we have simply enabled the "Smart Trail Filter" from within the Presets / Filters section at the top of the settings.
By doing this, we can filter out signals that are not aligned with the Smart Trail indicator overlay, which gives direct confluence in every signal that generates on the chart.
Applying filters to signals do not necessarily make them instantly "better" than using the indicator without them. Between every technical indicator, there are trade-offs. So while we can now use Confirmation signals & retests of the Smart Trail as great optimal entry points, at times the indicator may miss signals or retests of the Smart Trail.
The same is seen below with another one of the Filters within Signals & Overlays™; Trend Strength Filter.
We can see the indicator is using the Trend Strength metric to only generate Confirmation Signals that align with a trending market which can clean up a lot of noise during retracements as well as ranging markets.
However, the trade-off present now with this filter enabled is that at times the indicator will miss trends, in which we'd still need to be aware of the price action, candle coloring, or other forms of analysis to give us indications the market may start a new trend opposed to just relying on signals directly.
🔶 CONCLUSION
We believe that success lies in the association of the user with the indicator, opposed to many traders who have the perspective that the indicator itself can make them become profitable. The reality is much more complicated than that.
The aim is to provide an indicator comprehensive, customizable, and intuitive enough that any trader can be led to understand this truth and develop an actionable perspective of technical indicators as support tools for decision making.
You can see the Author's instructions below to get instant access to this indicator & our LuxAlgo Premium indicator suite.
🔶 RISK DISCLAIMER
Trading is risky & most day traders lose money. All content, tools, scripts, articles, & education provided by LuxAlgo are purely for informational & educational purposes only. Past performance does not guarantee future results.

Reticulata Enhanced - StudyBuilding on our core script - Reticulata, the enhanced version features several requested extras to give you more flexibility with your trading style.
What is Reticulata Enhanced?
The Reticulata core leverages a blend of MA/RSI strategies mixed with the BBB optimised logic for risk management. This enhanced version takes it a step further with additional risk management features:
Trailing Stop
Fixed Stop
Fixed Stop, but move at TP
Trend confirmation
Usage
Using the indicator is as simple as:
1. Select the strategy, or combination of strategies you want to use
2. If desired, select one or more of the available trend filters
3. Adjust your stop options
4. Review backtest results
Markets
Like the core, the enhanced algo also supports a range of markets and timeframes, including the majors ( EURUSD , etc...) in Forex and a variety of Cryptocurrencies including Bitcoin (BTC/XBT etc...).
All of our scripts are designed for manual traders but are ready to use with automated trading bots.
PM us to obtain access.
