Action Section, Volatility Choppiness Indicator (by ChartArt)Here is a solution to find entry points to trade. This indicator highlights price sections with low choppiness, where both the ADX (Average Directional Index) indicator shows strong movement (up or down!) in the price and a customized Money Flow indicator (which uses only the change of the volume not the change of the price, hence a Volume Flow indicator), also shows volatility is present. Using higher filter values than the default setting of "30" reduces the noise, but also shows less 'action sections'. Vice versa using values lower than "30" increases the amount and duration of action sections which are shown.
The "action section" indicator does not show the direction if the price is going up or down. It shows if there is enough action worthy the time to trade (lower odds of a neutral sideways trend). Therefore in addition a Heikin-Ashi based price change indicator can optionally be plotted, which shows the actual direction of the price.
Action Section, High Volume Volatility & Low Price Choppiness Indicator
This indicator works only on charts which have volume data.
Pesquisar nos scripts por "Volatility"

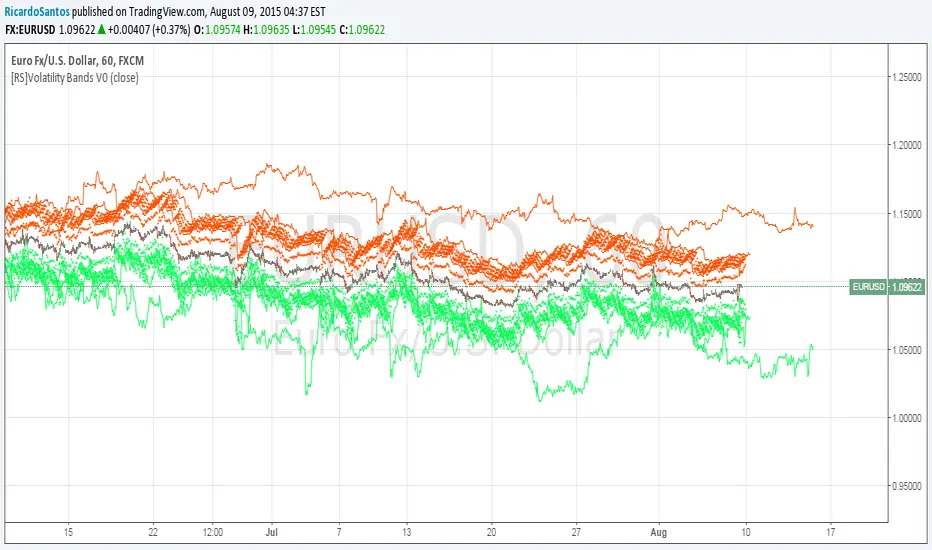
[RS]Volatility Bands V0EXPERIMENTAL:
Displays Volatility Cycles and forecasts maximum volatility expectancy for a predetermined time frame.
ATR Safe/Danger Volatility FilterATR Safe/Danger Volatility Filter colour coded on 50 ema red to show spikes
Harry Dunn Volatility BandsEnter strike price and 2 percentage numbers to automatically calculate and draw volatility bands on chart.

Vo-S-Di-T-I - Volatility Scaled Directional Trend IndicatorThis code represents just the foundation for what's to come. It lays the groundwork for a more sophisticated quant trading model, offering a glimpse into the potential of future developments. I hope my contribution to this community will be valued. I'm here for idea exchanges and coding together, with the key emphasis on ensuring everything we do is grounded on a solid statistical basis.
----------------------------------------------------------------------------------------------------------------------
The developed code is based on a rigorous quantitative approach for analyzing price trends in the equity sector, utilizing advanced statistical methodology to scale returns based on the volatility observed over predefined periods of 20 and 50 days. This technique for normalizing returns allows us to eliminate distortions due to the intrinsic variability of prices and focus on the underlying structure of price behavior. The primary goal of the code is not to speculatively predict future market movements but rather to identify potential reversal trend signals through price dynamics analysis, within an optimized risk and return context.
Our approach is distinguished by the use of statistical decomposition techniques and time series analysis to interpret price variations as indicators of possible shifts in market behavior. This allows distinguishing between random or short-term price movements and true trend changes, providing a solid foundation for more informed investment decisions.
The current code represents the initial phase of a broader project that envisages the integration of machine learning algorithms to further refine the ability to detect significant changes in price trends. Through the application of predictive models and machine learning techniques, we intend to explore complex patterns in historical price data that may precede trend reversals, always respecting the principles of rigorous statistical analysis and risk management. This development and learning path will allow us to continuously improve investment strategies, leveraging the analytical capabilities of modern data science algorithms applied to the financial sector.
HOW TO READ
Simply put, Z values above 0 indicate an uptrend, while values below indicate a downtrend. IMPORTANT: It is not necessary to consider any crosses between Z-Short and Z-Long, but only potential crosses with 0.
The initial values are set at 20 and 50, but everyone is free to choose the most suitable periods, as long as all choices have valid statistical significance. My advice is to use R or MatLab to explore the best correlation between N and price movements. The reason I have set two values for N (Short and Long) is because it's interesting to assess short-term and medium-to-long-term trends to understand if price movements can lead to reversals only in the short term or also in the medium to long term. This idea came to me because I believe all other trend determination systems have too much lag and unpredictability.

Qullamaggie ADR and Volatility and Price Change IndicatorElevate your trading strategy with Qullamaggie ADR, a dynamic indicator inspired by the Kristjan Qullamaggie trading approach. Gain a deeper understanding of market dynamics, daily price movements, and potential turning points.
Key Features:
Qullamaggie ADR: Assess market volatility through the QullaADR, offering customizable time intervals (5, 10, 15, 20 days) to adapt to various trading styles.
Today's Change: Monitor price changes relative to the low of the current trading day, providing valuable intraday insights.
PrevDay price differentials from the previous day's low, aiding in the identification of potential trend reversals.
Track the percentage change from the opening price, offering a snapshot of intraday market sentiment.
Percent from 10-day SMA: Visualize the percentage difference between the closing price and a 10-day Simple Moving Average (SMA), a key trend-following indicator.
Usage:
Utilize QullaADR to set realistic profit targets and stop-loss levels based on current market conditions.
Identify potential trend shifts by observing changes from the previous day's low with Today's QullaChange.
Incorporate QullaPercent from 10-day SMA for trend confirmation and well-informed trading decisions.
Strategy Inspiration:
QullaADR draws inspiration from the Kristjan Qullamaggie trading strategy, aiming to complement your trading toolkit and enhance decision-making.
Disclaimer:
Trading involves risk, and past performance is not indicative of future results. Use this indicator as a supplementary tool within a comprehensive trading strategy.
Version: 1.0

volume and volatility detectorThis indicator can detect whether the market is active or not.
1. The green area indicates that the current market is active.
2. The volatility and market volume activity of the desktop will change color (green indicates active, red indicates inactive). You should try to avoid trading when the market is inactive.
3. the bright red and blue volume columns indicate that the current volume is relatively large.

Exponential Regression Channel with novel volatilityThis code is a modified version of the built-in "linear regression" script of Tradingviews which can be plotted correctly on logarithmic charts
The log reg code of Forza was adjusted by altustro to generate an exponential regression (or a correct linear regression on the log scale, this is equivalent).
The standard deviation in the log scale is a better volatility measure which we call novola, and which defines the trend channel displayed in addition to the main indicator.
The exponential regression slope and channel also defines the typical holding time of the stock and the SL/TP boundaries, which are calculated and displayed at the last bar.
The display works both in log and regular scale. But only in the log scale it can be compared to the linear extension, which can also be plotted when activated in the properties.
The underlying exponential fit can not be displayed in regular scale as only lines can be plotted by TV. But with the related script Exponental Regression also the exponential regression can be exactly displayed using a workaround.

Volume, Momentum and Volatility weighted moving averageMoving averages are filters on price data. This moving average creates a filter which factors in:
- the price RSI or it's Momentum
- the volume RSI
- the RVI or Volatility
Each factor is put through a least squares filter to smooth them first.
Then the factors are used to build a coefficient for an exponentially weighted average.
The chart above shows a comparison of standard average types with this script.
This is useful if you are looking for a moving average based trigger and do not wish to react to candle noise price action.

Candle-Box RatioVolatility compression/expansion indicator calculated from the ratio of the area of the candles to the area of a rectangle encompassing the candles over n bars.
Generally during a squeeze or compression the ratio between the candles and the rectangular area increases, ie the candles occupy a larger portion of the rectangle, and vice versa during a release/expansion. It is inherently low lag due to the lack of any averaging in the calculation since the start of an expansion/breakout will instantly change the dimensions of the encompassing rectangle and the corresponding ratio. A potential downside is that different lengths will produce significantly different results which will require tuning to optimize for specific instruments and timeframes.
Additional standard deviation bands to identify potential points of volatility change and the option to normalize the output using the stdev bands.


RSI (w/ Curve and Volatility)This is a centered triple oscillator which measures RSI, RVI (volatility), and Coppock Curve (trend). This is centered so it ranges from negative 50 to positive 50. This indicator is used most accurately when all 3 indicators show above/below 0.
RSI is the bright pink line. RSI determines strength in a direction. When it is above 20 or below -20, a pullback is likely - this could be a prime time to scale out of position. Remember do not enter a trade just because it is oversold, as the strength is still greatly against you.
RVI is the thin lighter line. RVI was created by Donald Dorsey to use in conjunction with other indicators. The instructions for using RVI is to sell/short when below -10 and buy/cover when above 10. Use this indicator to confirm your bias.
The purple area is the Coppock curve . This curve is used to analyze longer term trends in a chart. RSI and RVI struggle to indicate long term trends, use the Coppock curve to confirm your bias. The curve is bullish when above 0 and bearish when below 0. Be cautious when trying to buy or sell it early when its falling. If it is falling and pops back up without reaching 0, it is typically indicate of a big price movement in that direction.

Cyclic Volatility Index(Version NO.1)The "Cyclic Volatility Index" indicator shows the characteristics of the 24-hour derivatives market.
As the volume increases, the CVI reading at the bottom increases as the variation increases, either up or down.
Conversely, when the cumulative volume of trading decreases and market fluctuation begins to decrease, the CVI at the bottom decreases.
CVI can effectively identify major players in the high-risk derivatives market.
"This indicator had reused indicator which name is 'CEMA'.
Reused indicator URL: www.tradingview.com
reused indicator 'CEMA' CODE
study(title="Color EMA", shorttitle="CEMA", overlay=true)
en = input (10, minval=1, Title="Length")
src = input(close, Title="Source")
out = ema(src, le)
(out, color=out>out ?green:out [out ?red:blue, linewidth=2, transsp=0, Title="CEMA")

High Volatility Bar, Wyckoff Trend Tracking Trading SystemHigh Volatility Bar by Wyckoff Trend Tracking Trading System

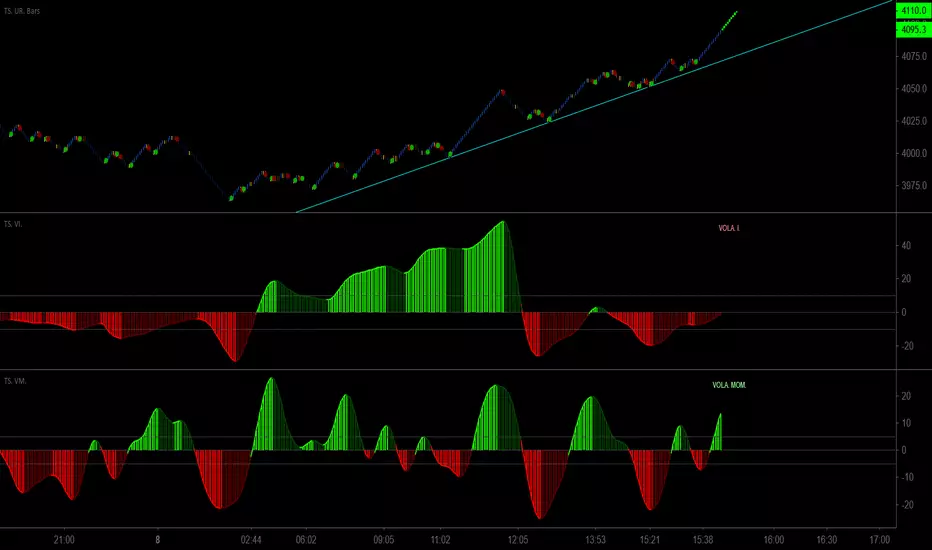
Trader Set - Volatility IndexOne of the last tools I forgot to publish till today. This is a Volatility Index Oscillator that uses a custom and original formula. This tool will be used hand in hand with's momentum one to easily identify the trend reversal points before it actually happens !
BitMEX Volatility AlertsAlert conditions and bar colors for each of the three volatility indices from BitMEX.
Price: 0.002 BTC / 35 Ripples / 1 NEO

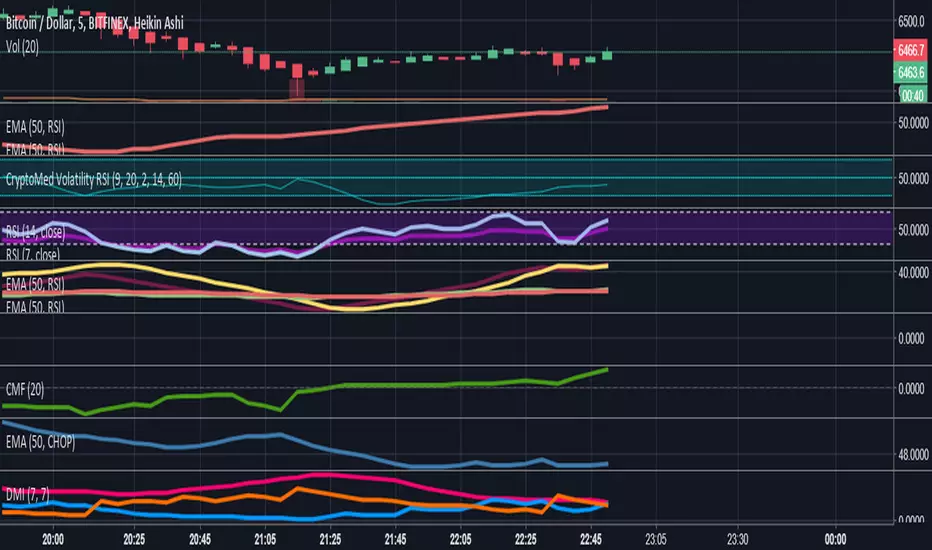
CryptoMedication's Volatility RSI
So, here's what we ended up doing for the most recent one that we created.
1. We took the ATR (Average True Range) - You can read about that here: medium.com
2. Then applied the Bollinger Bands %B to it
3. Then overlayed it with another indicator
Purpose:
The general purpose of this indicator is to identify when there are periods of consolidation or if there were be a large increase in the price (going either way). However, we were able to plug this in so that it connected with the RSI (after cancelling out the noise and smoothing values*making it scaled out evenly), so that it also produces buy/sell signals.
If you're interested to get a more in-depth overview of how this works, visit this link here: medium.com
[tududu] Volatilidade Lenta (Slow Volatility)Um modelo de volatilidade lenta baseado nas bandas de 91 períodos em até 4 desvios padrões. Tenho utilizado esse modelo para identificar oportunidades de alavancagem em condições extremas de mercado. Considero o modelo usual de Bollinger muito suscetível a ruídos e incapaz de lidar com acréscimo súbito de volatilidade, por isso busquei um rastreamento lento mais confiável com sinais de menor frequência. A princípio deve ser utilizado no diário, porém mesmo no intradiário pode ser um indicador mais confiável que as bandas de 20 períodos.
---
Slow Volatility model based on 91 SMA up to 4 standard deviations. It can be used as 'leverage indicator' ,pinpointing extreme market conditions that allows safer leverage. Usual Bollinger Bands are way too prone to noise, so this slow variant is much more reliable, albeit it provides much less frequent signals. To be used on daily chart, but feel free to test it on intraday charts.

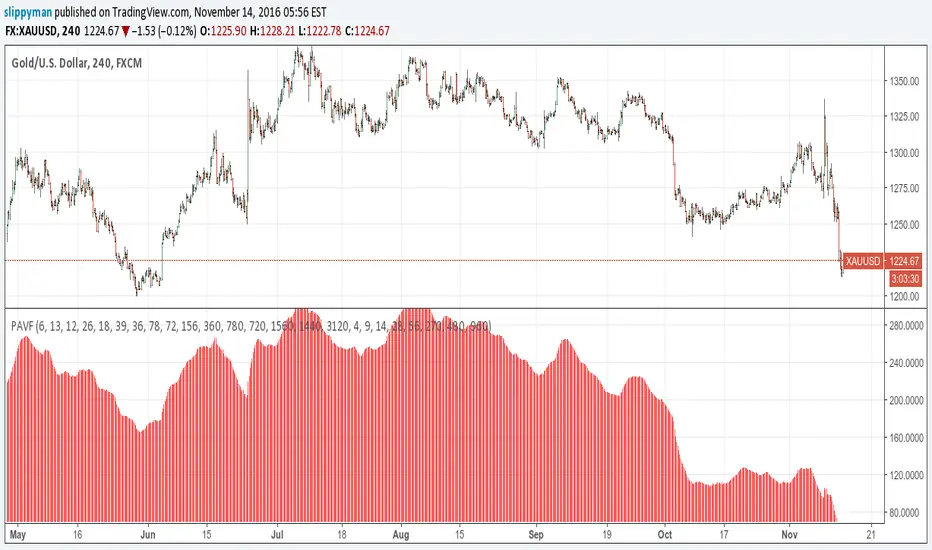
Price Action Volatility FilterThis creates a none oscillating histogram that shows price action without lower time frame volatility to help show bias for use with macd or entries with other trending indicators.
[RS]Volatility Explosive Measure V0EXPERIMENTAL:
Measures the volatility range of current price range, can help detect squeezes as well explosive moves

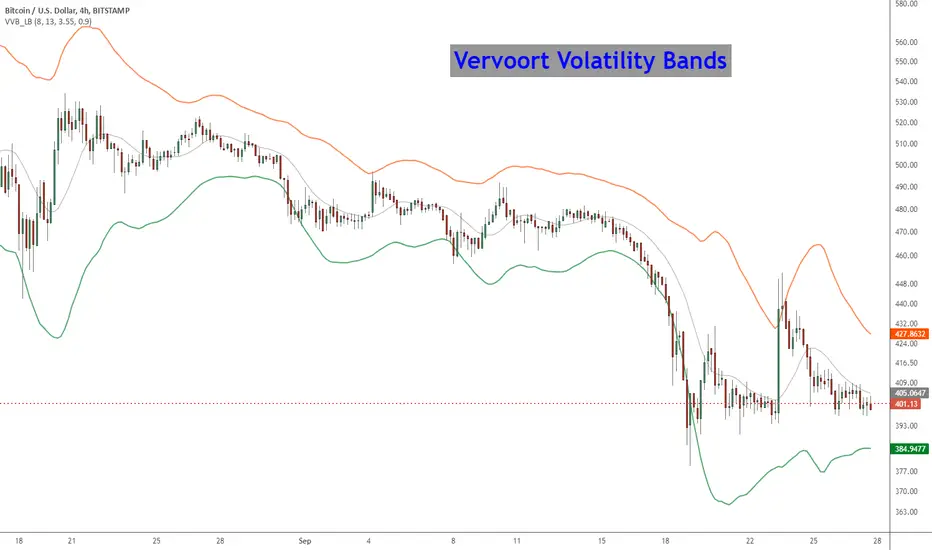
Vervoort Volatility Bands [LazyBear]This is Mr. Vervoort's take on volatility bands. Sticking to his style, he uses highly smoothed data everywhere, also improves on the way the bands are calculated. Is this better than others? I will let you guys decide :)
More info:
www.traders.com
List of my other indicators:
- Chart:
- GDoc: docs.google.com
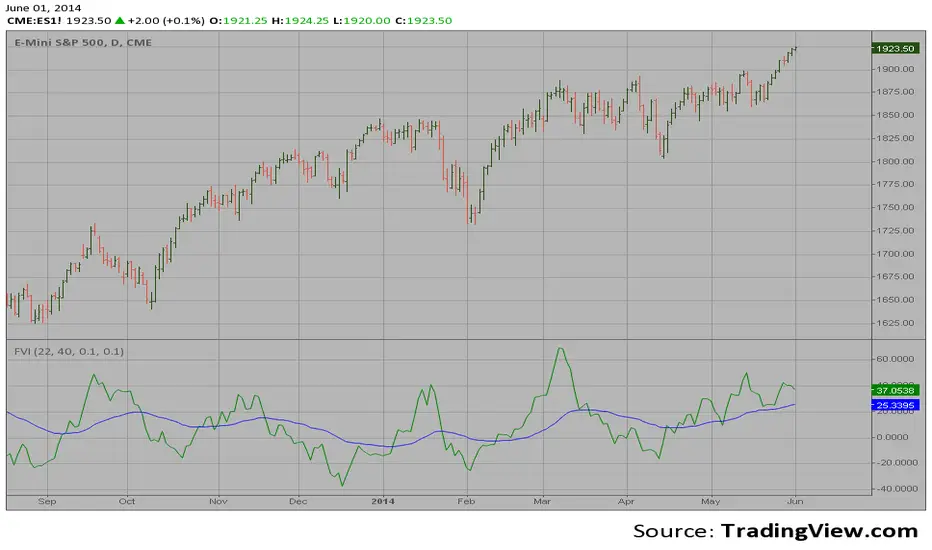
FVE (Volatility Modified) This is another version of FVE indicator that we have posted earlier
in this forum.
This version has an important enhancement to the previous one that`s
especially useful with intraday minute charts.
Due to the volatility had not been taken into account to avoid the extra
complication in the formula, the previous formula has some drawbacks:
The main drawback is that the constant cutoff coefficient will overestimate
price changes in minute charts and underestimate corresponding changes in
weekly or monthly charts.
And now the indicator uses adaptive cutoff coefficient which will adjust to
all time frames automatically.
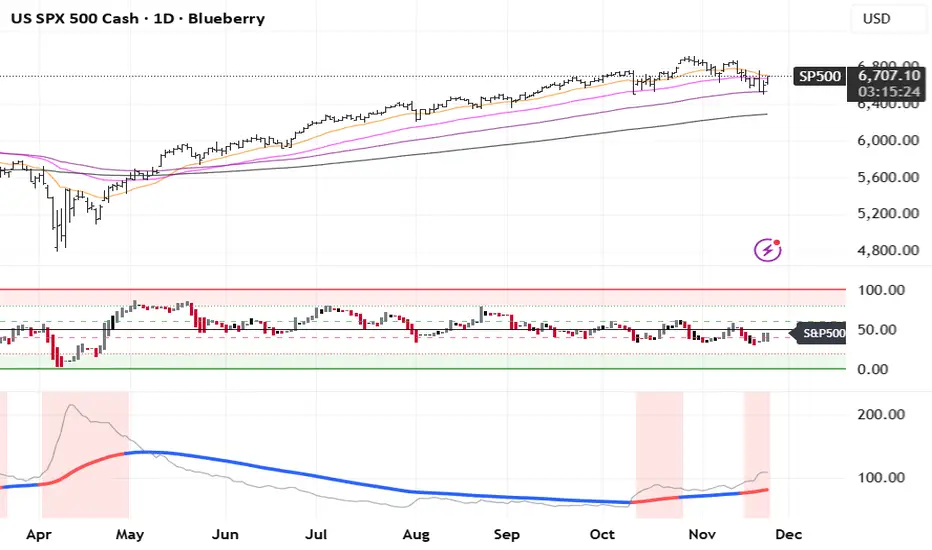
Volatility Inverse Correlation CandleThis is an educational tool that can help you find direct or inverse relations between two assets.
In this case I am using VIX and SPX .
The way it works is the next one :
So I am looking at the current open value of VIX in comparison with the previous close ( if it either above or below) and after on the SPX I am looking into the history and see for example which type of candle we had in respect with the opening value from VIX .
So for example, lets imagine that today is monday, and the weekly open value from VIX was higher than previous friday close value. Now I am going to see with the inverse correlation , if based on this idea, the current weekly candle from SPX finished in a bear candle.
The same can be applied for the bearish situation, so if we had an open from VIX lower than previous close, we are looking to check the SPX bull candle accuracy.
At the same time, for a different type of calculation I have added an internal lookup into heikin ashi values.
If you have any questions please let me know !
