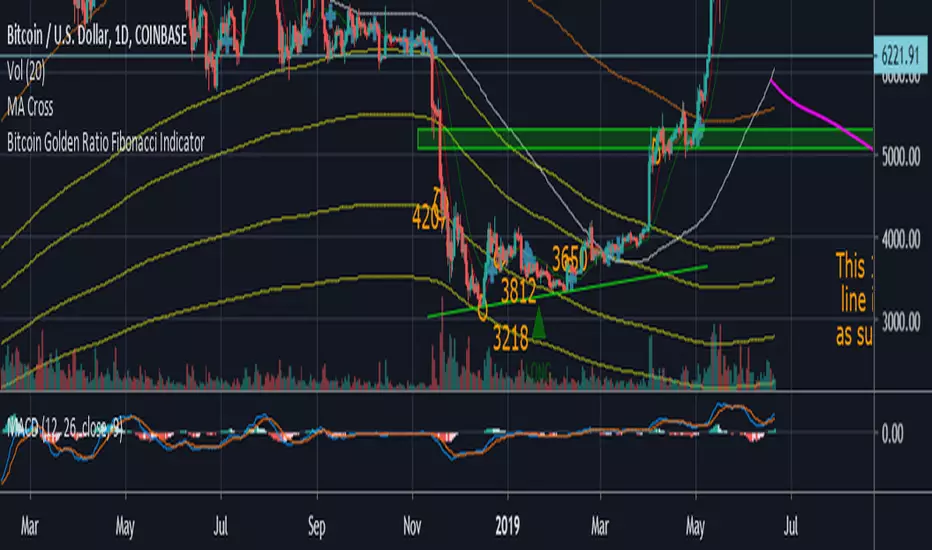
Bitcoin Golden Ratio Fibonacci IndicatorI didn't see this one already it isn't my original idea either. I pulled the formula's from an article on medium, I also added few bear market bottom fib indicators.
Credit to the article I pulled the formula from.
The Golden Ratio Multiplier
Unlocking the mathematically organic nature of Bitcoin adoption
Go to the profile of Philip Swift (@PositiveCrypto)
Philip Swift (@PositiveCrypto)
Jun 17, 2019
By Philip Swift
Release Notes: Fixed spelling error on title, added a couple long and short labels for the top and bottom indicator.
Pesquisar nos scripts por "GOLD"
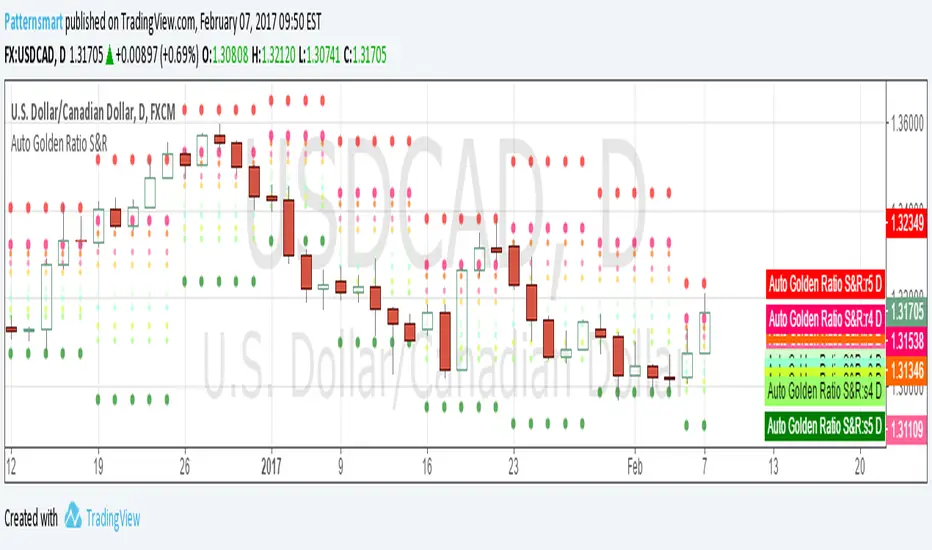
Automatic Golden Ratio Support & ResistanceThe golden ratio is also called the golden mean or golden section.
It has been used to analyze the proportions of natural objects as well as man-made systems such as financial markets.
The mathematics of the golden ratio and of the Fibonacci sequence is intimately interconnected. The Fibonacci sequence is: 1, 1, 2, 3, 5, 8, 13, 21, 34, 55, 89, 144, 233, 377, 610, 987, ....
This Golden Ratio indicator automatically plots 5 support levels and 5 resistance levels based on the golden ratio for current timeframe. It shows a possible price range for current session, you can easily identify the major and minor support/resistance levels from the chart.
The levels of support and resistance are formed at the beginning of a new session
This indicator works on all default time frames.
It will never repaint.
There is no parameter. All you need to do is to load it to your chart.
Click the image links to view it in original size.
3.bp.blogspot.com
2.bp.blogspot.com
2.bp.blogspot.com
3.bp.blogspot.com
2.bp.blogspot.com
2.bp.blogspot.com
1.bp.blogspot.com
////////////////////////////////////////////////////////////
// Technical Analysis & Research Patternsmart
//
// Custom indicators, Strategies, SCAN, Screener, Backtesting, Converting service for:
// Tradingview, NinjaTrader, Thinkorswim, MetaTrader, MetaStock, Multicharts, Prorealtime, etc.
////////////////////////////////////////////////////////////
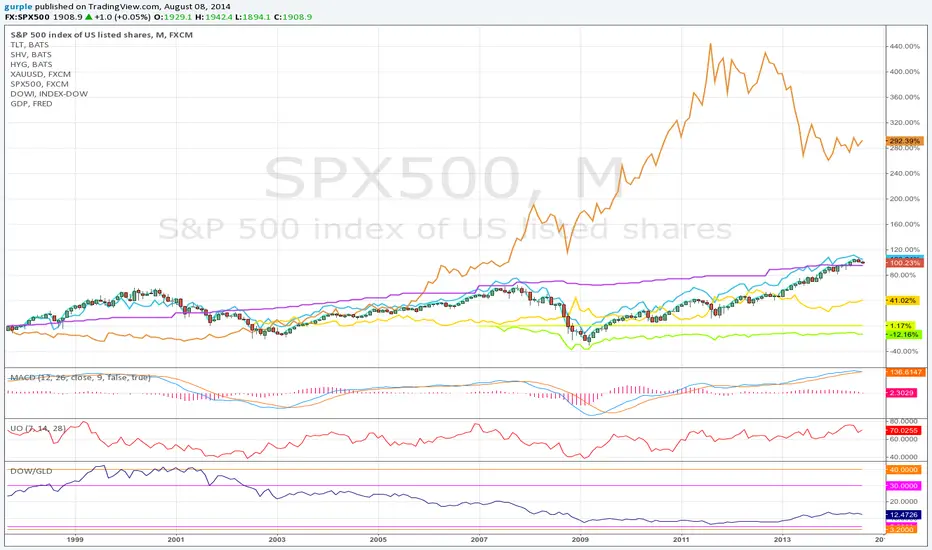
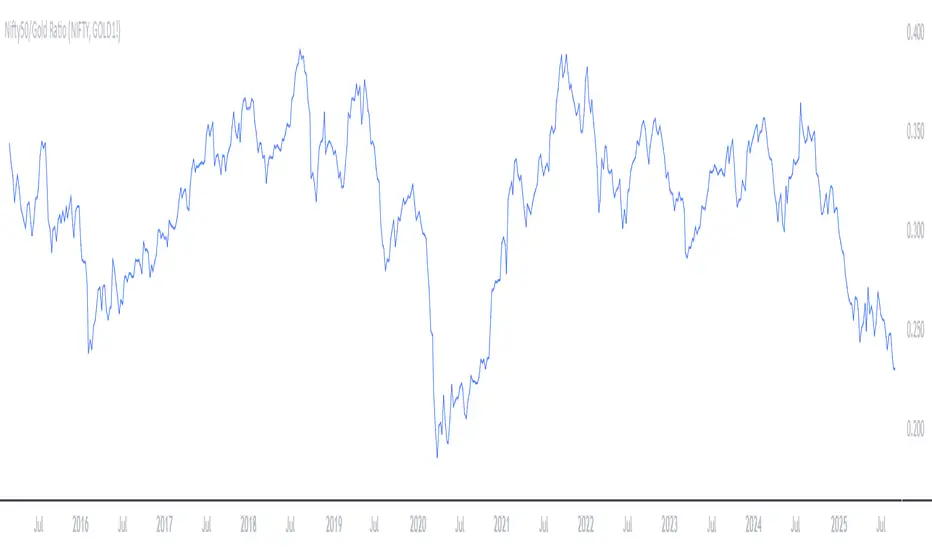
DOW / GOLD RatioThis indicator shows the ratio between the DJIA and the price of gold. When the ratio is below 5 it is generally accepted that a rotation from commodities to equities should be investigated. When the ratio is above 30 it is, likewise, advised to consider rotating from equities to commodities.
This is a modest improvement of the script to mark the key thresholds where equities/commodities holdings rotations could be prudent. I’m sure I’ll be submitting a number of instances of these scripts as I learn the syntax and features while developing them.
Gold DropGold Drop – Intraday Trading System (India Markets)
Gold Drop is a rule-based intraday trading strategy designed specifically for Indian index trading (BANKNIFTY / NIFTY), combining trend, momentum, strength, and fixed reference levels to deliver consistent and disciplined trade execution.
The system is built to avoid emotional trading, over-trading, and shifting levels during the session

Gold Scalping MACD ProGold Scalping MACD Pro is a custom-built technical indicator specifically optimized for gold (XAUUSD) scalping. It is based on an advanced adaptation of the classic MACD (Moving Average Convergence Divergence) concept, enhanced to provide faster, clearer, and more reliable signals in highly volatile gold markets.
🔹 Core Purpose
The indicator is designed to:
Capture short-term momentum shifts
Reduce market noise
Improve entry and exit timing during fast price movements
This makes it particularly effective for intraday and scalping strategies.
🔹 Key Features
Enhanced MACD-based momentum calculation for higher sensitivity
Early buy and sell signals during strong momentum phases
Noise filtering to reduce false signals in sideways markets
Optimized for gold’s volatility characteristics
Best performance on lower timeframes (M1, M5, M15)
🔹 How It Works
Gold Scalping MACD Pro analyzes the relationship between fast and slow moving averages, combined with momentum smoothing techniques.
By focusing on momentum strength rather than lagging confirmation, the indicator helps traders:
Identify high-probability scalping opportunities
Confirm short-term trend direction
Avoid weak or low-momentum setups
🔹 Best Use
Gold (XAUUSD) scalping
Momentum-based trading strategies
Trend confirmation on lower timeframes
Used alongside price action, support & resistance, or session timing
⚠️ Risk Disclaimer
Gold Scalping MACD Pro is a technical analysis tool and does not provide trading advice. Trading leveraged instruments such as gold involves significant risk. Proper risk management and confirmation from other analysis methods are strongly recommended.

KINETIC GOLD NQ Velocity Breakout [Ash_TheTrader]
🚀 Stop Guessing. Start Scalping with Physics.
Introducing the KINETIC GOLD NQ ⚡ VELOCITY BREAKOUT System
Author: Ash_TheTrader
Assets: Gold (XAUUSD), Nasdaq (US100), Bitcoin (BTC)
Style: High-Frequency Scalping (M1/M5)
---
🛑 The Problem: Why Most Indicators Fail
You’ve been there. The RSI says "Oversold," so you buy. But price keeps crashing. The Moving Average crosses over, so you enter. But the trend is already over.
Why? Because those indicators are lagging . They tell you what happened 10 candles ago.
⚡ The Solution: The "Physics" of Price
Markets move like objects in the real world. They have Velocity (Speed) and Momentum (Mass).
The Kinetic Velocity Breakout (KMB) system doesn't look at "Overbought" or "Oversold." It looks for FORCE .
It answers one simple question: Is the market moving fast enough to pay me?
---
🧠 The 4 "Smart Logic" Features
1. The Velocity Speedometer 🏎️
Most candles are "noise." This system ignores them. It uses a Normalized Volatility Engine to detect when price hits "WARP SPEED".
• Blue: Slow (Cruising). Don't touch.
• Yellow: Accelerating. Get ready.
• Red: WARP SPEED. Institutional money is entering.
2. The 1.5x Impulse Rule 💥
The algorithm strictly enforces the "1.5x Law." A signal ONLY fires if the breakout candle is 1.5 times larger than the average of the last 3 candles.
• Result? No more fakeouts. We only trade real expansions.
3. "Smart Mode" AI Dashboard 🖥️
A heads-up display (HUD) lives on your chart, auto-detecting your trading environment:
• Auto-Session: Tells you if you are in London, New York, or Asia.
• Risk Mode: Shows if you are using "Aggressive" or "Normal" logic.
• Status: Gives you a text readout like "READY ⚡" or "WAIT..."
4. Auto-Pilot Risk Management 🛡️
Scalping is fast. You don't have time to calculate Pips.
• The script draws the lines for you.
• As soon as a "ROCKET" signal appears, a Green TP Line (2x Reward) and Red SL Line appear instantly.
---
🎮 How to Trade: The 3-Step "Kinetic" Strategy
This strategy is designed for Gold (XAUUSD) and Nasdaq (US100) on the 5-Minute Timeframe .
Step 1: The "Yellow" Warning ⚠️
Watch the Smart Structure Lines (Dashed Lines).
• If the candles turn Yellow or the Dashboard says "FAST" , wake up.
• This means pressure is building against a key level.
Step 2: The "Warp" Trigger 🚀
Wait for a Confirmed Breakout . You are looking for:
1. A candle closes OUTSIDE the dashed structure line.
2. The candle color is NEON CYAN (Bullish) or NEON MAGENTA (Bearish).
3. The Signal Label appears: "ROCKET" (Buy) or "DROP" (Sell).
👉 Rule: No Label? No Trade. The 1.5x Logic saves you from bad trades.
Step 3: The Execution 💰
1. Enter at the close of the signal candle.
2. Stop Loss: Place it exactly on the Red Line provided by the indicator.
3. Take Profit: Place it on the Green Line .
4. Walk away. Let the physics work.
---
⚙️ Customizing Your Style
The script comes with two built-in "Personalities":
🛡️ Normal Scalper (Default)
• Best for: New traders, Funded Accounts.
• Logic: Waits for strong confirmation. High Win Rate.
• Risk: 1:2 Risk/Reward.
⚠️ QuickScalper (Aggressive)
• Best for: Gold M1, Volatility Hunters.
• Logic: Enters earlier on 1.2x Impulse. More signals, faster exits.
• Risk: 1:1.5 Risk/Reward (Grab the cash and go).
---
👇 Get the Code
Search for: KINETIC ⚡ in the TradingView library.
"Markets are physics. Trade the Velocity, not the noise." — @Ash_TheTrader

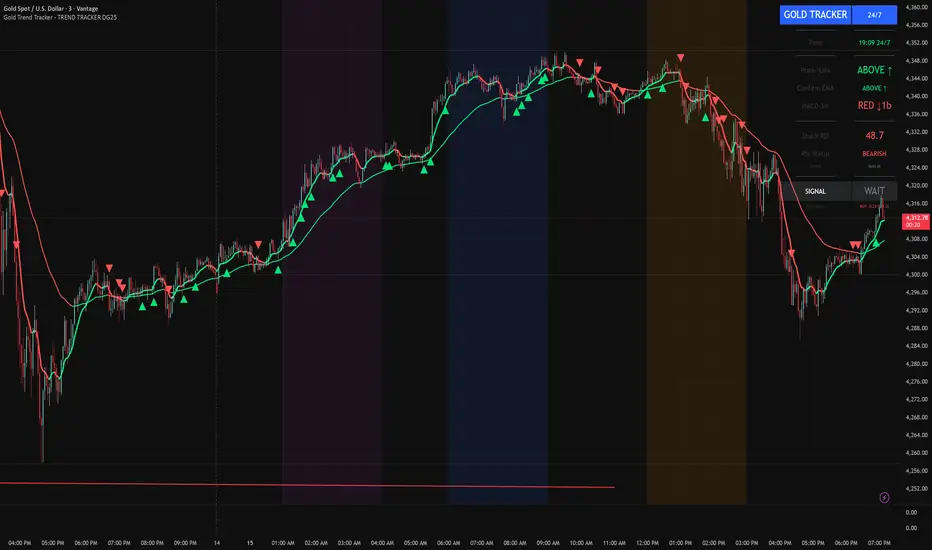
Gold Trend Tracker - TREND TRACKER DG25Gold Trend Tracker - Complete All-In-One Trading System
A professional, institutional-grade trading system specifically optimized for Gold (XAU/USD) that combines multiple technical indicators with session-based filtering and real-time performance tracking. No external indicators required - everything you need is built right in!
🎯 CORE FEATURES
Multi-Layered Confirmation System:
Dynamic EMA trend filter (default 10-period) with color-coded visualization
Optional secondary confirmation EMA (21-period) for stronger validation
3-minute MACD analysis with histogram tracking and direction monitoring
MACD bounce detection for high-probability continuation entries
Built-in Stochastic RSI (K=3, D=3, RSI Length=14, Stochastic Length=14)
Option to connect external Stochastic RSI if preferred
Intelligent Signal Generation:
Clear BUY/SELL triangles plotted directly on price chart
Minimum bars filter to eliminate signal spam and overtrading
Higher timeframe signal overlay (optional) - see 3min signals on 15min chart
Visual Stochastic RSI threshold cross markers (customizable shapes & sizes)
"Show Only First Cross" option to reduce visual clutter
Comprehensive alert system for all signal types
Advanced Session Management:
Pre-configured trading sessions: Asian (1-4am), London (6-9am), NY (12-3pm)
Timezone-aware filtering supporting major financial centers:
Europe/London
America/New_York
America/Chicago
Europe/Paris
Asia/Tokyo
Asia/Dubai
Color-coded session backgrounds (purple/blue/orange)
Individual session toggle switches
24/7 mode for continuous trading (crypto/forex)
Signals only generate during active sessions
Real-Time Performance Tracking:
Live P/L calculation since last signal entry
Customizable lot size for accurate dollar calculations
Pip movement tracking with automatic conversion
Last signal type and duration display
Performance color-coding (green profits, red losses)
Professional Dashboard:
Clean, scalable interface (Small/Medium/Large sizing)
Current time and active session display
Trading status indicator (TRADING/PAUSED/24/7)
Price position relative to Main EMA (ABOVE ↑ / BELOW ↓)
Confirmation EMA status (when enabled)
3-minute MACD color, direction arrow, and bar count
Stochastic RSI value with color-coded status
RSI status: BULLISH/BEARISH/NEUTRAL
Source type indicator (Built-in/External)
Large, clear SIGNAL display: BUY NOW / SELL NOW / WAIT
Performance summary: signal type + price change + dollar value
📊 HOW THE SYSTEM WORKS
BUY Signal Requirements:
✓ Price trading ABOVE main EMA (bullish trend confirmation)
✓ 3-minute MACD crosses above zero OR bounces higher after crossover
✓ Stochastic RSI K-line above bullish threshold (default 50)
✓ Within an active trading session (if session filter enabled)
✓ Confirmation EMA aligned (if secondary EMA enabled)
✓ Minimum bars since last signal met (prevents overtrading)
SELL Signal Requirements:
✓ Price trading BELOW main EMA (bearish trend confirmation)
✓ 3-minute MACD crosses below zero OR bounces lower after crossover
✓ Stochastic RSI K-line below bearish threshold (default 50)
✓ Within an active trading session (if session filter enabled)
✓ Confirmation EMA aligned (if secondary EMA enabled)
✓ Minimum bars since last signal met (prevents overtrading)
Multi-Confirmation Philosophy:
This system requires ALL conditions to align before generating a signal. This drastically reduces false signals and increases win rate by only trading the highest-probability setups where trend, momentum, and volume all confirm direction.
⚙️ BUILT-IN STOCHASTIC RSI
No External Dependencies:
The indicator includes a fully functional Stochastic RSI calculation based on the standard TradingView formula. No need to hunt for compatible indicators or worry about settings mismatches.
Default Settings (Optimized for Gold):
K Smoothing: 3
D Smoothing: 3
RSI Length: 14
Stochastic Length: 14
Bullish Threshold: 50
Bearish Threshold: 50
How It Works:
Calculates RSI on price data
Applies Stochastic formula to RSI values
Smooths result with K-period SMA
Uses K-line (not D-line) for cleaner, faster signals
Compares to your bullish/bearish thresholds
Generates visual cross markers when thresholds breached
Visual Markers:
Multiple shape options: Circle, Diamond, Square, Cross
Four size options: Tiny, Small, Normal, Large
Customizable colors for bullish/bearish crosses
"Show Only First Cross" prevents repetitive markers
Appears below bars (bullish) or above bars (bearish)
Flexibility:
Switch to "External" mode to connect your own Stochastic RSI indicator
Adjust all calculation parameters to match your trading style
Completely disable the filter if you prefer trend + MACD only
🎨 CUSTOMIZATION OPTIONS
Indicators:
Adjust Main EMA length (default 10)
Enable/disable Confirmation EMA (default OFF)
Set Confirmation EMA length (default 21)
Modify MACD parameters (Fast 5, Slow 14, Signal 9)
Enable/disable MACD bounces (default ON)
Set max bounces per trend (1-10, default 2)
Stochastic RSI:
Choose Built-in or External source
Adjust K/D smoothing periods
Modify RSI and Stochastic lengths
Set custom bullish/bearish thresholds
Configure cross marker appearance
Toggle dashboard display
Signals:
Show/hide signal triangles
Set minimum bars between signals (0-50, default 5)
Enable higher timeframe signal overlay
Choose HTF timeframe (e.g., 3min on 15min chart)
Sessions:
Enable/disable session filtering
Select your timezone
Toggle individual sessions (Asian/London/NY)
Customize session start/end hours
Show/hide session background colors
Display:
Choose dashboard size (Small/Medium/Large)
Adjust all visual elements
Customize colors and styling
💡 PRO TRADING TIPS
Session Optimization:
London Session (6-9am): Highest volatility, best for breakout trades
NY Session (12-3pm): Strong trends, ideal for momentum continuation
Avoid Asian Session (1-4am): Lower liquidity, choppier price action
Overlap Period (12-3pm London time): Peak volume, clearest signals
Signal Filtering:
Set 3-5 bars minimum between signals to avoid overtrading
Higher values (7-10 bars) for more conservative, swing-style entries
Lower values (1-3 bars) for aggressive scalping during high volatility
Confirmation EMA Usage:
Enable in choppy/ranging markets for extra validation
Disable during strong trending conditions (adds lag)
Set to 21 for short-term trends, 50 for medium-term
MACD Bounce Strategy:
Bounces occur when MACD histogram changes direction after crossover
Max 2 bounces = optimal (catches first continuation)
Max 1 bounce = conservative (only initial momentum shift)
Max 3-5 bounces = aggressive (catches multiple waves)
Stochastic RSI Thresholds:
50/50 = Balanced (default, works for most conditions)
30/70 = Conservative (fewer but stronger signals)
60/40 = Aggressive (more signals, requires tighter stops)
Adjust based on current market volatility
Risk Management:
Use the performance tracker to trail stops
Exit when dashboard shows opposite signal forming
Monitor MACD direction arrows for momentum shifts
Set profit targets based on average session ranges
🚀 QUICK START GUIDE
For Beginners:
Add indicator to 3-minute Gold (XAU/USD) chart
Leave all default settings (everything is pre-optimized)
Enable London session (6-9am) and NY session (12-3pm)
Set your timezone to your location
Wait for BUY/SELL triangle + "BUY NOW"/"SELL NOW" on dashboard
Enter trade when ALL conditions align
Exit on opposite signal or dashboard status change
For Advanced Traders:
Optimize EMA lengths for your preferred timeframe
Adjust Stochastic RSI thresholds based on backtesting
Fine-tune MACD bounce count for your risk tolerance
Enable Confirmation EMA for extra validation
Use HTF signal overlay for multi-timeframe confluence
Set signal filter to match your trading frequency
Customize session times for your specific market focus
📈 BEST TIMEFRAMES
Primary: 3-minute chart (system is MACD-optimized for 3min)
Alternative: 5-minute, 15-minute (adjust signal filter accordingly)
NOT Recommended: 1-minute (too noisy), 1-hour+ (signals too infrequent)
Chart Setup:
Main Chart: Your preferred timeframe (3min recommended)
MACD: Always references 3-minute data internally
Stochastic RSI: Calculates on current chart timeframe
Session Filter: Works on any timeframe
✅ WHAT MAKES THIS SYSTEM UNIQUE
All-In-One Solution:
✓ No hunting for compatible external indicators
✓ No configuration headaches or version conflicts
✓ One indicator = complete trading system
Session Intelligence:
✓ Only trades during optimal liquidity periods
✓ Automatically pauses during low-volume sessions
✓ Timezone-aware for global traders
Multi-Confirmation:
✓ Trend (EMA) + Momentum (MACD) + Volume (Stochastic RSI)
✓ Drastically reduces false signals
✓ Higher win rate through layered validation
Performance Transparency:
✓ Real-time P/L tracking on every trade
✓ Know your performance immediately
✓ Data-driven decision making
Professional Grade:
✓ Clean, institutional-style dashboard
✓ Customizable for any trading style
✓ Comprehensive alert system
⚠️ IMPORTANT NOTES
This is NOT a "Holy Grail":
No indicator is 100% accurate
Requires proper risk management
Works best during trending conditions
May produce whipsaws in choppy/ranging markets
Risk Disclosure:
Always use stop losses
Never risk more than 1-2% per trade
Past performance doesn't guarantee future results
Practice on demo account first
Optimization:
Default settings are optimized for Gold (XAU/USD)
May require adjustment for other instruments
Backtest on your specific market before live trading
Different session times may work better for your timezone
🔔 ALERTS INCLUDED
BUY Signal Alert
SELL Signal Alert
Stochastic RSI Cross Above Threshold
Stochastic RSI Cross Below Threshold
Alert Setup:
Click "Create Alert" button
Select desired alert condition
Choose notification method (popup/email/SMS/webhook)
Never miss a high-probability setup!
💬 SUPPORT & UPDATES
This indicator is actively maintained and updated based on user feedback. Future updates may include:
Additional timeframe options
More session presets
Enhanced performance analytics
Multi-asset optimization
Tags: Gold Trading, XAU/USD, Trend Following, MACD Strategy, Stochastic RSI, Session Trading, Day Trading, Scalping, London Session, New York Session, EMA System, Multi-Timeframe Analysis, Trading Dashboard, Performance Tracking
Forexsebi - GOLD Psychological Levels - TrendflowPsychological GOLD levels every $50 with clear zones, highlighted $100 & $500 levels, SMA 50 & 200, and a multi-timeframe trend table. Perfect for structure, trend, and rejection trading on XAUUSD.
Psychologische GOLD-Levels in 50-Dollar-Abständen mit klaren Zonen, 100- & 500-Dollar-Highlights, SMA 50 & 200 sowie einer Multi-Timeframe Trend-Tabelle. Ideal für Struktur-, Trend- und Rejection-Trading auf XAUUSD.
Key Features
Psychological Gold Levels
Automatic levels every $50
Adjustable number of levels above and below current price
Highlighted zones around each level for clearer reaction areas
Special Level Highlighting
$100 levels (xx00) highlighted for medium importance
$500 levels (x000 / x500) marked as major psychological levels
Different colors and stronger line thickness for key zones
Price Labels
Clean price labels displayed on the chart
Special symbols for 100 and 500 dollar levels
Trend Analysis with SMAs
SMA 50 & SMA 200 plotted directly on the chart
Individually toggleable
Clear color separation for fast trend recognition
Multi-Timeframe SMA Trend Table
Trend status (BULLISH / BEARISH / NEUTRAL) across:
5M, 15M, 1H, 4H, 1D
Logic: Price relative to SMA 50 & SMA 200
Color-coded, easy-to-read table
Displays the current trading session (Asia, Frankfurt, London, NY)
Info Box
Current Gold price
Nearest psychological level above and below price
Alert System
Alerts when price approaches a psychological level
User-defined alert distance
Distinction between normal, $100 and $500 levels

Gold Sniper V21: M15 Holding MasterGold Sniper Entry (Follow Trend to enter)
My Indicator :
- Clarify the M30 in Up/Down Trend
- Only entry the trade in M1/M5 Timeframe to make a Sniper Entry.
- Indicator will show when to TP before the Trend Change

Gold Fair Value [Alpha Extract]Gold-anchored Bitcoin fair value model is a macro-fundamental valuation indicator that anchors Bitcoin price assessment to gold market dynamics, establishing fair value zones through percentage change influence modelling and adaptive band multipliers. This overlay system provides institutional-grade context for identifying accumulation zones, distribution zones, and fair value equilibrium across all market cycles with minimal chart clutter through sophisticated gradient fill visualization.
🔶 Gold-Anchored Valuation Framework
Establishes Bitcoin's theoretical fair value by integrating daily gold price movements into a smoothed asset baseline, applying percentage change calculations over configurable periods to measure gold's momentum influence. The system translates gold's relative strength or weakness into Bitcoin price expectations through adjustable influence multipliers, creating a dynamic fair value line that adapts to shifting macro-fundamental relationships between digital and traditional store-of-value assets.
🔶 Multi-Layer Statistical Band System
Implements asymmetric upper and lower band multipliers applied to the fair value baseline, creating five distinct valuation zones: extreme overvaluation, moderate overvaluation, fair value equilibrium, moderate undervaluation, and extreme undervaluation. The asymmetric configuration (default 1.46x upper, 0.74x lower) reflects Bitcoin's historical tendency toward asymmetric volatility patterns with more violent upside moves and grinding downside action, optimizing zone accuracy for actionable trading decisions.
🔶 Gradient Fill Visualization
Employs sophisticated transparency-based gradient fills between bands to create visually intuitive valuation heat maps, with darker orange shading indicating proximity to fair value and lighter shading showing extreme deviation zones. The system maintains chart readability by hiding individual band lines while preserving the filled zones, eliminating visual clutter while delivering maximum information density for rapid market assessment without overwhelming the trader with excessive line plots.
🔶 Historical Context & Position Management
The lower band zones have historically preceded periods of constructive price behavior including consolidation phases and early-stage recovery rallies, while upper band interactions have preceded distribution and correction events. This historical pattern recognition enables traders to position proactively based on valuation extremes rather than reactively chasing momentum, supporting systematic accumulation during undervaluation periods and graduated profit-taking during overvaluation extremes.
All analysis provided by Alpha Extract is for educational and informational purposes only. The information and publications are not meant to be, and do not constitute, financial, investment, trading, or other types of advice or recommendations.

GOLD-DIGGERgold trading make education of trading much easier, just follow risk and reward to achieve it lmax

Anchor SafeSwing Gold StrategyOverview:
The Anchor SafeSwing Gold Strategy is designed for users who prefer structured, rule-based swing trading on XAUUSD. It focuses on identifying high-quality trade setups rather than frequent entries.
This strategy analyzes the market using multiple technical indicators and methods—including trend analysis, multi-chart confirmation, and support/resistance evaluation—to identify potential swing points. It also incorporates a dynamic approach to risk management through adaptive stop-loss and take-profit logic.
How the Strategy Works
1. Multi-Chart & Trend Analysis:
The strategy evaluates trend direction using several indicators and multiple charts. This helps determine whether the trend favors long or short setups.
2. Buy/Sell Conditions:
a. Buy Conditions: When the broader trend is identified as bullish, the strategy waits for the formation of a strong support zone before considering a long position.
b. Sell Conditions: When the trend is bearish, it waits for a confirmed resistance zone before initiating short positions.
3. Dynamic Take-Profit Logic
The strategy uses adaptive take-profit behavior based on evolving market conditions. It monitors new support/resistance structures and various overbought/oversold signals to dynamically exit trades.
4. Dynamic and Configurable Stop-Loss:
A flexible stop-loss system adjusts according to volatility and market structure.
Users can modify the stop-loss threshold in the settings based on their own risk tolerance and account size.
Trading Frequency :
This strategy focuses on select, high-quality setups. As a result, trade frequency is relatively low and may vary depending on market conditions. Backtesting may show roughly several trades per month, but actual live performance can differ.
Important Notes
All trading involves risk, and users should evaluate the strategy and adjust settings according to their own risk management preferences.

Willy ORB for Gold – Session Presets (NY 5m)What it does:
Plots the opening-range high/low for the main Gold sessions (Shanghai, Tokyo, Sydney, Frankfurt, London, New York 5-minute OR by default). It projects TP1/TP2 expansion targets, supports a timezone offset so opens line up with your broker, and includes breakout alerts on confirmed closes.
⸻
Why it’s Gold-friendly
• New York (COMEX pit): 5-minute opening range at ~20:20 local (via your offset) to capture the most active burst.
• London / Frankfurt: strong European volatility windows for XAU/USD.
• Shanghai / Tokyo / Sydney: structure-setting sessions before momentum builds.
⸻
Features
• Session presets: SH, TK, SY, FR, LDN, NY (5m) — toggle individually
• 15m OR for all sessions except NY (5m) by default (editable per session)
• TP1 / TP2 expansion targets (user-defined multiples)
• Labels for 15m/5m range and targets; customizable styles
• Timezone offset control (aligns lines to your local clock)
• Daily auto-reset for clean levels
• Alerts: “Closed Above Range High” / “Closed Below Range Low” per session
⸻
How to use
1. Add to chart (best on 1–15m).
2. In settings → Gold Sessions, toggle the sessions you want.
3. Set “My time offset from chart (hours)” so session lines match your broker time.
4. Trade the breakouts: when price closes beyond the session high/low, TP levels plot automatically.
⸻
Parameters (quick guide)
• Targets: TP1/TP2 multiples (e.g., 1.0 and 2.0).
• Labels: left/right label placement, line styles/colors.
• Sessions: enable/disable + choose each session’s OR length (NY defaults to 5m).
⸻
Tips for XAU/USD
• London often gives the cleanest first breakout.
• New York tends to drive continuation after data releases.
• Consider pairing with volume/volatility or HTF trend for confluence.
⸻
Notes
• Built in Pine Script v6.
• Indicator (not a strategy). For backtests, use a companion strategy that trades the closes beyond the OR with SL at the opposite side and TP by R.
⸻
Disclaimer
For educational purposes only. Not financial advice. Always backtest and manage risk.

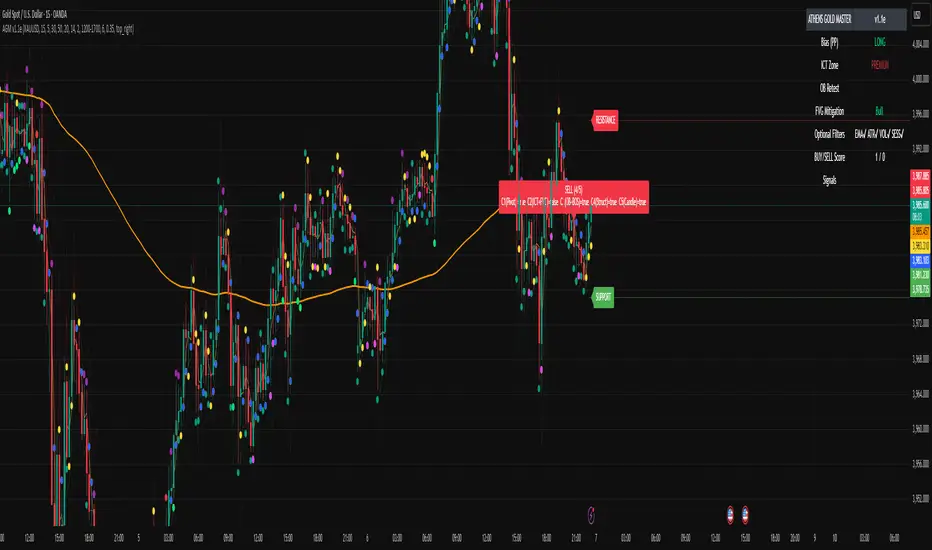
ATHENS GOLD MASTER v1.1e — by ATHENSATHENS GOLD MASTER v1.1e — by ATHENS
Professional Smart-Money-Based Gold Trading System
Built with institutional precision and ICT logic for XAUUSD traders.
⚙️ Core Strategy Components
✅ ICT Premium/Discount Model
✅ Daily Pivot Points & Price Bias
✅ Order Block & Break of Structure Detection
✅ Fair Value Gap (FVG) Mitigation Logic
✅ Dynamic Support & Resistance Recognition
✅ Candlestick + Chart Pattern Confirmation
✅ Multi-Timeframe Structure Alignment
💡 How It Works
The indicator scans real-time GOLD price action and generates Buy / Sell signals only when 3 or more confirmations align across smart money and technical confluence.
Each signal is visually marked on the chart with labels showing:
Confirmation count (1–5)
Key structure notes (Pivot, OB, FVG, etc.)
Support/Resistance zone tags
🧠 Optional Filters for Accuracy (90%+)
EMA-200 Trend Filter
ATR Volatility Filter
Volume Strength Filter
Session-Time Restriction (London–New York Overlap)
🟩 Buy Signal Example
Price above Pivot & in Discount Zone
Bullish Order Block Retest
FVG Mitigation Confirmed
Bullish Engulfing / Pin-Bar Confirmation
🟥 Sell Signal Example
Price below Pivot & in Premium Zone
Bearish Order Block Retest
FVG Mitigation Confirmed
Bearish Engulfing / Pin-Bar Confirmation
📊 Extra Features
Live Bias Table (Panel)
Selective Smart S/R Zones
Auto Session Filter
Alerts for Buy, Sell, and Strong Confluences
Best for: Gold Traders, ICT Students, Smart-Money Concepts Enthusiasts, and Professional Price-Action Analysts.
⚜️ Developed by ATHENS | Sahan Akalanka
📈 “Trade Smart. Think Institutional.”
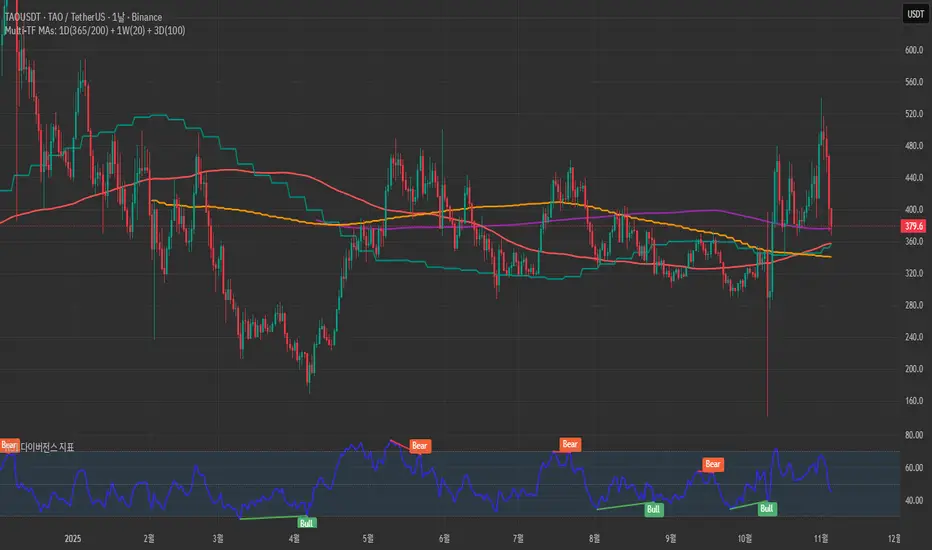
Golden Flow MapGolden Flow Map is a multi–timeframe moving–average system
designed to reveal the underlying direction of long–term market flow,
beyond daily volatility or short–term signals.
This script overlays four major trend lines — each representing a different layer of market rhythm:
Timeframe Length Meaning
🟣 1D – 365 MA Annual average — the true life line of the trend
🔴 1D – 200 MA Institutional benchmark — the long-term threshold
🟢 1W – 20 MA Mid-cycle momentum guide
🟠 3D – 100 MA Wave transition detector — captures trend shifts early
By combining these four perspectives on a single chart,
you can instantly distinguish between a short-term bounce and a major trend reversal.
🧭 How to Use
When all four lines align in one direction → that’s the main current of the market.
If price loses the 200D or 365D, ignore small rebounds — the structure has shifted.
The cross between Weekly 20 and 3D 100 often marks a wave transition.
Focus on alignment order rather than crossovers —
markets ultimately return to the direction of the higher timeframe.
⚙️ Features
SMA / EMA toggle
Individual MA on/off controls
Built-in alerts for 200D and 1W20 cross events
🧠 Concept
“Indicators are not signals — they are maps.”
This tool is not meant to predict, but to reveal the pulse of the market
and guide you through its long-term structure.
✍️ Creator’s Note
Developed from DDU’s personal long-term trend framework,
this indicator serves as a visual compass to expand a trader’s vision
from short-term reactions to macro-level flow.
Gold $25 line + CDCGold Trading CDC + option line
trading with ema to see trendline + Option strike price

Indian Gold Festival Dates HistoricalIndian Gold Festival Dates (1975-2025)
Marks 8 major Indian festivals associated with gold buying over 50 years of historical data. Essential for analyzing seasonal patterns and cultural demand cycles in gold markets.
Festivals Included:
Dhanteras (Gold) - Most auspicious gold buying day
Diwali (Orange) - Festival of Lights
Akshaya Tritiya (Green) - "Never-ending" prosperity
Dussehra (Red) - Victory and success
Makar Sankranti (Cyan) - Solar new year
Gudi Padwa (Magenta) - Hindu New Year (Maharashtra)
Ugadi (Purple) - Hindu New Year (South India)
Navratri (Yellow) - 9-day festival
Features:
✓ 408 exact historical dates (1975-2025)
✓ Color-coded vertical lines for easy identification
✓ Toggle individual festivals on/off
✓ Adjustable line width and labels
✓ Works on all timeframes (best on daily/weekly)
Perfect for traders analyzing gold seasonality, Indian market sentiment, and cultural demand patterns. Use on XAUUSD, GC1!, or Indian gold futures.

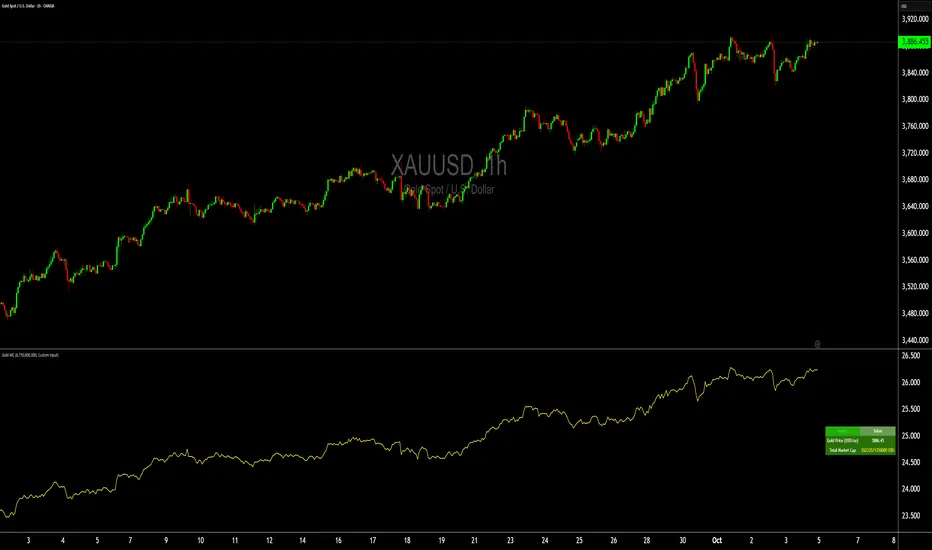
Gold Total Market Cap By Wave Trader Gold Total Market Cap (Updated 2025)
Overview
This indicator calculates and visualizes the total market capitalization of gold in real-time, based on the current XAUUSD spot price and the estimated above-ground gold supply. It transforms the raw gold price into a scaled "market cap" view (in trillions USD), helping traders contextualize gold's global value—often compared to stocks, crypto, or fiat reserves. As of October 2025, gold's cap hovers around $26–27T, underscoring its status as a premier safe-haven asset.
How It Works
Core Formula: Market Cap = Gold Price (USD/oz) × Total Supply (troy oz), scaled to trillions for chart readability.
Supply Data: Defaults to the World Gold Council (WGC) mid-2025 estimate of ~218,000 metric tonnes (~7.01B troy oz), but customizable for scenarios like historical or projected figures.
Plotted as a smooth yellow line below the price pane, mirroring gold's price movements but in cap terms.
Key Features
Dynamic Label: A real-time label on the yellow line displays the exact market cap (e.g., "26.8") for instant reference, styled like popular TradingView cap indicators.
Reference Line: Horizontal dashed line at 25T USD to highlight key thresholds (e.g., surpassing Bitcoin's cap).
Info Table: Top-right panel shows current gold price and full market cap (e.g., "26.8T USD") for quick stats.
Overlay-Free: Designed for a separate pane to avoid cluttering your main XAUUSD chart.
Data Sources & Customization
Relies on live XAUUSD close prices from TradingView.
Supply input: Switch between "WGC Mid-2025" (default) or custom values—ideal for sensitivity analysis (e.g., adding future mining output).
No external API calls; fully self-contained for fast performance.
Usage Tips
For Gold Traders: Spot divergences between price momentum and cap growth to gauge overbought/oversold conditions.
Portfolio Context: Compare to S&P 500 cap (~$50T) or BTC (~$2T) by adding multi-symbol alerts.
Timeframes: Best on daily/weekly for long-term trends; works on 1H+ for intraday macro views.
Alerts: Set notifications for cap milestones (e.g., "Gold Cap > 28T") via TradingView's alert system.
Track gold's "infinite market cap" evolution—because unlike stocks, gold's supply grows slowly, amplifying price impact. Updated for 2025 data; feedback welcome! 🚀
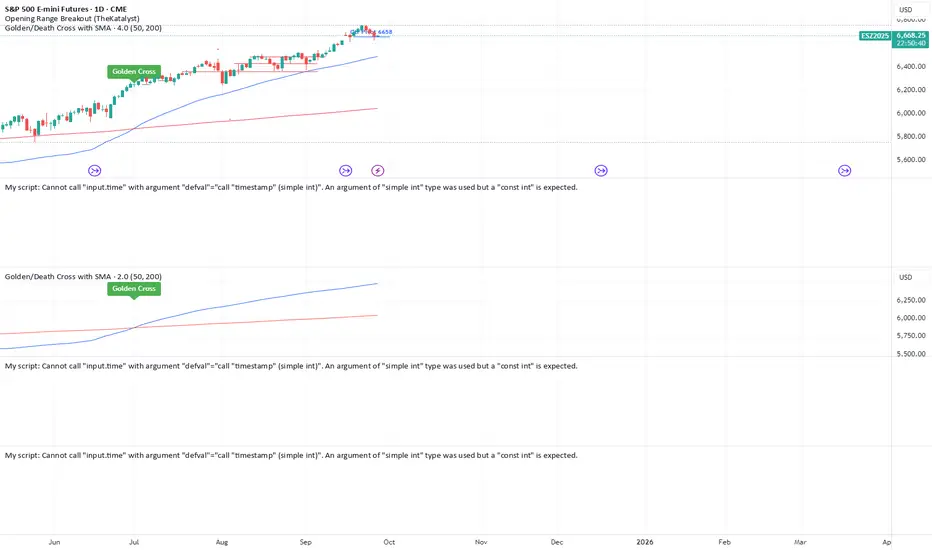
Golden/Death Cross with SMAGolden Cross: Triggered when the 50 SMA crosses above the 200 SMA.
Death Cross: Triggered when the 50 SMA crosses below the 200 SMA.

GOLD KEEPER – Multi‑Timeframe Trading AssistantGOLD KEEPER is a multi‑timeframe chart analysis tool designed to display visual markers when certain technical conditions are met.
It is intended to assist traders in their own chart study and decision‑making.
Usage Recommendations:
• Use a higher timeframe (e.g., 1H, 30M, or 15M) for overall market context.
• Drop to a lower timeframe (e.g., 5M or 3M) for potential entries that fit your own strategy.
• Combine with your personal analysis tools such as price action, support/resistance, and volatility levels.
Notes:
• Invite‑only script – access is granted to authorized users.
• For educational and chart‑analysis purposes only.
• This tool does not provide financial advice or guarantee results.
Gold 3min Trading Pro [XAU/USD]# Gold 3min Trading Pro - User Guide
## Overview
This is a professional scalping indicator specifically designed for Gold (XAU/USD) trading on 3-minute timeframes. It combines multiple technical analysis methods to provide high-probability entry signals for short-term trading.
## Key Features
### 1. Multi-Timeframe Trend Analysis
- **Major Trend**: Analyzes 15min, 1H, and 4H timeframes using moving averages
- **Short-term Trend**: Focuses on 3-minute price action and moving average alignment
- **Trend Strength**: Rated from 1-3 based on timeframe agreement
### 2. Core Indicators
- **RSI (9-period)**: Momentum oscillator for overbought/oversold conditions
- **Stochastic (9-period)**: %K and %D lines for entry timing
- **MACD**: Additional trend confirmation
- **Volume Analysis**: Detects volume spikes for signal validation
- **ATR-based Volatility Filter**: Ensures adequate market movement
### 3. Signal Types
- **Primary Signals**: Green triangles (LONG) and Red triangles (SHORT)
- **Enhanced Signals**: Stronger signals with multiple confirmations
- **Confirmation Signals**: Small circles for stochastic crossovers
## How to Use
### 1. Setup
- **Timeframe**: Use on 3-minute charts for Gold (XAU/USD)
- **Settings**: Default settings are optimized for Gold scalping
- **Session Filter**: Enable for London/New York sessions (recommended)
### 2. Entry Conditions
#### LONG Entry:
- Major trend is bullish (green background)
- Short-term trend is up or neutral
- RSI shows bullish momentum
- Stochastic indicates oversold recovery
- Volume spike confirmation
- Strong price action (bullish candle)
#### SHORT Entry:
- Major trend is bearish (red background)
- Short-term trend is down or neutral
- RSI shows bearish momentum
- Stochastic indicates overbought reversal
- Volume spike confirmation
- Strong price action (bearish candle)
### 3. Trade Management
- **Quick Target**: 50% of ATR-based calculation
- **Main Target**: Full ATR-based target
- **Stop Loss**: 60% of ATR below/above entry
- **Time Limit**: Exit if no progress within 20 bars (60 minutes)
### 4. Risk Management
- **Position Size**: Risk 1-2% of account per trade
- **Maximum Trades**: 3-5 trades per session
- **Avoid**: Low volatility periods and major news events
## Visual Elements
### Background Colors
- **Light Green**: Bullish major trend
- **Light Red**: Bearish major trend
- **Yellow**: Volume spike detected
- **Intense Colors**: Very strong trend alignment
### Chart Indicators
- **RSI Line (Blue)**: Main momentum indicator
- **Stochastic %K (Orange)**: Fast stochastic line
- **Stochastic %D (Yellow)**: Slow stochastic line
- **Horizontal Lines**: 70 (overbought), 30 (oversold), 50 (midline)
### Information Table (Top Right)
- Total signal count and performance statistics
- Current market conditions and trend strength
- RSI levels and volatility status
- Trading session information
- Last signal timing
## Alert System
### Standard Alerts
- **Scalp Long Signal**: Basic long entry signal
- **Scalp Short Signal**: Basic short entry signal
- **Premium Signals**: High-quality signals with strong confirmation
- **Trend Reversal**: Major trend change notifications
### Alert Setup
1. Right-click on chart → "Add Alert"
2. Select desired alert condition
3. Configure notification method (popup, email, webhook)
4. Set alert frequency to "Once Per Bar Close"
## Best Practices
### 1. Trading Sessions
- **Optimal**: London-NY overlap (3:00-5:00 PM EST)
- **Good**: London session (2:00-11:00 AM EST)
- **Avoid**: Asian session and major news releases
### 2. Market Conditions
- **Best**: Trending markets with normal to high volatility
- **Moderate**: Ranging markets during active sessions
- **Avoid**: Extremely low volatility or choppy conditions
### 3. Confirmation Rules
- Wait for signal triangle to appear
- Check that major trend aligns with signal direction
- Verify volume spike (yellow background)
- Ensure volatility is adequate (check info table)
### 4. Entry Timing
- Enter immediately after signal confirmation
- Use market orders for scalping speed
- Set stop loss and take profit levels immediately
## Settings Customization
### Essential Settings
- **MA Type**: EMA (recommended) or SMA
- **RSI Length**: 9 (default, can adjust 5-14)
- **Volume Threshold**: 1.8 (higher = fewer but stronger signals)
- **Volatility Filter**: Keep enabled for better signal quality
### Display Options
- **Show Scalping Signals**: Main entry signals
- **Show Performance Stats**: Information table
- **Show Trend Filter**: Background trend colors
- **Use Time Filter**: Session-based filtering
## Performance Optimization
### 1. Backtesting Tips
- Test on different market conditions
- Analyze win rate and average profit/loss
- Adjust settings based on historical performance
### 2. Signal Quality
- Higher trend strength (2-3) = better signals
- Volume confirmation improves success rate
- Enhanced signals have higher probability
### 3. Risk Control
- Never risk more than 2% per trade
- Use proper position sizing
- Stop trading after 3 consecutive losses
## Troubleshooting
### Common Issues
1. **No Signals**: Check volatility filter and session timing
2. **Too Many Signals**: Increase volume threshold or enable filters
3. **Poor Performance**: Verify timeframe (must be 3-minute) and symbol (XAU/USD)
### Support
- Ensure TradingView Pro+ subscription for multi-timeframe data
- Verify Gold symbol matches your broker's format
- Update to latest TradingView version
This indicator is designed for experienced traders familiar with scalping techniques and risk management. Always practice on demo accounts before live trading.
