NWOG with FVGThe New Week Opening Gap (NWOG) and Fair Value Gap (FVG) combined indicator is a trading tool designed to analyze price action and detect potential support, resistance, and trade entry opportunities based on two significant concepts:
New Week Opening Gap (NWOG): The price range between the high and low of the first candle of the new trading week.
Fair Value Gap (FVG): A price imbalance or gap between candlesticks, where price may retrace to fill the gap, indicating potential support or resistance zones.
When combined, these two concepts help traders identify key price levels (from the new week open) and price imbalances (from FVGs), which can act as powerful indicators for potential market reversals, retracements, or continuation trades.
1. New Week Opening Gap (NWOG):
Definition:
The New Week Opening Gap (NWOG) refers to the range between the high and low of the first candle in a new trading week (often, the Monday open in most markets).
Purpose:
NWOG serves as a significant reference point for market behavior throughout the week. Price action relative to this range helps traders identify:
Support and Resistance zones.
Bullish or Bearish sentiment depending on price’s relation to the opening gap levels.
Areas where the market may retrace or reverse before continuing in the primary trend.
How NWOG is Identified:
The high and low of the first candle of the new week are drawn on the chart, and these levels are used to assess the market's behavior relative to this range.
Trading Strategy Using NWOG:
Above the NWOG Range: If price is trading above the NWOG levels, it signals bullish sentiment.
Below the NWOG Range: If price is trading below the NWOG levels, it signals bearish sentiment.
Price Touching the NWOG Levels: If price approaches or breaks through the NWOG levels, it can indicate a potential retracement or reversal.
2. Fair Value Gap (FVG):
Definition:
A Fair Value Gap (FVG) occurs when there is a gap or imbalance between two consecutive candlesticks, where the high of one candle is lower than the low of the next candle (or vice versa), creating a zone that may act as a price imbalance.
Purpose:
FVGs represent an imbalance in price action, often indicating that the market moved too quickly and left behind a price region that was not fully traded.
FVGs can serve as areas where price is likely to retrace to fill the gap, as traders seek to correct the imbalance.
How FVG is Identified:
An FVG is detected if:
Bearish FVG: The high of one candle is less than the low of the next (gap up).
Bullish FVG: The low of one candle is greater than the high of the next (gap down).
The area between the gap is drawn as a shaded region, indicating the FVG zone.
Trading Strategy Using FVG:
Price Filling the FVG: Price is likely to retrace to fill the gap. A reversal candle in the FVG zone can indicate a trade setup.
Support and Resistance: FVG zones can act as support (in a bullish FVG) or resistance (in a bearish FVG) if the price retraces to them.
Combined Strategy: New Week Opening Gap (NWOG) and Fair Value Gap (FVG):
The combined use of NWOG and FVG helps traders pinpoint high-probability price action setups where:
The New Week Opening Gap (NWOG) acts as a major reference level for potential support or resistance.
Fair Value Gaps (FVG) represent market imbalances where price might retrace to, filling the gap before continuing its move.
Signal Logic:
Buy Signal:
Price touches or breaks above the NWOG range (indicating a bullish trend) and there is a bullish FVG present (gap indicating a support area).
Price retraces to fill the bullish FVG, offering a potential buy opportunity.
Sell Signal:
Price touches or breaks below the NWOG range (indicating a bearish trend) and there is a bearish FVG present (gap indicating a resistance area).
Price retraces to fill the bearish FVG, offering a potential sell opportunity.
Example:
Buy Setup:
Price breaks above the NWOG resistance level, and a bullish FVG (gap down) appears below. Traders can wait for price to pull back to fill the gap and then take a long position when confirmation occurs.
Sell Setup:
Price breaks below the NWOG support level, and a bearish FVG (gap up) appears above. Traders can wait for price to retrace and fill the gap before entering a short position.
Key Benefits of the Combined NWOG & FVG Indicator:
Combines Two Key Concepts:
NWOG provides context for the market's overall direction based on the start of the week.
FVG highlights areas where price imbalances exist and where price might retrace to, making it easier to spot entry points.
High-Probability Setups:
By combining these two strategies, the indicator helps traders spot high-probability trades based on major market levels (from NWOG) and price inefficiencies (from FVG).
Helps Identify Reversal and Continuation Opportunities:
FVGs act as potential support and resistance zones, and when combined with the context of the NWOG levels, it gives traders clearer guidance on where price might reverse or continue its trend.
Clear Visual Signals:
The indicator can plot the NWOG levels on the chart, and shade the FVG areas, providing a clean and easy-to-read chart with entry signals marked for buy and sell opportunities.
Conclusion:
The New Week Opening Gap (NWOG) and Fair Value Gap (FVG) combined indicator is a powerful tool for traders who use price action strategies. By incorporating the New Week's opening range and identifying gaps in price action, this indicator helps traders identify potential support and resistance zones, pinpoint entry opportunities, and increase the probability of successful trades.
This combined strategy enhances your analysis by adding layers of confirmation for trades based on significant market levels and price imbalances. Let me know if you'd like more details or modifications!
Pesquisar nos scripts por "Candlestick"

TechniTrend: Candle Pattern Detector (CPD) v3TechniTrend: Candle Pattern Detector (CPD)
The "TechniTrend: Candle Pattern Detector (CPD)" is a powerful tool designed to enhance the analysis of candlestick patterns across financial charts to understand market behavior. This indicator detects a wide range of reversal and continuation patterns, providing traders with insights into potential market movements. It incorporates dynamic filtering and customizable settings for precision in pattern recognition, allowing users to tailor the detection criteria to different trading styles.
🔷 Key Features
Comprehensive Pattern Detection: Identifies numerous candlestick patterns, including bullish and bearish reversals, continuation setups, and indecision formations.
Dynamic Filtering Options: Filter patterns are based on trend conditions, moving average positioning, and additional criteria to increase signal accuracy.
Customizable Input Settings: Provides adjustable parameters, such as body ratios and shadow length requirements, enabling traders to fine-tune detection thresholds.
Real-Time Alerts: Generates alerts when patterns are detected, ensuring traders can respond swiftly to market opportunities.
Graphical Representation: Visualizes detected patterns on the chart using intuitive labels, colors, and markers, helping to identify key signals quickly.
Supported Patterns
The indicator covers a wide range of candlestick patterns.
❇️ 51 Candlestick Patterns
🟢 Bullish Reversal Candlestick Patterns:
Bullish engulfing - Hammer - Morning star - Piercing line - Three white soldiers - Inverted hammer - Three Inside Up - Bullish Harami - Tweezer Bottom - White Marubozu - Dragonfly Doji - Three Outside Up - Bullish Counterattack Line - Bullish Abandoned Baby - Bullish Tri-Star - Hammer Doji - Morning Star Doji
🔴 Bearish Reversal Candlestick Patterns:
Bearish engulfing - Shooting star - Evening star - Hanging man - Three black crows - Dark cloud cover - Hanging Man Doji - Three Inside Down - Bearish Harami - Tweezer Top - Black Marubozu - Three Outside Down - Bearish Counterattack Line - Gravestone Doji - Evening Star Doji - Bearish Abandoned Baby - Bearish Tri-Star
🟩 Bullish Continuation Candlestick Patterns:
Rising Three Methods - Bullish Kicker - Mat Hold Bullish - Three Line Strike - Upside Tasuki Gap - Rising Window
🟥 Bearish Continuation Candlestick Patterns:
Falling Three Methods - Bearish Kicker - Mat Hold Bearish - Three Line Strike Bearish - Downside Tasuki Gap - Falling Window - On Neck Bearish
🟡 Indecision Candlestick Patterns:
Doji - Long Legged Doji - Spinning top - High Wave
Usage Recommendations
Optimized for Any Market: Designed for stocks, forex, cryptocurrencies, and other assets.
Ideal for Multi-Timeframe Analysis: Use it across different timeframes for better market timing.
Customization Options
Pattern Detection Settings: Users can adjust parameters like body-to-range ratios, shadow length requirements, and gap conditions for accurate detection.
Moving Average Filtering: Choose separate moving averages for reversal and continuation patterns to filter out false signals.
Table Display: These tables display pattern counts, allowing traders to assess the frequency and significance of various candlestick formations quickly.
Alert Configurations: Set custom alerts for specific patterns to stay informed about potential trading opportunities.
Story of Candlestick Pattern:
Candlestick patterns have a rich history rooted in ancient Japanese trading practices dating back to the 17th century. They were first developed by rice traders to visualize price movements and detect patterns reflecting market psychology. The logic behind candlestick patterns lies in the emotions driving market participants—fear, greed, uncertainty, and hope—captured through the open, high, low, and close prices.
Each pattern tells a story about buyers' and sellers' behavior, illustrating shifts in sentiment that can signal reversals or continuations in the market trend. By recognizing these patterns, traders can anticipate potential price movements and make informed decisions. The longevity and continued relevance of candlestick analysis highlight its effectiveness in understanding market dynamics.
🔓 Unlock Access
Check out the Author's Instructions or Dm me to Access the full version of the candlestick analysis with TechniTrend: Candle Pattern Detector (CPD).

Candle Range Theory | Flux Charts💎 GENERAL OVERVIEW
Introducing our new Candle Range Theory Indicator! This powerful tool offers a strategy built around the Candle Range Theory, which analyzes market movements through the relative size and structure of price candles. For more information about the process, check the "HOW DOES IT WORK" section.
Features of the new Candle Range Theory Indicator :
Implementation of the Candle Range Theory
FVG & Order Block Entry Methods
2 Different TP / SL Methods
Customizable Execution Settings
Customizable Backtesting Dashboard
Alerts for Buy, Sell, TP & SL Signals
📌 HOW DOES IT WORK ?
The Candle Range Theory (CRT) indicator operates by identifying significant price movements through the relative size and structure of candlesticks. A key part of the strategy is determining large candles based on their range compared to the Average True Range (ATR) in a higher timeframe. Once identified, a breakout of either the high wick or the low wick of the large candle is required. This breakout is considered a liquidity grab. After that, the indicator waits for confirmation through Fair Value Gaps (FVGs) or Order Blocks (OBs). The confirmation structure must be the opposite direction of the breakout, for example if the high wick is broken, a bearish FVG is required for the short entry. After a confirmation signal is received, the indicator will trigger entry points based on your chosen entry method (FVG or OB), and exit points will be calculated using either a dynamic ATR-based TP/SL method or fixed percentages. Alerts for Buy, Sell, Take-Proft, and Stop-Loss are available.
🚩 UNIQUENESS
This indicator stands out because it combines two highly effective entry methods: Fair Value Gaps (FVGs) and Order Blocks (OBs). You can choose between these strategies depending on market conditions. Additionally, the dynamic TP/SL system uses the ticker's volatility to automatically calculate stop-loss and take-profit targets. The backtesting dashboard provides metrics about the performance of the indicator. You can use it to tune the settings for best use in the current tiker. The Candle Range Theory approach offers more flexibility compared to traditional indicators, allowing for better customization and control based on your risk tolerance.
⚙️ SETTINGS
1. General Configuration
Higher Timeframe: Customize the higher timeframe for analysis. Recommended combinations include M15 -> H4, H4 -> Daily, Daily -> Weekly, and Weekly -> Monthly.
HTF Candle Size: Define the size of the higher timeframe candles as Big, Normal, or Small to filter valid setups based on their range relative to ATR.
Entry Mode: Choose between FVGs and Order Blocks for your entry triggers.
Require Retracement: Enable this option if you want a retracement to the FVG or OB for entry confirmation.
Show HTF Candle Lines: Toggle to display the higher timeframe candle lines for better visual clarity.
2. Fair Value Gaps
FVG Sensitivity: You may select between Low, Normal, High or Extreme FVG detection sensitivity. This will essentially determine the size of the spotted FVGs, with lower sensitivities resulting in spotting bigger FVGs, and higher sensitivities resulting in spotting all sizes of FVGs.
3. Order Blocks
Swing Length: Swing length is used when finding order block formations. Smaller values will result in finding smaller order blocks.
4. TP / SL
TP / SL Method:
a) Dynamic: The TP / SL zones will be auto-determined by the algorithm based on the Average True Range (ATR) of the current ticker.
b) Fixed : You can adjust the exact TP / SL ratios from the settings below.
Dynamic Risk: The risk you're willing to take if "Dynamic" TP / SL Method is selected. Higher risk usually means a better winrate at the cost of losing more if the strategy fails. This setting is has a crucial effect on the performance of the indicator, as different tickers may have different volatility so the indicator may have increased performance when this setting is correctly adjusted.

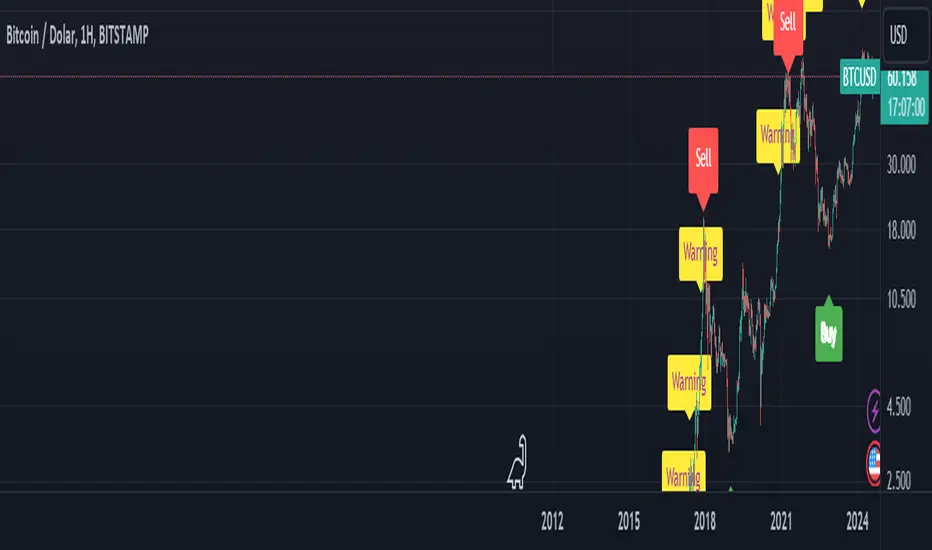
BTC Arcturus IndicatorBTC Arcturus Indicator: This indicator is designed to create buy and sell signals based on the market value of Bitcoin. It also predicts potential market tops with the Pi Cycle Top indicator.
How Does It Work?
1. MVRVZ (Market Value to Realized Value-Z Score) Calculation:
MC: Bitcoin's market cap (Market Cap) is pulled daily from Glassnode data.
MCR: Realized Market Cap of Bitcoin is taken daily from Coinmetrics data.
MVRVZ: It is calculated by dividing the difference between Bitcoin's market value and realized market value by one standard deviation. This value indicates whether the market is overvalued or undervalued.
2. Reception and Warning Signals:
Buy Signal: When MVRVZ falls below the -0.255 threshold value, the indicator gives a "Buy" signal. This indicates that Bitcoin is undervalued and may be a buying opportunity.
Warning Signal: A warning signal turns on when MVRVZ exceeds the threshold value of 2.765. This indicates that the market is approaching saturation and caution is warranted.
3. Tracking the Highest MVRVZ Value:
The indicator records the highest MVRVZ value in the last 10 candlesticks. This value is used to determine whether the market has reached its highest risk levels.
4. Warning Display:
If the MVRVZ value matches the highest value in the last 10 bars and this warning has not been displayed before, a "Warning" signal is displayed.
Once the warning signal is shown, no further warnings are shown for 10 candles.
5. Pi Cycle Top Indicator:
Pi Cycle Top: This indicator predicts Bitcoin tops by comparing two moving averages (350-day and 111-day). If the short-term moving average falls below the long-term moving average, this is considered a sell signal.
The indicator displays this signal with the label "Sell", indicating a potential market top.
User Guide:
Green Buy Signal: It means Bitcoin is cheap and offers a buying opportunity.
Yellow Warning Signal: Indicates that Bitcoin has reached possible profit taking points and caution should be exercised.
Red Sell Signal: Indicates that Bitcoin has reached market saturation and it may be appropriate to sell.
Candle GapsWhat This Indicator Does
This indicator shows you where the 'Gaps' are in the market ( as defined by this indicator ). The indicator draws a box that extends indefinitely to the right, this is the 'Gap'. This box will be 'Filled In' when price comes back and overlaps the box.
A Gap As Defined By This Indicator
A candle creates a 'Gap' in the area where there is no price action in front of, or behind ( up to 1 candle ) that area.
A 'Up Gap' is created when the close of a candle is above the high of the previous candle.
A 'Down Gap' is created when the close of a candle is below the low of the previous candle.
Both types of Gaps are coloured with the same colour.
Gaps are 'filled in' and disappear when price action crosses over them.
This indicator does not show gaps where there are no candlesticks.
The Intention Of This Indicator
The intention of this indicator is to make it possible to instantly identify Gaps in the market.
Gaps can be used as a confluence for a variety of different strategies.
Inputs
Gap Colour ( This changes the colour of the Gaps )
Draw Gaps From Wicks ( This changes whether the Gap begins to be drawn from the previous candles high/low, or from the candle the Gap occurs on )
Both inputs are for aesthetic preferences.
A maximum of 50 Gaps will be drawn on the chart at one time.
This indicator is not guaranteed to be 100% accurate.

Scalp Pump-Dump Detector with AlertsThis script displays the percentage of movement of all candles on the chart, as well as identifying abnormal movements to which you can attach alerts. An abnormal movement is considered a rise or fall that exceeds the parameter set in the settings (by default, 1% per 1 bar).
Added a function to display the volume on abnormal candlesticks.

Wick Length Dominance IndicatorThis indicator, called the "Wick Momentum Indicator" (WMI), helps to gauge price momentum by comparing the total length of upper and lower wicks of a certain number of candlesticks. The indicator turns green when there is a bullish momentum (total length of lower wicks is greater than that of upper wicks) and turns red when there is a bearish momentum (total length of upper wicks is greater than that of lower wicks).
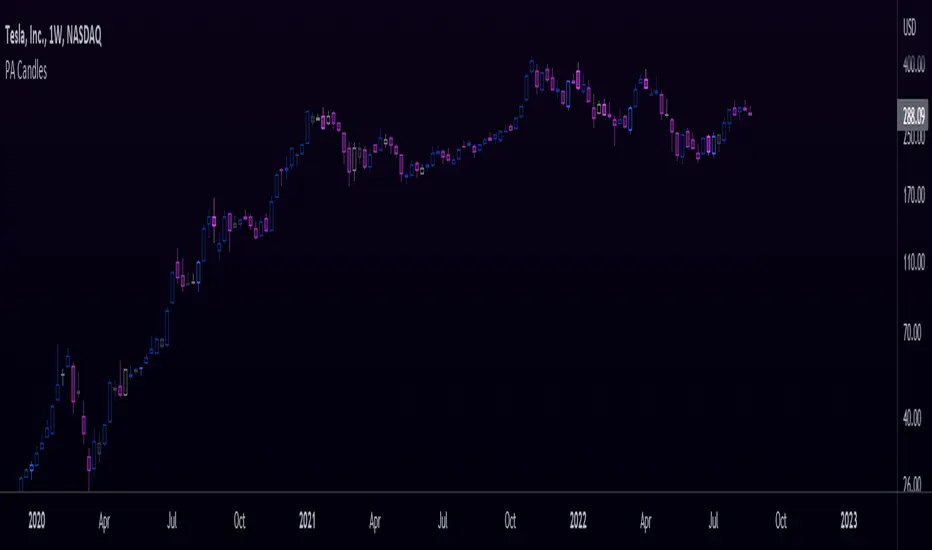
Price Action CandlesThis simple script provides a visual aid for price action traders by coloring outside & inside candles, which in effect leaves the trader with 6 possible candle colors:
-Regular bullish candle
-Outside bullish candle
-Inside bullish candle
-Regular bearish candle
-Outside bearish candle
-Inside bearish candle
These candlesticks may provide powerful signals when used in conjunction with key levels, market structure and chart patterns.
Make sure to disable the regular candlesticks (body, borders and wicks) in the symbol tab inside the configuration menu!
Hope it can help someone!
MTF Kagi Indicator v1.0Introduction
The indicator attempts to implement a time-based, multi-timeframe, non-repainting Kagi lines as an overlay to your chart using traditional candlesticks.
How is it original and useful?
This indicator is unique in that it allows you to choose from among three different methods to define the reversal amount. They are:
ATR (Average True Range): After each Kagi line is drawn, the latest ATR value from the selected timeframe will be used until a new vertical Kagi line is drawn. At this point, the latest ATR value will be used for the reversal amount until it changes again. This means that the reversal amount will adjust as price action volatility changes.
Fixed Amount: This method will be useful if you desire to fix the reversal amount, like the normal Kagi Chart. Thus, use this option if you desire to mimic the same Kagi Chart on TradingView.
Percent of Price: This method, like the ATR, will produce the reversal amount using the latest close price against the given percentage value.
In addition, the indicator will allow you to define the Up and Down line colors and width. You can even elect to have a Kagi line drawn on the real-time bar or not.
How does it compare to other scripts in the Public Library?
This indicator makes use of the security() function and applies the best-practices as provided by the PineCoders' script called " `security()` revisited " so that the indicator will not repaint when you refresh the chart or re-open it at a later date. In addition, the indicator provides three possible alerts for Alert Conditions or Any Alert() Function Call. They are:
"Break Shoulder" - this alert will trigger (Once Per Bar) when the close price crosses above the shoulder (higher) of the previous Kagi line.
"Break Waist" - this alert will trigger (Once Per Bar) when the close price crosses below the waist (lower) of the previous Kagi line.
"New Kagi Line" - this alert will trigger (Once Per Bar) when the indicator draws a new vertical Kagi line and continues to monitor the next trend change.
When using the "Any alert() function call" option in creating alerts, the following placeholders are supported in the alert message: {{shoulder_price}}, {{waist_price}}, and {{kagi_close_price}}
What does it do and how does it do it?
When applied to the chart for the first time, the default settings will work to produce Kagi lines from the beginning of the chart history up to the real-time bar. The Kagi line width will have a width of 1 pixel and the colors will match the normal color schemes that TradingView charts have for rising and falling colors. The reversal method will default to ATR with a period length of 14 so that it can provide a visually appealing Kagi lines where the reversal amount will be adaptive for all price charts. The default timeframe will be the chart's timeframe, but it can be changed to any higher timeframe. Using a timeframe that is lower than the current chart will not disable the indicator, but the lines will not be accurate since lower timeframe prices are being grouped to fit the current timeframe.
Enjoy! 😊👍

Tweak Strat Candle ColorThis script allows traders to customize candlestick colors based on The Strat trading system developed by Rob Smith.
The script determines if the current candle is an inside bar (1), outside bar (3), directional up (2u) , or directional down (2d).
An inside bar is a candle that trades fully within the previous candle.
An outside bar breaks both the high and the low of the previous candle.
A directional up bar breaks the high of the previous candle but NOT the low of the previous candle.
A directional down bar breaks the low of the previous candle but NOT the high of the previous candle.
The trader can modify the colors they wish to use in the settings menu.
NOTE: You must select "Visual order - Bring to front"
If you do not, the custom colors will disappear when you click the chart window.

Hammer / Shooting Star ScannerAlways missing hammer and shooting star candlestick pattern?
This script will help you to alert hammer shooting star candlestick.
Please leave your comments for improving this script.

Lord Mathew ATSThe Smart Money Structure & Pattern Analyzer is a complete, all-in-one visual trading system that brings together every essential element of Smart Money Concepts (SMC), ICT methodology, and candlestick psychology into one powerful indicator.
It is designed to help traders instantly understand the market’s structure, liquidity flow, and potential turning points without switching tools or manually marking charts. Whether you trade forex, indices, crypto, or commodities, this indicator automatically identifies where institutional activity, imbalances, and price inefficiencies occur in real time.
With its advanced algorithm, it plots market structure shifts, equal highs and lows, liquidity zones, order blocks, fair value gaps (FVGs), and previous week and day levels (PWO, PWH, PWL, PWC, PDO, PDH, PDL, PDO). It also integrates a deep candlestick recognition engine that detects over ten classic and advanced candle formations including engulfing patterns, dojis, hammers, shooting stars, morning/evening stars, and spinning tops to provide precise confirmation at critical points of interest.
This indicator isn’t just a tool it’s a complete market map that helps traders visualize how institutional order flow and candlestick sentiment interact.
Core Features
📊 Market Structure Detection:
Automatically marks swing highs/lows, Break of Structure (BOS), and Change of Character (CHOCH) in real time.
💧 Liquidity Mapping:
Highlights equal highs/lows and liquidity grabs, showing where price is likely to target before a reversal or continuation.
🧱 Order Block Visualization:
Displays the last bullish or bearish candle before an impulsive displacement, acting as a potential institutional entry zone.
⚡ Fair Value Gap (FVG) Scanner:
Detects and highlights imbalances where price moved too fast, helping you identify high-probability retracement areas.
🕯️ Candlestick Pattern Recognition:
Recognizes key reversal and continuation patterns (engulfing, hammer, shooting star, doji, morning/evening star, etc.) in real time.
📅 Institutional Reference Points:
Plots previous week & day open (PWO, PDO), previous week & day high (PWH, PWH), previous week & day low (PWL, PDL), previous week & day close (PWC, PDC) and optionally previous day levels to help frame bias.
🎨 Customizable Design:
Toggle any feature, change colors, and set alerts when multiple Smart Money signals align for cleaner, faster decision-making.
How It Works
Add the indicator to your chart on any timeframe or market.
The algorithm automatically detects structure, liquidity, and imbalance zones.
Candlestick patterns are highlighted when they form near high-probability areas (like OBs or FVGs).
When confluence occurs such as a liquidity grab, FVG fill, and bullish engulfing candle—the indicator provides a visual signal zone for your confirmation-based entries.
You can refine your trades using higher-timeframe bias (HTF order flow) and lower-timeframe execution (LTF confirmation).
Best For
Traders using ICT, Smart Money Concepts, or price-action systems.
Intraday and swing traders looking for clear, data-driven chart structure.
Traders who want to simplify confluence analysis and focus on precision execution.
Why It Stands Out
Unlike standard candlestick or pattern scanners, this indicator merges institutional market logic with technical candle behavior, allowing traders to see where smart money might be entering or exiting positions.
It’s not about random signals it’s about context, structure, and confirmation.
Every feature in this indicator is built around the principle of liquidity engineering:
price creates liquidity, grabs it, and moves toward imbalance or order flow efficiency.
By merging that institutional logic with candlestick patterns, this tool gives traders an edge in recognizing not only where to trade but why price is reacting in that exact area.
Disclaimer
This indicator is intended for educational and analytical use. It does not provide financial advice or guaranteed trading results. Always backtest and manage your risk responsibly.

Devil Marks - Multi TimeframeA handy completely new script that shows Devil Marks for several time frames on the current time frame.
Devil Marks are where candles have no wick at one end of the candlestick. These levels are seen as areas that price needs to go back to at some point to re-balance the imbalance. These levels can add confluence to a trade idea.
A table is included that shows the closest devil mark for each time frame.
Devil Marks should show until that level is mitigated by price trading at that level.

Session Top Bars — Equities Sessions (Asia / London / US) — MelbA minimal, non-obstructive session overlay that draws thin top bars for the Asia, London, and US equity sessions on any chart and timeframe. Designed to stay out of the way while giving instant session context—perfect for crypto, indices, futures, and stocks.
Default sessions (AEDT / Australia-Melbourne):
Asia: 10:00 → 17:45
London: 18:00 → 23:30
US: 23:00 → 07:00
(Weekends on by default for crypto; turn off for equities.)
Why it’s different
Top-only bands (no heavy background shading) so price action stays readable.
Asset-agnostic: works on any symbol/candlestick.
Adaptive top placement: hugs the top of the visible price area without distorting autoscale.
Session labels appear once at each session start, right on the strip (optional).
Inputs
Timezone: choose your clock (default Australia/Melbourne).
Show weekends: on for crypto, off for stocks.
Intraday-only: hide the overlay on 1D+ if you prefer.
Session windows: edit HHMM-HHMM for Asia / UK / US.
Colors & thickness: tweak gap from top, band thickness, and label size.
Tips
If the strip feels a touch low/high on your layout, nudge Gap below chart top or Band thickness.
To reduce small shifts when new extremes print, increase Recent range length (bars).
Use cases
Quickly spot which session drove a move.
Align entries/exits to cash session volatility (e.g., NYSE open).
Compare behavior across assets with a unified session view.
Notes
Times reflect equity session focus in AEDT by default; adjust to your needs.
For FX-style windows, just edit the session inputs.
Credits
Built from community feedback for a clean, professional session overlay.

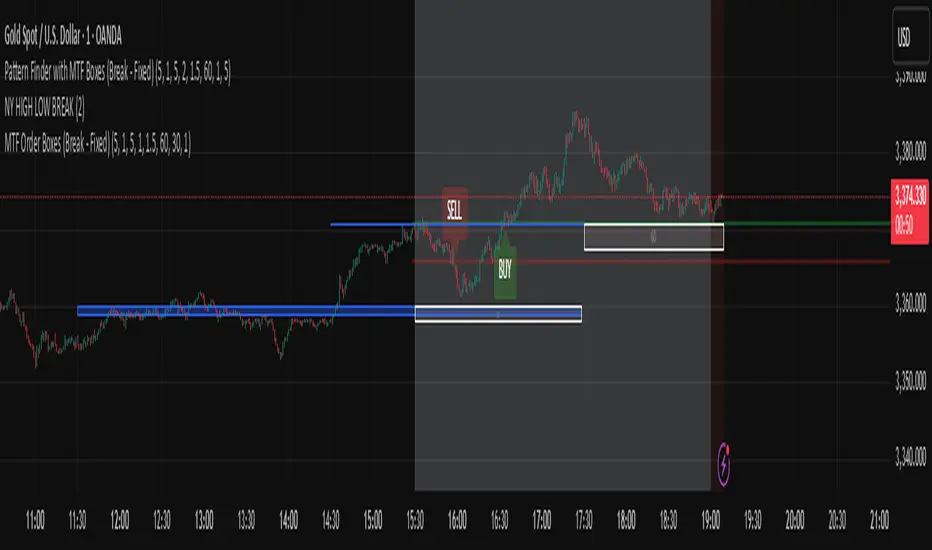
Pattern Finder with MTF Boxes (Break - Fixed)Script Title:
MTF Supply/Demand Zone Indicator with Candlestick Pattern Confirmation
Short Description:
This advanced strategy identifies key Supply and Demand zones (Order Blocks) on higher timeframes (30m & 1h) and then waits for a pullback to these zones on the current timeframe. The final entry signal is triggered upon the appearance of a valid candlestick pattern (e.g., Hammer, Engulfing) within these zones.
Full Description:
Introduction & Core Concept
This script is a powerful trading tool based on a combination of the following concepts:
Multi-Timeframe (MTF) Analysis: Identifying significant structures on higher timeframes to understand the bigger market picture.
Supply and Demand Zones: Finding areas where an imbalance between buyers and sellers has caused strong price movements.
Candlestick Patterns: Using classic candlestick patterns as the final confirmation for entering a trade at these key zones.
The main idea is to avoid trading blindly and instead wait for the price to react to a significant zone, then enter with a confirmation signal.
How the Strategy Works (Step-by-Step)
Identifying the Key Pattern on Higher Timeframes:
The script continuously monitors the 30-minute and 1-hour charts to find a specific pattern: a short consolidation period (usually 1-4 candles) immediately followed by a breakout with a powerful, high-momentum candle (Long Bar). This pattern indicates the formation of a fresh Supply or Demand Zone.
Drawing the Supply and Demand Boxes:
Green Box (Demand Zone): When a minor high is broken by a bullish Long Bar, this area is identified as potential support and marked with a green box.
Red Box (Supply Zone): When a minor low is broken by a bearish Long Bar, this area is identified as potential resistance and marked with a red box.
White Box (Long Bar / Trigger Zone): This box highlights the range of the Long Bar candle itself. A break of or return to this zone provides important signals.
Waiting for a Pullback:
After a zone is identified and drawn, the strategy waits for the price on your current chart to pull back into this box.
Entry Confirmation with Candlestick Patterns:
Once the price enters the box, the script looks for reversal candlestick patterns:
In a Demand Zone (Green Box): It looks for bullish patterns like the Hammer, Bullish Engulfing, Bullish Harami, and Morning Star. Upon detection, a BUY label appears on the chart.
In a Supply Zone (Red Box): It looks for bearish patterns like the Hanging Man, Shooting Star, Bearish Engulfing, Bearish Harami, and Evening Star. Upon detection, a SELL label appears.
Breakout Signal:
In addition to reversal signals, if the price breaks the White Box (Long Bar Zone) in the opposite direction, a breakout signal is generated, which could indicate a trend continuation.
Visual Elements on the Chart
Green/Red Boxes: The primary Supply and Demand zones from higher timeframes.
White Boxes: The range of the Long Bar candle that activated the primary zone.
BUY/SELL Labels: Trade signals that appear after a candlestick confirmation within the zones.
Moving Averages (SMA 100 & 200): Included to help identify the overall market trend. Trades aligned with the trend are generally more reliable.
Input Settings
period ATR & Bar multiplayer: Allow you to customize the definition of a "Long Bar" based on market volatility.
Number of candle for long bar avrage: The lookback period for calculating the average candle body size.
multiplayer for tp: A multiplier to calculate the take-profit based on the stop-loss size (Risk-to-Reward ratio).
How to Use This Strategy
Apply the script to your main trading timeframe (e.g., 5-minute or 15-minute).
Wait for a Supply (Red) or Demand (Green) zone to be drawn on your chart.
Be patient and wait for the price to return to this zone.
If a BUY or SELL label appears, consider it a valid entry signal.
Always combine these signals with your own analysis and the overall market context.
Disclaimer: This script is an analytical tool and should not be the sole basis for your trading decisions. Always practice proper risk management and thoroughly backtest its performance before using it in a live account.
Whale Activity Classic[nakano]## Whale Activity Classic
### Uncover the Hidden Intent of Volume
The **Whale Activity Classic ** indicator provides an unparalleled view into the nuanced volume dynamics within each candlestick. By analyzing sub-timeframe volume, it visually separates significant **large investor** activity from typical "Noise" volume, helping you understand the true forces driving price action.
This tool is designed to reveal the otherwise invisible movements of **large investors** and gauge overall market participation, giving you a deeper understanding than standard volume bars alone.
---
### Key Features:
* **Multi-Layered Volume Bars:**
* **Large Investor Volume (Densely Colored Bars):** Represents the aggregated volume from sub-timeframe candles where individual volume exceeded your defined threshold. Green indicates buying pressure (positive), and red indicates selling pressure (negative).
* **Normal Volume (Lightly Colored Bars):** Shows the total volume from sub-timeframe trades that fell *below* the threshold. This provides context about general market participation.
* **Comprehensive Customization:**
* **Symbol Selection:** Analyze the current chart's symbol or specify any custom symbol (e.g., crypto, stocks, forex) for in-depth analysis.
* **Lower Timeframe Analysis:** Choose your desired granularity from 1-second, 5-second, 10-second, 30-second, 1-minute, 5-minute, or 15-minute sub-timeframes.
* **Volume Thresholding:** Opt for a `Manual` fixed threshold or an `Automatic` calculation that adapts to current market conditions.
* **Noise Volume Visibility:** Toggle the display of "Normal Volume" bars to focus on **large investor** activity or view the complete picture.
* **Extensive Color Settings:** Customize the colors and transparency for all four volume types (**large investor** Positive/Negative, Normal Positive/Negative) to match your visual preferences.
---
### How to Use & Interpretation Tips:
* **Understanding Auto-Calculated Thresholds:** When `Automatic` calculation is selected, hover your cursor over any bar. The exact "Current Threshold" applied to that bar will be displayed in the status line at the top-left of the indicator panel.
* **Spotting Large Investor Intent:**
* If **Large Investor Volume (green/red bars)** is prominent while **Normal Volume (lightly colored bars)** is small, it suggests a sudden, significant move by a **large investor**, potentially against the prevailing retail sentiment.
* Conversely, if both **Large Investor Volume** and Normal Volume are large, it indicates strong trend momentum, drawing in both large institutions and retail participants.
* **Measuring Trend Strength:** Combined large **Large Investor Volume** and Normal Volume bars signify a robust trend with broad market participation.
* **Default Settings:** The automatic threshold's default settings (Period: 100, Multiplier: 25) are balanced for broad market application. However, we recommend adjusting these values to optimize performance for your specific asset and trading style.
---
### Important Notes:
* Analyzing longer chart timeframes (e.g., 1-hour, daily) with very low sub-timeframes may process a large amount of data, potentially affecting performance or causing errors. Using this indicator on **minute timeframes** is recommended.
* Always ensure your `Analysis Timeframe (Lower)` is **shorter** than your main chart's timeframe.
* Access to second-based timeframes (1S, 5S, etc.) requires a paid TradingView plan.
---
---
### 出来高の隠れた意図を解き明かす
**Whale Activity Classic ** インジケーターは、各ローソク足内で展開される微細な出来高の力関係を、かつてないほど詳細に可視化します。より短い時間足の出来高を分析することで、重要な**大口投資家**の活動と、一般的な「通常出来高(ノイズ)」を視覚的に分離し、値動きを動かす真の力を理解する手助けをします。
このツールは、通常の出来高バーでは見えない**大口投資家**の動きと、市場全体の参加状況を同時に把握するために設計されており、標準的な出来高表示だけでは得られない深い洞察を提供します。
---
### 主な機能:
* **多層的な出来高バー:**
* **大口投資家出来高(濃い色のバー):** 指定した閾値を超えた、より短い時間足の個々の出来高を合計したものです。緑色は買い圧力(プラス方向)、赤色は売り圧力(マイナス方向)を示します。
* **通常出来高(薄い色のバー):** 閾値に満たなかった取引の合計出来高を示します。これにより、一般的な市場参加の状況を把握できます。
* **包括的なカスタマイズ性:**
* **銘柄選択:** 現在のチャートの銘柄を分析することも、暗号資産、株式、FXなど、任意のカスタム銘柄を指定して詳細な分析を行うこともできます。
* **分析する時間足 (下位):** 1秒、5秒、10秒、30秒、1分、5分、15分から、分析の粒度を選択できます。
* **出来高の閾値:** 固定値を設定する「手動」モードと、現在の市場状況に適応する「自動」計算モードを選択できます。
* **通常出来高の表示:** チェックボックスで「通常出来高」バーの表示/非表示を切り替え、**大口投資家**の活動に焦点を当てるか、全体像を見るかを選択できます。
* **詳細なカラー設定:** 4種類の出来高タイプ(**大口投資家**プラス/マイナス、通常プラス/マイナス)すべての色と透明度を自由にカスタマイズできます。
---
### 使い方と分析のヒント:
* **自動計算された閾値の確認方法:** 「自動」計算を選択した場合、任意のバーにカーソルを合わせると、インジケーターパネルの左上にあるステータスラインに、そのバーに適用された正確な「現在の計算閾値」が表示されます。
* **大口投資家の意図を読み解く:**
* **大口投資家出来高(緑/赤のバー)が際立っている一方で、通常出来高(薄い色のバー)が小さい場合**、それは一般的な小売りのセンチメントとは異なる、**大口投資家**による突然の重要な動きを示唆している可能性があります。
* 逆に、**大口投資家出来高**と通常出来高の両方が大きい場合、それは大規模な機関投資家と個人投資家の両方を巻き込んだ、強いトレンドが発生していることを示します。
* **トレンドの勢いを測る:** **大口投資家出来高**と通常出来高のバーの両方が大きい場合、それは活発な市場参加を伴う、堅調なトレンドを示します。
* **デフォルト設定について:** 自動閾値のデフォルト設定(期間:100、倍率:25)は、幅広い市場に適用できるようバランスが取れています。ただし、ご自身の分析対象となる資産や取引スタイルに合わせて、これらの値を調整することをお勧めします。
---
### 重要な注意事項:
* メインチャートの時間足を長く(例:1時間足、日足)しすぎると、非常に細かい下位の時間足で大量のデータを処理することになり、パフォーマンスが低下したり、エラーが発生する可能性があります。このインジケーターは**分足での使用を推奨**します。
* 「分析する時間足 (下位)」は、必ずメインチャートの時間足より**短いもの**を選択してください。
* 秒足(1S、5Sなど)での分析には、TradingViewの有料プランへの加入が必要です。
---
Whale Activity[nakano]#### **Title**
Whale Activity
#### **Summary**
This indicator visualizes the micro-level power dynamics occurring inside each candlestick. It analyzes the volume of a user-defined lower timeframe (e.g., 1-second) within each bar of the main chart (e.g., 5-minute) and separately plots the total "buying pressure" (bullish volume) and "selling pressure" (bearish volume) that exceeded a significant volume threshold.
It's a tool designed to help you trace the footprints of "whales" (large-scale investors) that are often hidden in standard volume bars.
#### **Key Features**
* **Bi-directional Volume Bars:**
* **Upward Green Bars:** Represent the sum of volume from bullish (up) lower-timeframe candles that exceeded the volume threshold, signifying buying pressure.
* **Downward Red Bars:** Represent the sum of volume from bearish (down) lower-timeframe candles that exceeded the threshold, signifying selling pressure.
* **Complete Customization:**
* **Symbol to Analyze:** Freely select any instrument from any market (Crypto, Stocks, Forex, etc.).
* **Analysis Timeframe (Lower):** Choose the granularity of your analysis (1S, 5S, 10S, 1M, etc.) from a dropdown menu.
* **Volume Threshold (Lower TF):** Set a minimum volume to filter out market noise and focus only on significant trades.
#### **How to Use & Interpretation Tips**
* **See Through "Deceptive Volume":**
If a 5-minute candle has high total volume, but this indicator shows small green and red bars, it suggests the volume was comprised of many insignificant trades with no clear intent from large players ("whales").
* **Identify Dominant Pressure:**
Conversely, a large, protruding green bar with a small red bar indicates strong, persistent buying pressure and potential accumulation. The same applies to selling pressure.
* **Threshold Adjustment is Key:**
The "Volume Threshold" is critical and varies greatly between assets. A value of `1.0` might be suitable for BTC, while a stock like AAPL might require `100000` (shares). Adjust this value to fit the instrument you are analyzing to unlock the full potential of this tool.
#### **Disclaimer**
* Using this indicator on high chart timeframes (e.g., 1H, 1D) requires fetching a very large amount of data from the lower timeframe, which may lead to performance issues or script errors. It is recommended for use on intraday timeframes (e.g., 1M, 5M, 15M).
* Always ensure the selected "Analysis Timeframe (Lower)" is shorter than or equal to your main chart's timeframe.
---
#### **タイトル**
Whale Activity
#### **概要 (Summary)**
このインジケーターは、ローソク足の内部で起きている微細な力関係を可視化します。指定した時間足(例:5分足)の中に含まれる、さらに短い時間足(例:1秒足)の出来高を分析し、閾値を超えた「買い圧力(陽線出来高)」と「売り圧力(陰線出来高)」をそれぞれ合計して、上下のバーで表示します。
通常の出来高バーでは見えない「クジラ(大口投資家)」の動きの痕跡を探るためのツールです。
#### **主な機能 (Key Features)**
* **上下の出来高バー:**
* **緑のバー(上向き):** 閾値を超えた陽線(買い)の出来高の合計値を表します。
* **赤のバー(下向き):** 閾値を超えた陰線(売り)の出来高の合計値を表します。
* **完全なカスタマイズ性:**
* **分析する銘柄:** 暗号資産、株式、FXなど、あらゆる銘柄を自由に選択して分析できます。
* **分析する時間足 (下位):** 1秒、5秒、10秒など、分析の粒度をドロップダウンから選択できます。
* **出来高の閾値 (下位TF):** 市場のノイズを除去し、「意味のある」と判断する出来高の基準値を自由に設定できます。
#### **使い方・分析のヒント (How to Use & Interpretation Tips)**
* **「見せかけの出来高」を見破る:**
例えば、5分足の出来高が大きくても、このインジケーターのバーが両方とも小さい場合、それは閾値以下の小さな取引の集合であり、大口の明確な意図はないかもしれません。
* **優勢な力の特定:**
逆に、緑のバーだけが突出している場合、誰かが継続的に買い集めている強いシグナルと解釈できます。売りも同様です。
* **閾値の調整が鍵:**
「出来高の閾値」は、分析する銘柄や時間帯によって大きく異なります。BTCなら`1`、AAPL株なら`100000`のように、適切な値に調整することで、初めてこのツールは真価を発揮します。
#### **注意点 (Disclaimer)**
* チャートの時間足を長くする(例: 1時間足、日足)と、計算するデータ量が膨大になり、パフォーマンスが低下したり、エラーが発生する可能性があります。分足での使用を推奨します。
* 「分析する時間足 (下位)」は、必ずチャート本体の時間足よりも短いものを選択してください。

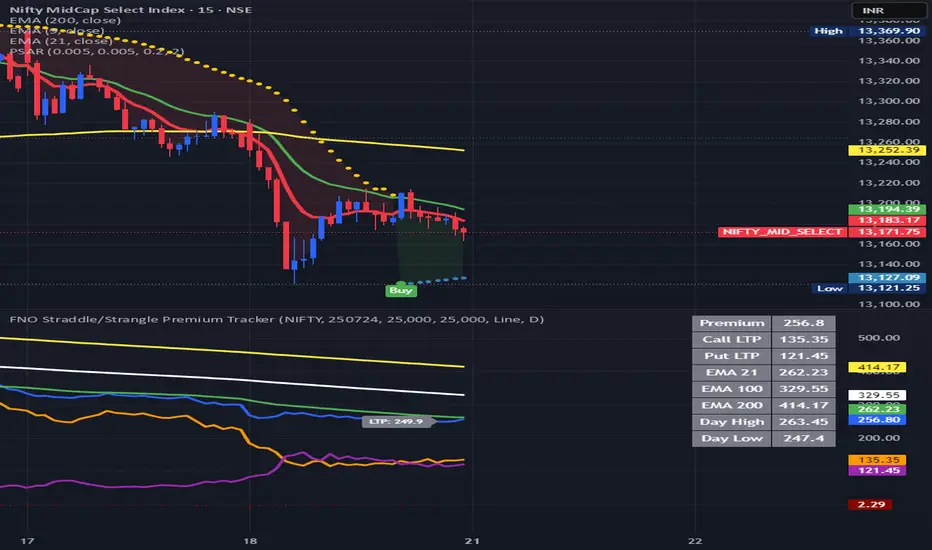
FNO Straddle/Strangle Premium TrackerThe FNO Straddle/Strangle Premium Tracker is a powerful Pine Script indicator designed for options traders to monitor the combined premium of a straddle or strangle strategy for Indian F&O instruments. It tracks the sum of call and put option prices, visualizes the premium as a candlestick or line chart, and includes technical indicators like EMAs and premium percentage change. The indicator also provides a real-time data table, alerts for key events, and exportable data for analysis, making it ideal for tracking premium movements and identifying trading opportunities.
Key Features
Customizable Inputs: Select from a wide range of underlying symbols (e.g., NIFTY, BANKNIFTY, stocks like RELIANCE, TCS), expiry date, call/put strike prices, chart type (Candlestick or Line), and timeframe (1-min to Daily).
Premium Visualization: Plots the combined premium (Call + Put) as a candlestick or line chart, with customizable colors for easy trend identification.
Exponential Moving Averages (EMAs): Displays 21, 100, and 200-period EMAs to track premium trends, with alerts for premium crossing above/below the 21-period EMA.
Premium % Change: Shows the percentage change in the combined premium as a histogram for quick momentum analysis.
Real-Time Data Table: A table in the top-right corner displays the latest premium, call/put Last Traded Prices (LTP), and EMA values (21, 100, 200).
Error Handling: Alerts users with a warning label if the selected symbol, expiry, or strike is invalid or data is unavailable.
Data Export: Outputs the latest premium, call LTP, and put LTP as a text string for easy copying or analysis.
LTP Label: Displays the current premium value every 5 bars for quick reference.
How It Works
Input Selection: Choose the underlying symbol, expiry date (YYMMDD format, e.g., 250626 for June 26, 2025), call and put strike prices, chart type, and timeframe.
Data Fetching: The script fetches real-time OHLC (Open, High, Low, Close) data for the selected call and put options using the specified symbol and expiry.
Premium Calculation: Combines the call and put option prices to calculate the straddle/strangle premium (Open, High, Low, Close).
Visualization: Plots the premium as a candlestick (green for bullish, red for bearish) or a blue line chart, along with EMAs, call/put LTP lines, and a premium % change histogram.
Alerts & Notifications: Triggers alerts when the premium crosses the 21-period EMA and displays a warning if data is invalid.
Data Display: Shows key metrics in a table and provides exportable data for further analysis.
Inputs
Select Symbol: Choose the underlying instrument (e.g., NIFTY, BANKNIFTY, RELIANCE, etc.).
Expiry Date: Enter the option expiry in YYMMDD format (e.g., 250626).
Call/Put Strike: Specify the strike prices for the call and put options.
Chart Type: Select "Candlestick" or "Line" to visualize the premium.
Timeframe: Choose the data aggregation period (e.g., 1-min, 5-min, Daily).
Outputs
Chart: Candlestick or line plot of the combined premium, with EMAs (21, 100, 200), call/put LTP, and premium % change histogram.
Table: Real-time display of premium, call/put LTP, and EMA values.
Alerts: Notifications for premium crossing EMA21 or invalid data.
Export Data: A text string with the latest premium, call LTP, and put LTP for external use.
Use Cases
Straddle/Strangle Trading: Monitor premium movements for at-the-money (ATM) straddles or out-of-the-money (OTM) strangles to time entries/exits.
Trend Analysis: Use EMAs to identify bullish or bearish trends in the premium.
Momentum Trading: Leverage the premium % change histogram to spot rapid price movements.
Risk Management: Track call and put LTP individually to assess option price behavior.
Data Analysis: Export premium data for backtesting or strategy development.
How to Use
Add the indicator to your TradingView chart.
Configure the inputs (symbol, expiry, strikes, chart type, timeframe) based on your trading setup.
Monitor the chart for premium trends, EMA crossovers, and % change signals.
Use the table and export data for real-time insights or external analysis.
Set up alerts to get notified when the premium crosses the 21-period EMA.
Notes
Ensure the symbol, expiry, and strike prices are valid for your data provider to avoid "Invalid Symbol" errors.
The indicator works best on Indian F&O instruments (NSE/BSE) with active options chains.
For optimal performance, use shorter timeframes (e.g., 1-min, 5-min) for intraday trading or Daily for positional analysis.
The premium % change histogram helps identify volatility spikes, useful for breakout strategies.
Limitations
Requires valid option chain data from TradingView’s data provider.
Performance may vary on low-liquidity instruments or illiquid strike prices.
Alerts are limited to EMA21 crossovers; additional custom alerts can be added as needed.
Feedback
If you have suggestions or need additional features (e.g., Bollinger Bands, RSI, or volatility metrics), feel free to comment! Happy trading!
NQ/MNQ Futures Delta+ with Price Action EntriesNQ/MNQ Futures Delta+ with Price Action Entries
Description: This TradingView indicator combines Futures Delta analysis with advanced price action techniques to provide an enhanced trading strategy for the NQ/MNQ futures market. The script analyzes the market using a variety of methods including Delta, volume analysis, and candlestick patterns, while also incorporating price action factors like support/resistance levels and breakouts to offer more refined buy and sell signals.
Key Features:
Delta Analysis:
The Delta calculation tracks the difference between buying and selling pressure within each market bar. The indicator calculates delta based on different modes (Classic, Volume Based, Tick Based), and then applies cumulative delta for trend analysis.
The Cumulative Delta is calculated using one of the three available modes:
Total: Tracks the cumulative delta over time.
Periodic: Measures delta over a defined period (user-configurable).
EMA: Applies an Exponential Moving Average to smooth the delta values.
Volume Confirmation:
The script includes volume analysis to confirm price movements. A volume spike is used to validate buy/sell signals, ensuring that price movements are supported by significant trading volume.
Price Action-Based Entries:
Support and Resistance: Dynamic support and resistance levels are calculated based on the lowest low and highest high of the last 20 bars. These levels are used to identify breakout points, providing context for potential buy/sell entries.
Candlestick Patterns: The script recognizes Bullish Engulfing and Bearish Engulfing candlestick patterns. These patterns signal potential reversals in price direction and are used to confirm trade entries.
Breakout Logic: Buy signals are triggered when the price breaks above resistance, and sell signals are triggered when the price breaks below support, providing high-probability entry points during trend reversals or continuations.
Moving Average Trend Confirmation:
The script uses two moving averages:
9-period Exponential Moving Average (EMA): Short-term trend indicator.
21-period Exponential Moving Average (EMA): Longer-term trend indicator.
Trades are only considered in the direction of the prevailing trend:
A bullish signal is confirmed if the price is above both EMAs.
A bearish signal is confirmed if the price is below both EMAs.
Buy/Sell Signal Triggers:
Buy Signal: A buy signal is triggered when:
A bullish divergence is confirmed with volume support.
A bullish engulfing candlestick pattern forms.
The price breaks above resistance.
The price is above both the 9 EMA and 21 EMA, indicating an uptrend.
Sell Signal: A sell signal is triggered when:
A bearish divergence is confirmed with volume support.
A bearish engulfing candlestick pattern forms.
The price breaks below support.
The price is below both the 9 EMA and 21 EMA, indicating a downtrend.
Visualization:
Delta Candles: The cumulative delta is plotted as a candlestick on the chart, with green and red coloring to show buying or selling dominance.
Support and Resistance Levels: Support and resistance zones are plotted to show key levels where price action may react.
Moving Averages: The 9 EMA and 21 EMA are plotted to show short-term and long-term trend direction.
Signal Markers: Buy and sell signals are marked on the chart with green triangles (buy) and red triangles (sell) for easy visualization of trade opportunities.
Alerts:
Alerts can be set up for buy and sell signals, enabling you to be notified when the script identifies potential trade opportunities based on Delta analysis, volume confirmation, and price action.
How to Use This Script:
Market: This script is optimized for NQ and MNQ futures contracts but can be adapted for other markets as well.
Signal Interpretation: Use the buy and sell signals for trend-following or counter-trend trades. These signals are particularly useful for 1-minute or 5-minute charts but can be adjusted to fit other timeframes.
Support/Resistance: Pay close attention to the dynamic support and resistance levels, as these are key price action points where significant price movements can occur.
Trend Confirmation: Ensure that trades are aligned with the overall trend confirmed by the 9 EMA and 21 EMA. The script prioritizes signals that align with the broader market trend.
Breakouts: Use the breakout logic to catch price moves when the market breaks key support or resistance levels. These can often lead to strong moves in the direction of the breakout.
Scalping Strategy Signal v2 by [INFINITYTRADER]Overview
This Pine Script (v6) implements a scalping strategy that uses higher timeframe data (default: 4H) to generate entry and exit signals, originally designed for the 15-minute timeframe with an option for 30-minute charts. The "Scalping Strategy Signal v2 by " integrates moving averages, RSI, volume, ATR, and candlestick patterns to identify trading opportunities. It features adjustable risk management with ATR-based stop-loss, take-profit, and trailing stops, plus dynamic position sizing based on user-set capital. Trades trigger only on the higher timeframe candle close (e.g., 4H) to limit activity within the same period. This closed-source script offers a structured scalping approach, blending multiple entry methods and risk controls for adaptability across market conditions.
What Makes It Unique
Unlike typical scalping scripts relying on single-indicator triggers (e.g., RSI alone or basic MA crossovers), this strategy combines four distinct entry methods—standard MA crossovers, RSI-based momentum shifts, trend-following shorts, and candlestick pattern logic—evaluated on a 4H timeframe for confirmation. This multi-layered design, paired with re-entry logic after losses and a mix of manual, ATR-based, and trailing exits, aims to balance trade frequency and reliability. The higher timeframe filter adds precision not commonly found in simpler scalping tools, while the 30-minute option enhances consistency by reducing noise.
How It Works
Timeframe Logic
Runs on a base timeframe (designed for 15-minute charts, with a 30-minute option) while pulling data from a user-chosen higher timeframe (default: 4H) for signal accuracy.
Limits entries to the close of each 4H candle, ensuring one trade per period to avoid over-trading in volatile conditions.
Indicators and Data
Moving Averages : Employs 21-period and 50-period simple moving averages on the higher timeframe to detect trends and signal entries/exits.
Volume : Requires volume to exceed 70% of its 20-period average on the higher timeframe for momentum confirmation.
RSI : Uses a 14-period RSI for overbought/oversold filtering and a 6-period RSI for precise entry timing.
ATR : Applies a 14-period Average True Range on the higher timeframe to set adaptive stop-loss and take-profit levels.
Candlestick Patterns : Analyzes consecutive green or red 4H bars for trend continuation signals.
Why These Indicators
The blend of moving averages, RSI, volume, ATR, and candlestick patterns forms a robust scalping framework. Moving averages establish trend context, RSI filters momentum and avoids extremes, volume confirms market activity, ATR adjusts risk to volatility, and candlestick patterns enhance entry timing with price action insights. Together, they target small, frequent moves in flat or trending markets, with the 4H filter reducing false signals common in lower-timeframe scalping.
Entry Conditions
Four entry methods are evaluated at the 4H candle close:
Standard Long Entry: Price crosses above the 21-period moving average, volume exceeds 70% of its 20-period average, and the 1H 14-period RSI is below 70—confirms uptrend momentum.
Special Long Entry: The 6-period RSI crosses above 23, price is more than 1.5 times the ATR from the 21-period moving average, and price exceeds its prior close—targets oversold bounces with a stop-loss at the 4H candle’s low.
Short Entries:
- RSI-Based: The 6-period RSI crosses below 68 with volume support—catches overbought pullbacks.
- Trend-Based: Price crosses below the 21-period moving average, volume is above 70% of its average, and the 1H 14-period RSI is above 30—confirms downtrends.
Red/Green Bar Logic: Two consecutive green 4H bars for longs or red 4H bars for shorts—uses candlestick patterns for continuation, with a tight stop-loss from the base timeframe candle.
Re-Entry Logic
Long : After a losing special long, triggers when the 6-period RSI crosses 27 and price crosses the 21-period moving average.
Short : After a losing short, triggers when the 6-period RSI crosses 50 and price crosses below the 21-period moving average.
Purpose: Offers recovery opportunities with stricter conditions.
Exit Conditions
Manual Exits: Longs close if the 21-period MA crosses below the 50-period MA or the 1H 14-period RSI exceeds 68; shorts close if the 21-period MA crosses above the 50-period MA or RSI drops below 25.
ATR-Based TP/SL: Stop-loss is entry price ± ATR × 1.5 (default); take-profit is ± ATR × 4 (default), checked at 4H close.
Trailing Stop: Adjusts ±6x ATR from peak/trough, closing if price retraces within 1x ATR.
Special/Tight SL: Special longs exit if price opens below the 4H candle’s low; 4th method entries use the base timeframe candle’s low/high, checked every bar.
Position Sizing
Bases trade value on user-set capital (default: 100 USDT), dividing by the higher timeframe close price for dynamic sizing.
Visualization
Displays a table at the bottom-right with current/previous signals, TP/SL levels, equity, trading pair, and trade size—color-coded for clarity (green for buy, red for sell).
Inputs
Initial Capital (USDT): Sets trade value (default: 100, min: 1).
ATR Stop-Loss Multiplier: Adjusts SL distance (default: 1.5, min: 1).
ATR Take-Profit Multiplier: Adjusts TP distance (default: 4, min: 1).
Higher Timeframe: Selects analysis timeframe (options: 1m, 5m, 15m, 30m, 1H, 4H, D, W; default: 4H).
Usage Notes
Intended Timeframe: Designed for 15-minute charts with 4H confirmation for precision and frequency; 30-minute charts improve consistency by reducing noise.
Backtesting: Adjust ATR multipliers and capital to match your asset’s volatility and risk tolerance.
Risk Management: Combines manual, ATR, and trailing exits—monitor to avoid overexposure.
Limitations: 4H candle-close dependency may delay entries in fast markets; RSI/volume filters can reduce trades in low-momentum periods.
Backtest Observations
Tested on BTC/USDT (4H higher timeframe, default settings: Initial Capital: 100 USDT, ATR SL: 1.5x, ATR TP: 4x) across market conditions, comparing 15-minute and 30-minute charts:
Bull Market (Jul 2023 - Dec 2023):
15-Minute: 277 long, 219 short; Win Rate: 42.74%; P&L: 108%; Drawdown: 1.99%; Profit Factor: 3.074.
30-Minute: 257 long, 215 short; Win Rate: 49.58%; P&L: 116.85%; Drawdown: 2.34%; Profit Factor: 3.14.
Notes: Moving average crossovers and green bar patterns suited this bullish phase; 30-minute improved win rate and P&L by filtering weaker signals.
Bear Market (Jan 2022 - Jun 2022):
15-Minute: 262 long, 211 short; Win Rate: 44.4%; P&L: 239.80%; Drawdown: 3.74%; Profit Factor: 3.419.
30-Minute: 250 long, 200 short; Win Rate: 52.22%; P&L: 258.77%; Drawdown: 5.34%; Profit Factor: 3.461.
Notes: Red bar patterns and RSI shorts thrived in the downtrend; 30-minute cut choppy reversals for better consistency.
Flat Market (Jan 2021 - Jun 2021):
15-Minute: 280 long, 208 short; Win Rate: 51.84%; P&L: 340.33%; Drawdown: 9.59%; Profit Factor: 2.924.
30-Minute: 270 long, 209 short; Win Rate: 55.11%; P&L: 315.42%; Drawdown: 7.21%; Profit Factor: 2.598.
Notes: High trade frequency and P&L showed strength in ranges; 30-minute lowered drawdown for better risk control.
Results reflect historical performance on BTC/USDT with default settings—users should test on their assets and timeframes. Past performance does not guarantee future results and is shared only to illustrate the strategy’s behavior.
Why It Works Well in Flat Markets
A "flat market" lacks strong directional trends, with price oscillating around moving averages, as in Jan 2021 - Jun 2021 for BTC/USDT. This strategy excels here because its crossover-based entries trigger frequently in tight ranges. In trending markets, an exit might not be followed by a new entry without a pullback, but flat markets produce multiple crossovers, enabling more trades. ATR-based TP/SL and trailing stops capture these small swings, while RSI and volume filters ensure momentum, driving high P&L and win rates.
Technical Details
Built in Pine Script v6 for TradingView compatibility.
Prevents overlapping trades with long/short checks.
Handles edge cases like zero division and auto-detects the trading pair’s base currency (e.g., BTC from BTCUSDT).
This strategy suits scalpers seeking structured entries and risk management. Test on 15-minute or 30-minute charts to match your style and market conditions.

tripleFlows Master EUR - by ManhDNThe TripleFlows Master EUR indicator is a technical analysis tool designed for TradingView to systematically evaluate the strength or weakness of the Euro (EUR) across 7 major currency pairs. This indicator provides a clear and objective measure of EUR momentum by analyzing moving averages, aggregating the data into a comprehensive Flow Index, and visualizing the collective price action of the Euro.
---
How It Works
1. Data Collection:
- The indicator pulls price data from the 7 most significant EUR currency pairs:
EUR/USD, EUR/JPY, EUR/GBP, EUR/AUD, EUR/CAD, EUR/NZD, and EUR/CHF.
2. Moving Average Calculation:
- For each of the 7 currency pairs, the indicator computes:
- A 5-period moving average (MA).
- A 20-period moving average (MA).
- It then compares these two moving averages to identify whether the trend for each pair is bullish or bearish:
- If MA(5) > MA(20), the trend is considered bullish for the Euro.
- If MA(5) < MA(20), the trend is considered bearish for the Euro.
3. Flow Index Aggregation:
- The indicator aggregates the trend signals from all 7 currency pairs to calculate a Flow Index, which ranges from -100 to +100:
- +100: All 7 pairs indicate a bullish trend for EUR (maximum strength).
- -100: All 7 pairs indicate a bearish trend for EUR (maximum weakness).
- Values closer to 0 indicate a more neutral market condition.
4. Visual Representation of Composite Price Action:
- In addition to the Flow Index, the TripleFlows Master EUR generates a **composite candlestick chart** based on the aggregated price action of the 7 EUR pairs.
- This chart provides a clear visual representation of the Euro's overall price behavior, allowing traders to analyze trends directly through candlestick patterns and moving averages.
- By observing this chart, traders can make decisions based on the combined action of all 7 pairs, rather than relying on a single pair.
5. Triple Flow Calculation Across Timeframes:
- The Flow Index is calculated on three timeframes:
- Junior (short timeframe).
- Medior (medium timeframe).
- Senior (long timeframe).
- The indicator evaluates the Flow Index across these three timeframes to determine Triple Flow:
- Triple Flow Up (Bullish): All three timeframes show a Flow Index of +100.
- Triple Flow Down (Bearish): All three timeframes show a Flow Index of -100.
---
Purpose and Application
- Trend Confirmation:
The TripleFlows Master EUR provides objective trend confirmation by synthesizing data across multiple pairs and timeframes.
- Bullish Trend: Look for opportunities to go long when Triple Flow Up is confirmed.
- Bearish Trend: Look for opportunities to go short when Triple Flow Down is confirmed.
- Multi-Timeframe Consistency:
The synchronization of the Flow Index across junior, medior, and senior timeframes ensures high-probability setups by aligning short-term and long-term trends.
- Composite Price Action Analysis:
The composite candlestick chart simplifies the analysis of EUR price behavior by aggregating data from 7 pairs, helping traders identify trends, key levels, and patterns visually.
---
Outputs and Visuals
1. Flow Index:
- Displayed as a value between -100 and +100, showing the aggregated strength or weakness of the Euro.
2. Composite Candlestick Chart:
- A real-time chart that represents the Euro's collective price action across 7 pairs.
3. Triple Flow Status:
- Visual indication of Triple Flow conditions (e.g., Triple Flow Up or Triple Flow Down) based on the alignment of Flow Index values across all three timeframes.
4. Alerts:
- The indicator includes alerts for when a Triple Flow Up or Down condition is detected, allowing users to respond to key market opportunities.
---
Technical Notes
- Flow Index Calculation:
The calculation is based purely on the relative position of the 5-period and 20-period moving averages across 7 pairs. It does not rely on external factors, ensuring the results are fully derived from price data.
- Composite Price Action:
The composite candlestick chart integrates the aggregated price movements of 7 pairs into a single, easy-to-read visual representation.
- Scalability Across Timeframes:
The TripleFlows Master EUR can be applied to any trading style, as it adapts to various timeframes:
- Junior timeframe for intraday analysis.
- Medior timeframe for swing trading.
- Senior timeframe for position trading.
---
Conclusion
The TripleFlows Master EUR indicator provides a robust, data-driven solution for analyzing the Euro’s performance across major currency pairs. By aggregating price action from 7 pairs into a composite candlestick chart and synchronizing trends across multiple timeframes, the indicator eliminates the limitations of analyzing individual pairs in isolation. This comprehensive approach ensures traders can identify trends and opportunities with greater accuracy and confidence.
Outside Bar Strategy % (Alessio)Outside Bar Strategy %
This strategy is based on identifying Outside Bars, which occur when the current bar's high is higher than the previous bar's high and its low is lower than the previous bar's low. The strategy enters trades in the direction of the Outside Bar, offering a powerful way to capture price moves following a strong price expansion.
Key Features:
Long and Short Entries: The strategy enters a Long trade when the Outside Bar closes bullish (current close > open), and a Short trade when the Outside Bar closes bearish (current close < open).
Customizable Entry Levels: The entry point is calculated based on a customizable percentage of the Outside Bar's range, allowing flexibility for traders to fine-tune their entries at 50% or 70% of the bar's range.
Stop Loss (SL) and Take Profit (TP):
Stop Loss (SL) is automatically placed at the Outside Bar's low for Long trades and at its high for Short trades.
Take Profit (TP) is calculated as a percentage of the Outside Bar's range, with customizable settings for take-profit levels.
Visual Indicators:
Entry, Stop Loss, and Take Profit levels are plotted as lines on the chart, with customizable colors and widths for easy identification.
Labels are placed on the chart to indicate whether the trade is Long or Short, positioned above or below the Outside Bar's candlestick.
Alerts: Users can enable alerts to receive notifications when a trade is triggered, including details such as entry points and stop loss levels.
Strategy Parameters:
Entry Percentage: Set the entry level as a percentage of the Outside Bar's range (e.g., 50%, 70%).
Take Profit Percentage: Customize the Take Profit level as a percentage of the Outside Bar's range.
Customizable Colors and Line Widths: Adjust the colors and thickness of the entry, stop loss, and take profit lines to fit your preferences.
Alerts: Enable alerts to be notified when a trade is executed or when the entry level is reached.
This strategy is ideal for traders who want to capitalize on significant price moves after a breakout, with clear risk management through Stop Loss and Take Profit levels. The customizable features make it suitable for various market conditions and trading styles.

Holy-Cow IndicatorHoly-Cow Indicator
Advanced Multi-Pattern Candlestick Analyzer (HC, NV, RN)
Description
Overview
This indicator is designed to detect key candlestick patterns based on foundational principles of price action analysis, now presented with a modernized approach for easier recognition and enhanced utility. Drawing inspiration from the work of candlestick charting pioneer Steve Nison (Japanese Candlestick Charting Techniques) and advanced price action strategies popularized by Linda Raschke (Street Smarts), this tool identifies and highlights unique combinations such as the Holy-Cow (HC), Nova (NV), and Red-Nova (RN) patterns.
These patterns simplify the complexities of price action into actionable setups, making them suitable for all types of traders.
Features
Inside Bars (IB):
Marks consolidation zones where the current candle’s range is inside the previous candle’s range. Useful for spotting breakout opportunities.
Outside Bars (OB):
Identifies candles where the current range exceeds the previous candle’s range.
Indicates potential reversals or trap setups.
Holy-Cow Pattern (HC):
Inspired by: Trap + Consolidation Setup
An Outside Bar followed by an Inside Bar.
Highlights volatility followed by tight consolidation, often preceding a breakout.
Nova Pattern (NV):
Inspired by: Breakout Trap + Expansion
An Inside Bar followed by an Outside Bar.
Signals breakout traps and subsequent volatility, useful for reversals or momentum moves.
Red-Nova Pattern (RN):
Inspired by: Volatility Trap + Major Breakout Zone
A combination of Holy-Cow (HC) and Nova (NV) patterns.
Represents a highly compressed market state, often leading to significant, high-intensity moves.
Bollinger Bands Integration:
Provides context on volatility and potential overbought/oversold levels.
Customizable Visibility:
Toggle specific patterns (IB, OB, HC, NV, RN) to suit your trading strategy.
How to Use
Pattern Detection:
Enable the patterns you want to focus on through the settings panel (e.g., HC for breakout setups, RN for high-intensity moves).
Observe highlighted zones and labels for actionable trade setups.
Trading Strategies:
Breakout Trades:
Look for HC, NV, or RN patterns near support/resistance and trade in the breakout direction.
Reversal Trades:
Use NV or RN patterns forming near key levels to catch reversals.
Stop-Loss:
Place below/above the low/high of the identified pattern.
Take Profit:
Use support/resistance levels, Fibonacci extensions, or a predefined risk-reward ratio (e.g., 2:1).
Recommended Timeframes:
1–15 minutes: Scalping or intraday trading.
1-hour: Intraday and swing trading.
Daily/Weekly: Ideal for significant trend analysis and major market moves.
Acknowledgments
This indicator is based on well-established trading principles and enhanced with unique combinations for modern trading. The foundational ideas behind these patterns are drawn from:
Steve Nison: Who introduced candlestick charting to Western traders in his seminal work, Japanese Candlestick Charting Techniques, and popularized concepts such as Inside and Outside Bars.
Linda Raschke: Who furthered the application of price action patterns in her book Street Smarts, showcasing multi-bar setups and momentum strategies.
While the patterns Holy-Cow (HC), Nova (NV), and Red-Nova (RN) are unique to this indicator, they build upon these foundational principles to offer traders actionable insights.
Disclaimer
This indicator is an independent creation inspired by publicly available price action principles. It is not affiliated with any proprietary tool or service. Back testing and proper risk management are strongly advised before live trading.
