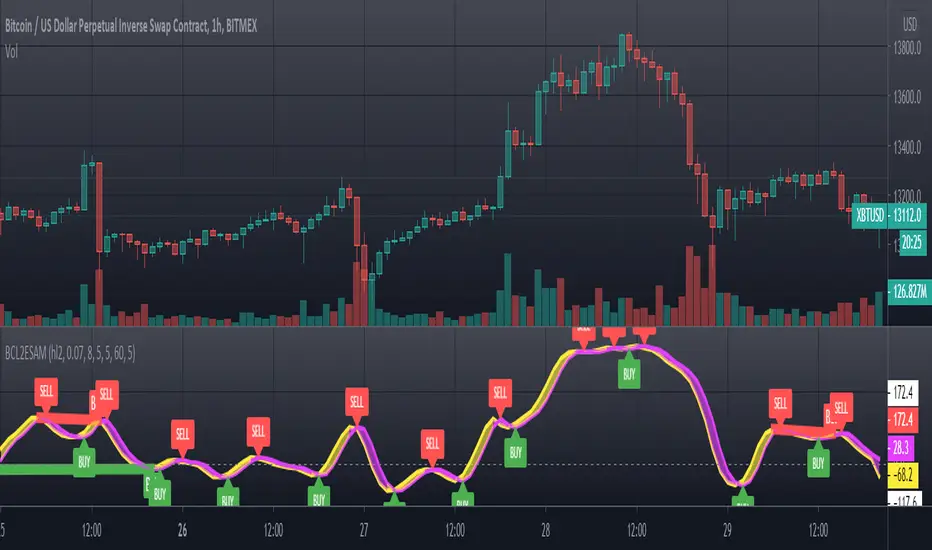
[blackcat] L2 Ehlers Even Better SinwaveLevel: 2
Background
John F. Ehlers introduced Even Better sinwave Indicator in his "Cycle Analytics for Traders" chapter 12 on 2013.
Function
The original Sinewave Indicator was created by seeking the dominant cycle phase angle that had the best correlation between the price data and a theoretical dominant cycle sine wave. The Even Better Sinewave Indicator skips all the cycle measurements completely and relies on a strong normalization of the waveform at the output of a modified roofing filter. The modified roofing filter uses a single-pole high-pass filter to deliberately retain the longer-period trend components. The single-pole high-pass filter basically levels the amplitude of all the cycle components that would otherwise be larger with longer wavelengths due to Spectral Dilation. Therefore, when the waveform is normalized to the power in the waveform over a short period of time, the longer wavelength contributions tend to be an indication to stay in a trade when the market is in a trend.
The Even Better Sinewave Indicator works extraordinarily well when the market is in a trend mode. This means that the spectacular failures of most swing wave indicators are mitigated when the expected price turning point does not occur.
Although Dr. Ehlers admitted he had not studied it extensively, it appears that the Even Better Sinewave Indicator works well on futures intraday data. It takes a position in the correct direction and tends to stay with the good trades without excessive whipsawing.
Key Signal
Wave --> Even Better sinwave Indicator fast line
Trigger --> Even Better sinwave Indicator slow line
Pros and Cons
100% John F. Ehlers definition translation of original work, even variable names are the same. This help readers who would like to use pine to read his book. If you had read his works, then you will be quite familiar with my code style.
Remarks
The 55th script for Blackcat1402 John F. Ehlers Week publication.
Readme
In real life, I am a prolific inventor. I have successfully applied for more than 60 international and regional patents in the past 12 years. But in the past two years or so, I have tried to transfer my creativity to the development of trading strategies. Tradingview is the ideal platform for me. I am selecting and contributing some of the hundreds of scripts to publish in Tradingview community. Welcome everyone to interact with me to discuss these interesting pine scripts.
The scripts posted are categorized into 5 levels according to my efforts or manhours put into these works.
Level 1 : interesting script snippets or distinctive improvement from classic indicators or strategy. Level 1 scripts can usually appear in more complex indicators as a function module or element.
Level 2 : composite indicator/strategy. By selecting or combining several independent or dependent functions or sub indicators in proper way, the composite script exhibits a resonance phenomenon which can filter out noise or fake trading signal to enhance trading confidence level.
Level 3 : comprehensive indicator/strategy. They are simple trading systems based on my strategies. They are commonly containing several or all of entry signal, close signal, stop loss, take profit, re-entry, risk management, and position sizing techniques. Even some interesting fundamental and mass psychological aspects are incorporated.
Level 4 : script snippets or functions that do not disclose source code. Interesting element that can reveal market laws and work as raw material for indicators and strategies. If you find Level 1~2 scripts are helpful, Level 4 is a private version that took me far more efforts to develop.
Level 5 : indicator/strategy that do not disclose source code. private version of Level 3 script with my accumulated script processing skills or a large number of custom functions. I had a private function library built in past two years. Level 5 scripts use many of them to achieve private trading strategy.
Pesquisar nos scripts por "12月4号是什么星座"

VPoC per barThis study prints the current bar VPoC as an horizontal line.
It's aimed originally at BTCUSDT pair and 15m timeframe.
HOW IT WORKS
Zoom In mode: This is the default mode.
The study zooms in into the latest 15 1-minute bar candles in order to calculate the 15 minute candle VPoC.
Zoom Out mode: The VPoC from the last n bars from the current timeframe that match desired timeframe is shown on each bar.
In either case you are recommended to click on the '...' button associated to this study
and select 'Visual Order. Bring to Front.' so that it's properly shown in your chart.
HOW IT WORKS - Zoom In mode
Make sure that '(VP) Zoom into the VP timeframe' setting is set to true.
Choose the zoomed in timeframe where to calculate VPoC from thanks to the '(VP) Zoomed timeframe {1 minute}' setting.
Change '(VP) Zoomed in timeframe bars per current timeframe bar {15}' to its appropiated value. You just need to divide the current timeframe minutes per the zoomed in timeframe minutes per bar. E.g. If you are in 60 minute timeframe and you want to zoom in into 5 minute timeframe: 60 / 5 = 12 . You will write 12 here.
HOW IT WORKS - Zoom Out mode
Make sure that '(VP) Zoom into the VP timeframe' setting is set to false.
If you are using the Zoom out mode you might want to set '(VP) Print VPoC price as discrete lines {True}' to false.
Either choose the zoommed out timeframe where to calculate VPoC from thanks to the '(VP) Zoomed timeframe {1 minute}' setting or turn on the '(VP) Use number of bars (not VP timeframe)' setting in order to use '(VP) Number of bars {100}' as a custom number of bars.
WARNING - Zoom In mode last bar
The way that PineScript handles security function in last bar might result on the last bar not being accurate enough.
SETTINGS
__ SETTINGS - Volume Profile
(VP) Zoomed timeframe {1 minute}: Timeframe in which to zoom in or zoom out to calculate an accurate VPoC for the current timeframe.
(VP) Zoomed in timeframe bars per current timeframe bar {15}: Check 'HOW IT WORKS - Zoom In mode' above. Note : It is only used in 'Zoom in' mode.
(VP) Number of bars {100}: If 'Use number of bars (not VP timeframe)' is turned on this setting is used to calculate session VPoC. Note : It is only used in 'Zoom out' mode.
(VP) Price levels {24}: Price levels for calculating VPoC.
__ SETTINGS - MAIN TURN ON/OFF OPTIONS
(VP) Print VPoC price {True}: Show VPoC price
(VP) Zoom into the VP timeframe: When set to true the VPoC is calculated by zooming into the lower timeframe. When set to false a higher timeframe (or number of bars) is used.
(VP) Realtime Zoom in (Beta): Enable real time zoom for the last bar. It's beta because it would only work with zoomed in timeframe under 60 minutes. And when ratio between zoomout and zoomin is less than 60. Note : It is only used in 'Zoom in' mode.
(VP) Use number of bars (not VP timeframe): Uses 'Number of bars {100}' setting instead of 'Volume Profile timeframe' setting for calculating session VPoC. Note : It is only used in 'Zoom out' mode.
(VP) Print VPoC price as discrete lines {True}: When set to true the VPoC is shown as an small line in the center of each bar. When set to the false the VPoC line is printed as a normal line.
__ SETTINGS - EXTRA
(VP) VPoC color: Change the VPoC color
(VP) VPoC line width {1}: Change VPoC line width (in pixels).
(VP) Use number of bars (not VP timeframe): Uses 'Number of bars {100}' setting instead of 'Volume Profile timeframe' setting for calculating session VPoC. Note : It is only used in 'Zoom out' mode.
(VP) Print VPoC price as discrete lines {True}: When set to true the VPoC is shown as an small line in the center of each bar. When set to the false the VPoC line is printed as a normal line.
CREDITS
I have reused and adapted some code from
"Poor man's volume profile" study
which it's from TradingView IldarAkhmetgaleev user.

[blackcat] L2 Ehlers Smoothed Adaptive MomentumLevel: 2
Background
John F. Ehlers introuced Smoothed Adaptive Momentum in his "Cybernetic Analysis for Stocks and Futures" chapter 12 on 2004.
Function
Smoothed Adaptive Momentum is to measure the Dominant Cycle period and then use that measured period to take a onecycle momentum. It really does matter if you measure the Dominant Cycle. The trend component is measured by taking the momentum across one full Dominant Cycle.
Key Signal
Mom ---> Smoothed Adaptive Momentum fast line
Trigger ---> Smoothed Adaptive Momentum slow line
Pros and Cons
100% John F. Ehlers definition translation of original work, even variable names are the same. This help readers who would like to use pine to read his book. If you had read his works, then you will be quite familiar with my code style.
Remarks
The 28th script for Blackcat1402 John F. Ehlers Week publication.
Readme
In real life, I am a prolific inventor. I have successfully applied for more than 60 international and regional patents in the past 12 years. But in the past two years or so, I have tried to transfer my creativity to the development of trading strategies. Tradingview is the ideal platform for me. I am selecting and contributing some of the hundreds of scripts to publish in Tradingview community. Welcome everyone to interact with me to discuss these interesting pine scripts.
The scripts posted are categorized into 5 levels according to my efforts or manhours put into these works.
Level 1 : interesting script snippets or distinctive improvement from classic indicators or strategy. Level 1 scripts can usually appear in more complex indicators as a function module or element.
Level 2 : composite indicator/strategy. By selecting or combining several independent or dependent functions or sub indicators in proper way, the composite script exhibits a resonance phenomenon which can filter out noise or fake trading signal to enhance trading confidence level.
Level 3 : comprehensive indicator/strategy. They are simple trading systems based on my strategies. They are commonly containing several or all of entry signal, close signal, stop loss, take profit, re-entry, risk management, and position sizing techniques. Even some interesting fundamental and mass psychological aspects are incorporated.
Level 4 : script snippets or functions that do not disclose source code. Interesting element that can reveal market laws and work as raw material for indicators and strategies. If you find Level 1~2 scripts are helpful, Level 4 is a private version that took me far more efforts to develop.
Level 5 : indicator/strategy that do not disclose source code. private version of Level 3 script with my accumulated script processing skills or a large number of custom functions. I had a private function library built in past two years. Level 5 scripts use many of them to achieve private trading strategy.
Fibonacci-Trading-Indikator_3Daily (weekly, monthly) profits with the Fibonacci trading indicator_3
Quotes move in Fibonacci ratios in liquid markets. With this indicator you receive information for daily trades or for position trades based on a week or on a monthly basis, in which area you should ideally enter the market and where the minimum achievable price target is. This price target is 61.8% of yesterday's trading range, or the trading range of the previous week, or the trading range of the previous month, depending on the time frame for which the indicator should calculate the minimum achievable high / low. This is also where you realize your profit.
For this calculation, the following entries must be made in the properties window of the indicator:
• Preselection uptrend / downtrend.
• Time frame (day, week, ...) of the price bar for the possible high / low to be determined.
• Trading range of the previous day, or the previous week, or the previous month.
• Current lowest low of the selected time frame when trading has started and prices are rising.
• Current highest high of the selected time frame when trading has started and prices are falling.
Important areas for trading are:
• The entry range 0% - 23.6% for long or short.
• The target price level 61.8%.
Choose a suitable time frame to detect the direction of movement while the quotes are still moving in the entry area. The camelback indicator can be of great help. Also test the resolution setting of the camelback indicator. With a resolution of 1 hour in the 6 or 12 minute chart, you get a perspective for the broader direction. Movement patterns of corrections or consolidations, if they last more than a day or a week, also give clues to the coming direction of movement for the trade. So look back to see what happened yesterday, a week ago, or a month ago. Pay attention to the market anatomy, find out how the market works, count the price bars in consolidations and trends.
After entering the values the indicator will show the Fibonacci expansion price levels for the possible high or low for the selected time frame. Buy / sell within the entry range between 0% and 23.6% as the market moves towards the last long / or short entry point. This is the course range up to the 23.6% course level. The 61.8% price level is the minimum expected price target. We assume that the current bar will reach at least 61.8% of the trading range of the previous day, week or month. Depending on the set time frame. You should therefore realize the profits you have made with 50% of the position when the prices have reached the 61.8% level. With a suitable trailing stop you can be stopped with the rest of the position, but do not risk more than 50% of the profits.
With the quarter or year preselection and the corresponding entries, the minimum expected quarterly high / quarterly low or annual high / annual low can be determined.
The Fibonacci price levels can be shown and hidden. In the chart click on the gear wheel for “Chart Settings”. In the “Scaling” menu, the price levels can be displayed with the preselection “Label for indicator names” and “Label for last indicator value”. Slide the chart to the right to find possible support and resistance at the price levels that could provide confirmation of the target.
In the event of input errors or missing entries for a time frame, the indicator is hidden.
Pay attention to your trade management to avoid losses.
The new Fibonacci Trading Indicator_3 has the following additions and changes:
Area code for the quarter time frame has been added.
The entry area received a 23.6% and a 50% subdivision. Two envelope lines above the 23.6% entry level in the case of an upward trend and below the 23.6% entry level in the case of a downtrend, with a width of 23.6% and 14.6% of the entry level, are intended to indicate that the closing price is higher the quotations have broken out of the entry-level area.
A volatility stop for upward and downward trends can be activated.
A factor is added to the fluctuation range of each price bar for the stop. Then a moving average is calculated with an adjustable period. The period setting should be set between 5 and 10. The result can be smoothed adjustable.
Presetting:
Periods = 10
Factor = 1.4
Smoothing = 7
With the assumption that the market entry in an upward trend occurs when the prices break out above a bar high, the result of the stop calculation is subtracted from the bar high. In the case of a downward trend, the result of the stop calculation is added to the price bar low.
When entering the market, set the factor to 2.4. If inside bars follow a trend movement, the stop should be brought closer. Try the factor setting 0.4 or less. The smallest adjustable factor is 0.1.
For the entry into an established trend, as described in an idea contribution by me, there are two switchable moving averages. The application for the (MA_H) takes place on high and for the (MA_L) adjustable on high, low, shot, h + 1/2 etc. Period and offset (shift) are adjustable. With this idea, the entry into the market occurs between a 618% correction (the Fibonacci entry point) and the DEP (average entry point). The DEP in this case is the MA_H with period = 4 and an offset = 1 in the case of a downward trend, or the MA_L with the same setting and application to lows in an upward trend.
Also test the MA_L in trends with the settings (period, offset) 3.3 or 5, 3 or 7.5 and applying it to closing prices for a close encompassing of the highs / lows.
Tägliche (wöchentliche, monatliche) Gewinne mit dem Fibonacci-Trading Indikator_3
Kursnotierungen bewegen sich in liquiden Märkten in Fibonacci-Verhältnisse. Mit diesem Indikator erhalten Sie für Tagesgeschäfte, oder für Positionstrades auf Basis einer Woche, oder auf Basis eines Monats Informationen, in welchem Bereich Sie idealerweise in den Markt einsteigen sollten und wo das mindeste erreichbare Kursziel liegt. Dieses Kursziel liegt bei 61,8% der gestrigen Handelspanne, oder der Handelspanne der Vorwoche, oder der Handelspanne des Vormonats, also abhängig davon für welchen Zeitrahmen der Indikator das mindeste erreichbare Hoch/Tief berechnen soll. Dort realisieren Sie auch Ihren Gewinn.
Für diese Berechnung sind folgende Eingaben im Eigenschaftenfenster des Indikators einzustellen:
• Vorwahl Aufwärtstrend/ Abwärtstrend.
• Zeitrahmen (Tag, Woche, …) des Kursbalkens für das zu ermittelnde mögliche Hoch/ Tief.
• Handelspanne des vorherigen Tages, oder der vorherigen Woche, oder des vorherigen Monats.
• Aktuell tiefstes Tief des vorgewählten Zeitrahmens, wenn der Handel begonnen hat und die Notierungen steigen.
• Aktuell höchstes Hoch des vorgewählten Zeitrahmens, wenn der Handel begonnen hat und die Notierungen fallen.
Wichtige Bereiche für das Trading sind:
• Der Einstiegsbereich 0% - 23,6% für long oder short.
• Der Kursziellevel 61,8%.
Wählen Sie für die Erkennung der Bewegungsrichtung einen geeigneten Zeitrahmen, während sich die Notierungen noch im Einstiegsbereich bewegen. Der Camelback-Indikator kann eine gute Hilfe sein. Testen Sie auch die Auflösung-Einstellung des Camelback-Indikators. Mit der Auflösung 1 Stunde Im 6- oder 12 Minuten-Chart erhalten Sie einen Blickwinkel für die große Richtung. Auch Bewegungsmuster von Korrekturen oder Konsolidierungen, wenn sie mehr als einen Tag oder eine Woche andauern geben Hinweise auf die kommende Bewegungsrichtung für den Trade. Schauen Sie also zurück um zu prüfen, was sich gestern, vor einer Woche oder vor einem Monat abgespielt hat. Achten sie auf die Marktanatomie, finden Sie heraus wie der Markt funktioniert, zählen Sie Kursstäbe in Konsolidierungen und Trends.
Nach Eingabe der Werte zeigt der Indikator die Fibonacci-Ausweitungskurslevels für das mögliche Hoch oder Tief für den ausgewählten Zeitrahmen. Kaufen/ verkaufen Sie innerhalb des Einstiegsbereichs zwischen 0% und 23,6%, während sich der Markt in Richtung des letzten long-/ oder short-Einstiegspunktes bewegt. Das ist der Kursbereich bis zum 23,6%- Kurslevel. Der 61,8%-Kurslevel ist das mindeste erwartbare Kursziel. Wir gehen davon aus, dass der aktuelle Kursbalken mindestens 61,8% der Handelsspanne des vorherigen Tages, der vorherigen Woche oder des vorherigen Monats erreichen wird. Abhängig vom eingestellten Zeitrahmen. Realisieren Sie deshalb die angelaufenen Gewinne mit 50% der Position, wenn die Notierungen den 61,8% - Level erreicht haben. Mit einem geeigneten Trailing-Stopp lassen Sie sich mit der restlichen Position ausstoppen, riskieren Sie dafür aber nicht mehr als 50 % der angelaufenen Gewinne.
Mit der Vorwahl Quartal oder Jahr und den entsprechenden Eingaben kann auch das mindeste erwartbare Quartalshoch/ Quartalstief bzw. Jahreshoch/ Jahrestief ermittelt werden.
Die Fibonacci-Kurslevels lassen sich ein- und ausblenden. Klicken Sie im Chart auf das Zahnrad für „Chart Einstellungen“. Im Menü „Skalierungen“ kann mit der Vorwahl „Label für Indikatornahmen“ und „Label für letzten Indikatorwert“ die Kurslevels angezeigt werden. Schieben Sie den Chart nach rechts um mögliche Unterstützungen und Widerstände an den Kurslevels zu finden, die Bestätigung für das Ziel geben könnten.
Bei Eingabefehlern oder fehlenden Eingaben zu einem Zeitrahmen wird der Indikator ausgeblendet.
Achten Sie zur Vermeidung von Verlusten auf ihr Handelsmanagement.
Der neue Fibonacci-Trading-Indikator_3 besitz folgende Zusätze und Änderungen:
Vorwahl für den Zeitrahmen Quartal wurde hinzugefügt.
Der Einstiegsbereich erhielt eine 23,6% und eine 50% Unterteilung. Zwei Umschlagslinien über dem 23,6%-Einstiegslevel bei einem Aufwärtstrend, bzw. unter dem 23,6%-Einstiegslevel bei einem Abwärtstrend, mit der Breite 23,6% und 14,6% vom Einstiegsbereich, sollen bei höherem Schlusskurs signalisieren, dass die Notierungen aus dem Einstiegsbereich ausgebrochen sind.
Ein Volatilitätsstopp jeweils für Aufwärts- und Abwärtstrend kann zugeschaltet werden.
Für den Stopp wird die Schwankungsbreite jedes Kursbalkens wird mit einem Faktor beaufschlagt. Danach erfolgt die Berechnung eines gleitenden Durchschnitts mit einstellbarer Periode. Die Periodeneinstellung sollte zwischen 5 und 10 eingestellt werden. Das Ergebnis kann einstellbar geglättet werden.
Voreinstellung:
Perioden = 10
Faktor = 1,4
Glättung = 7
Mit der Annahme, dass der Markteinstieg in einem Aufwärtstrend bei Ausbruch der Notierungen über ein Kursbalkenhoch erfolgt, wird das Ergebnis der Stoppberechnung vom Kursbalkenhoch subtrahiert. Bei einem Abwärtstrend wird das Ergebnis der Stoppberechnung zum Kursbalkentief addiert.
Stellen Sie bei Markteintritt den Faktor auf 2,4. Folgen nach einer Trendbewegung Innenstäbe sollte der Stopp näher herangeführt werden. Probieren Sie die Faktoreinstellung 0,4 oder kleiner. Der kleinste einstellbare Faktor ist 0,1.
Für den Einstieg in einen etablierten Trend, wie in einem Ideenbeitrag von mir beschrieben, gibt es zwei zuschaltbare gleitende Durchschnitte. Die Anwendung für den (MA_H) erfolgt auf Hochs und für den (MA_L) einstellbar auf Hoch, Tief, Schuss, h+l/2 usw.. Periode und Offset (Verschiebung) sind einstellbar. Bei dieser Idee erfolgt der Einstieg in den Markt zwischen einer 618%-Korrektur (dem Fibonacci-Einstiegspunkt) und dem DEP (Durchschnittlicher Einstiegspunkt). Der DEP ist in diesem Fall der MA_H mit Periode = 4 und einem Offset = 1, bei einem Abwärtstrend, oder der MA_L mit identischer Einstellung und Anwendung auf Tiefs in einem Aufwärtstrend.
Testen Sie den MA_L auch in Trends mit den Einstellungen (Periode, Offset) 3,3 oder 5, 3 oder 7,5 und Anwendung auf Schlusskurse für eine enge Umfassung der Hochs/ Tiefs.

[blackcat] L2 Ehlers Center of GravityLevel: 2
Background
John F. Ehlers introuced center of gravity (CG) in his "Cybernetic Analysis for Stocks and Futures" chapter 5 on 2004.
Function
The center of gravity (CG) of a physical object is its balance point. For example, if you balance a 12-inch ruler on your finger, the CG will be at its 6-inch point. If you change the weight distribution of the ruler by putting a paper clip on one end, then the balance point (i.e., the CG) shifts toward
the paper clip. Moving from the physical world to the trading world, we can substitute the prices over our window of observation for the units of weight along the ruler. Using this analogy, we see that the CG of the window moves to the right when prices increase sharply. Correspondingly, the CG of the window moves to the left when prices decrease.
The idea of computing the center of gravity of Dr. Ehlers arose from observing how the lags of various finite impulse response (FIR) filters vary according to
the relative amplitude of the filter coefficients. A simple moving average (SMA) is an FIR filter where all the filter coefficients have the same value (usually unity). As a result, the CG of the SMA is exactly in the center of the filter. A weighted moving average (WMA) is an FIR filter where the most recent price is weighted by the length of the filter, the next most recent price is weighted by the length of the filter less 1, and so on. The weighting terms are the filter coefficients. The filter coefficients of a WMA describe the outline of a triangle. It is well known that the CG of a triangle is located at one-third the length of the base of the triangle. In other words, the CG of the WMA has shifted to the right relative to the CG of an SMA of equal length, resulting in less lag. In all FIR filters, the sum of the product of the coefficients and prices must be divided by the sum of the coefficients so that the scale of the original prices is retained.
Key Signal
CG ---> CG fast line
CG (2) ---> CG slow line
Pros and Cons
100% John F. Ehlers definition translation of original work, even variable names are the same. This help readers who would like to use pine to read his book. If you had read his works, then you will be quite familiar with my code style.
Remarks
The 26th script for Blackcat1402 John F. Ehlers Week publication.
Readme
In real life, I am a prolific inventor. I have successfully applied for more than 60 international and regional patents in the past 12 years. But in the past two years or so, I have tried to transfer my creativity to the development of trading strategies. Tradingview is the ideal platform for me. I am selecting and contributing some of the hundreds of scripts to publish in Tradingview community. Welcome everyone to interact with me to discuss these interesting pine scripts.
The scripts posted are categorized into 5 levels according to my efforts or manhours put into these works.
Level 1 : interesting script snippets or distinctive improvement from classic indicators or strategy. Level 1 scripts can usually appear in more complex indicators as a function module or element.
Level 2 : composite indicator/strategy. By selecting or combining several independent or dependent functions or sub indicators in proper way, the composite script exhibits a resonance phenomenon which can filter out noise or fake trading signal to enhance trading confidence level.
Level 3 : comprehensive indicator/strategy. They are simple trading systems based on my strategies. They are commonly containing several or all of entry signal, close signal, stop loss, take profit, re-entry, risk management, and position sizing techniques. Even some interesting fundamental and mass psychological aspects are incorporated.
Level 4 : script snippets or functions that do not disclose source code. Interesting element that can reveal market laws and work as raw material for indicators and strategies. If you find Level 1~2 scripts are helpful, Level 4 is a private version that took me far more efforts to develop.
Level 5 : indicator/strategy that do not disclose source code. private version of Level 3 script with my accumulated script processing skills or a large number of custom functions. I had a private function library built in past two years. Level 5 scripts use many of them to achieve private trading strategy.

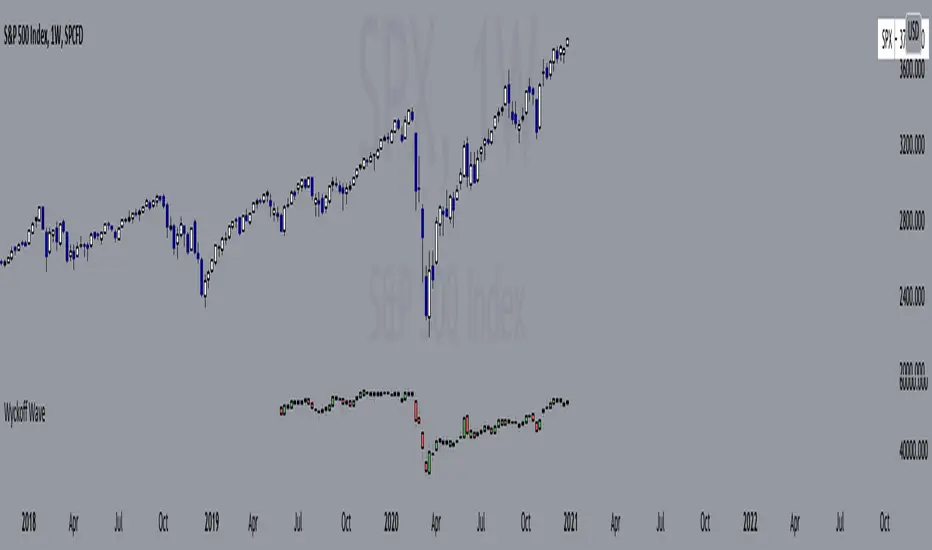
Wyckoff Wave"The Wyckoff Wave is a weighted index consisting of 12 stocks that are leaders in their perspective industries. It was introduced by the Stock Market Institute in 1931.
Made up of leaders in the important stock groups, the Wyckoff Wave represents the core of the American industrial complex.
The Wyckoff Wave has been a market indicator for Wyckoff students for over 50 years. While the stocks comprising the Wyckoff Wave have changed over time, it continues to be a sensitive leading market indicator. The Wyckoff Wave has consistently identified market trends.
The Wyckoff Wave is extremely helpful in predicting the stock market’s timing and the direction of the next market move.
The Wyckoff Wave is analyzed in five minute intervals and individual up and down iintra-day waves are created.
These individual waves, which include the price action and volume during those brief up and down market swings, also provide the data for other important Wyckoff Stock Market Institute indicators, including the Optimism-Pessimism volume index and the Trend Barometer.
These 12 stocks that make up the Wyckoff Wave. They are listed, along with their multipliers, below."
Wave Stock / Multiplier
AT&T / 79
Bank of America / 50
Boeing / 39
Bristol Myers / 119
Caterpillar / 35
DowDuPont / 72
Exxon Mobile / 32
IBM / 21
General Electric / 90
Ford / 25
Union Pacific / 60
WalMart / 43
In 2019, DowDuPont split into three companies: Dow, DuPont, and Corteva. Because TV limits the number of securities in a script to 40, only Dow and DuPont are factored into the Wave calculation (higher market caps than Corteva) with a multiplier of 36 each.
L1 Moving Average Fingerprint for Long EntryLevel: 1
Background
This script combines moving average processing with highest high and lowest low to disclose the "fingerprint" of a specific trading pair to describe its unique behavior.
Function
Moving Average Fingerprint for Long Entry is a Level 1 pine script. It utilize several moving average of inherent highest high and lowest low and combine them with customized fingerprint coefficients to depict the unique behavior of a specific trading pair across multiple markets for long entry point identification.
Key Signal
FingerPrint1~6 are basic-level fingerprints with moving average of highest high and lowest low.
FingerPrint7~8 are composite fingerprint definitions with coefficients/weights,where coefficients/weights need to be tuned to discover the inherent "fingerprint" of a specific trading pair.
FingerPrint10~12 are composite fingerprint calculation for long entry alerts
ReadytoLong is a long entry filter where long entry point may happen within it. By using crossover() function to a customized threshold value, you can define accurate long entries.
Pros and Cons
Pros:
1. Combine moving average and extreme points to disclose a trading pair behavior.
2. Smart to tune specific set of parameters to obtain unique fingerprints of trading pairs.
3. Smart position sizing scheme by adjusting the threshold values.
Cons:
1. Require tune input parameters for each trading pair in a specific period and time frame.
2. Only long entry was studied, no short entry and re-entry are available yet to form as a trading system.
3. "ReadytoLong" is an inaccurate range where multiple long entries may happen at improper points in chop market.
4. Complex input parameters to obtain a unique fingerprint set.
Remarks
Although I wrote pine script for more than two years, this is the first script published in the community. I will publish more with my works in this platform.
Hope the community can improve this concept and make it as a trading system.
Readme
In real life, I am a prolific inventor. I have successfully applied for more than 60 international and regional patents in the past 12 years. But in the past two years or so, I have tried to transfer my creativity to the development of trading strategies. Tradingview is the ideal platform for me. I am selecting and contributing some of the hundreds of scripts to publish in Tradingview community. Welcome everyone to interact with me to discuss these interesting pine scripts.
The scripts posted are categorized into 5 levels according to my efforts or manhours put into these works.
Level 1 : interesting script snippets or distinctive improvement from classic indicators or strategy. Level 1 scripts can usually appear in more complex indicators as a function module or element.
Level 2 : composite indicator/strategy. By selecting or combining several independent or dependent functions or sub indicators in proper way, the composite script exhibits a resonance phenomenon which can filter out noise or fake trading signal to enhance trading confidence level.
Level 3 : comprehensive indicator/strategy. They are simple trading systems based on my strategies. They are commonly containing several or all of entry signal, close signal, stop loss, take profit, re-entry, risk management, and position sizing techniques. Even some interesting fundamental and mass psychological aspects are incorporated.
Level 4 : script snippets or functions that do not disclose source code. Interesting element that can reveal market laws and work as raw material for indicators and strategies. If you find Level 1~2 scripts are helpful, Level 4 is a private version that took me far more efforts to develop.
Level 5 : indicator/strategy that do not disclose source code. private version of Level 3 script with my accumulated script processing skills or a large number of custom functions. I had a private function library built in past two years. Level 5 scripts use many of them to achieve private trading strategy.

PineScript v4 - Forex Pin-Bar Trading StrategyPineScript v4, forex trading robot based on the commonly used bullish / bearish pin-bar piercing the moving averages strategy.
I coded this robot to stress-test the PineScript v4 language to see how advanced it is, and whether I could port a forex trading strategy from MT4 to TradingView.
In my opinion, PineScript v4 is still not a professional coding language; for example you cannot use IF-statements to modify the contents of global variables; this makes complex robot behaviour difficult to implement. In addition, it is unclear if the programmer can use nested IF-ELSE, or nested FOR within IF.
The sequence of program execution is also unclear, and although complex order entry and exit appears to function properly, I am not completely comfortable with it.
Recommended Chart Settings:
Asset Class: Forex
Time Frame: H1
Long Entry Conditions:
a) Moving Average up trend, fast crosses above slow
b) Presence of a Bullish Pin Bar
c) Pin Bar pierces either Moving Average
d) Moving Averages must be sloping up, angle threshold (optional)
Short Entry Conditions:
a) Moving Average down trend, fast crosses below slow
b) Presence of a Bearish Pin Bar
c) Pin Bar pierces either Moving Average
d) Moving Averages must be sloping down, angle threshold (optional)
Exit Conditions:
a) Stoploss level is hit
b) Takeprofit level is hit
c) Moving Averages cross-back (optional)
Default Robot Settings:
Equity Risk (%): 3 //how much account balance to risk per trade
Stop Loss (x*ATR, Float): 2.1 //stoploss = x * ATR, you can change x
Risk : Reward (1 : x*SL, Float): 3.1 //takeprofit = x * stop_loss_distance, you can change x
Fast MA (Period): 20 //fast moving average period
Slow MA (Period): 50 //slow moving average period
ATR (Period): 14 //average true range period
Use MA Slope (Boolean): true //toggle the requirement of the moving average slope
Bull Slope Angle (Deg): 1 //angle above which, moving average is considered to be sloping up
Bear Slope Angle (Deg): -1 //angle below which, moving average is considered to be sloping down
Exit When MA Re-Cross (Boolean): true //toggle, close trade if moving average crosses back
Cancel Entry After X Bars (Period): 3 //cancel the order after x bars not triggered, you can change x
Backtest Results (2019 to 2020, H1, Default Settings):
EURJPY - 111% profit, 2.631 profit factor, 16.43% drawdown
EURUSD - 103% profit, 2.899 profit factor, 14.95% drawdown
EURAUD - 76.75% profit, 1.8 profit factor, 17.99% drawdown
NZDUSD - 64.62% profit, 1.727 profit factor, 19.14% drawdown
GBPUSD - 58.73% profit, 1.663 profit factor, 15.44% downdown
AUDJPY - 48.71% profit, 1.635 profit factor, 11.81% drawdown
USDCHF - 30.72% profit, 1.36 profit factor, 22.63% drawdown
AUDUSD - 8.54% profit, 1.092 profit factor, 19.86% drawdown
EURGBP - 0.03% profit, 1.0 profit factor, 29.66% drawdown
USDJPY - 1.96% loss, 0.972 profit factor, 28.37% drawdown
USDCAD - 6.36% loss, 0.891 profit factor, 21.14% drawdown
GBPJPY - 28.27% loss, 0.461 profit factor, 39.13% drawdown
To reduce the possibility of curve-fitting, this robot was backtested on 12 popular forex currencies, as shown above. The robot was profitable on 8 out of 12 currencies, breakeven on 1, and made a loss on 3.
The default robot settings could be over-fitting for the EUR, as we can see out-sized performance for the EUR pairs, with the exception of the EURGBP. We can see that GBPJPY made the largest loss, so these two pairs could be related.
Risk Warning:
This is a forex trading strategy that involves high risk of equity loss, and backtest performance will not equal future results. You agree to use this script at your own risk.

MACD-X, More Than MACD by DGTMoving Average Convergence Divergence – MACD
The most popular indicator used in technical analysis, the moving average convergence divergence (MACD), created by Gerald Appel. MACD is a trend-following momentum indicator, designed to reveal changes in the strength, direction, momentum, and duration of a trend in a financial instrument’s price
Historical evolution of MACD,
- Gerald Appel created the MACD line,
- Thomas Aspray added the histogram feature to MACD
- Giorgos E. Siligardos created a leader of MACD
MACD employs two Moving Averages of varying lengths (which are lagging indicators) to identify trend direction and duration. Then, MACD takes the difference in values between those two Moving Averages (MACD Line) and an EMA of those Moving Averages (Signal Line) and plots that difference between the two lines as a histogram which oscillates above and below a center Zero Line. The histogram is used as a good indication of a security's momentum.
Mathematically expressed as;
macd = ma(source, fast_length) – ma(source, slow_length)
signal = ma(macd, signal_length)
histogram = macd – signal
where exponential moving average (ema) is in common use as a moving average (ma)
fast_length = 12
slow_length = 26
signal_length = 9
The MACD indicator is typically good for identifying three types of basic signals ;
Signal Line Crossovers
A Signal Line Crossover is the most common signal produced by the MACD. On the occasions where the MACD Line crosses above or below the Signal Line, that can signify a potentially strong move. The standard interpretation of such an event is a recommendation to buy if the MACD line crosses up through the Signal Line (a "bullish" crossover), or to sell if it crosses down through the Signal Line (a "bearish" crossover). These events are taken as indications that the trend in the financial instrument is about to accelerate in the direction of the crossover.
Zero Line Crossovers
Zero Line Crossovers occur when the MACD Line crossed the Zero Line and either becomes positive (above 0) or negative (below 0). A change from positive to negative MACD is interpreted as "bearish", and from negative to positive as "bullish". Zero crossovers provide evidence of a change in the direction of a trend but less confirmation of its momentum than a signal line crossover
Divergence
Divergence is another signal created by the MACD. Simply, divergence occurs when the MACD and actual price are not in agreement. A "positive divergence" or "bullish divergence" occurs when the price makes a new low but the MACD does not confirm with a new low of its own. A "negative divergence" or "bearish divergence" occurs when the price makes a new high but the MACD does not confirm with a new high of its own. A divergence with respect to price may occur on the MACD line and/or the MACD Histogram
Moving Average Crossovers , another hidden signal that MACD Indicator identifies
Many traders will watch for a short-term moving average to cross above a longer-term moving average and use this to signal increasing upward momentum. This bullish crossover suggests that the price has recently been rising at a faster rate than it has in the past, so it is a common technical buy sign. Conversely, a short-term moving average crossing below a longer-term average is used to illustrate that the asset's price has been moving downward at a faster rate and that it may be a good time to sell.
Moving Average Crossovers in reality is Zero Line Crossovers, the value of the MACD indicator is equal to zero each time the two moving averages cross over each other. For easy interpretation by trades, Zero Line Crossovers are simply described as positive or negative MACD
False signals
Like any forecasting algorithm, the MACD can generate false signals. A false positive, for example, would be a bullish crossover followed by a sudden decline in a financial instrument. A false negative would be a situation where there is bearish crossover, yet the financial instrument accelerated suddenly upwards
What is “MACD-X” and Why it is “More Than MACD”
In its simples form, MACD-X implements variety of different calculation techniques applied to obtain MACD Line, ability to use of variety of different sources , including Volume related sources, and can be plotted along with MACD in the same window and all those features are available and presented within a single indicator, MACD-X
Different calculation techniques lead to different values for MACD Line, as will further discuss below, and as a consequence the signal line and the histogram values will differentiate accordingly. Mathematical calculation of both signal line and the histogram remain the same.
Main features of MACD-X ;
1- Introduces different proven techniques applied on MACD calculation , such as MACD-Histogram, MACD-Leader and MACD-Source, besides the traditional MACD (MACD-TRADITIONAL)
• MACD-Traditional , by Gerald Appel
It is the MACD that we know, stated as traditional just to avoid confusion with other techniques used with this study
• MACD-Histogram , by Thomas Aspray
The MACD-Histogram measures the distance between MACD and its signal line (the 9-day EMA of MACD). Aspray developed the MACD-Histogram to anticipate signal line crossovers in MACD. Because MACD uses moving averages and moving averages lag price, signal line crossovers can come late and affect the reward-to-risk ratio of a trade. Bullish or bearish divergences in the MACD-Histogram can alert chartists to an imminent signal line crossover in MACD
The MACD-Histogram represents the difference between MACD and its 9-day EMA, the signal line. Mathematically,
macdx = macd - ma(macd, signal_length)
Aspray's contribution served as a way to anticipate (and therefore cut down on lag) possible MACD crossovers which are a fundamental part of the indicator.
Here come a question, what if repeat the same calculations once more (macdh2 = macdh - ma(macdh, signal_length), will it be even better, this question will remain to be tested
• MACD-Leader , by Giorgos E. Siligardos, PhD
MACD Leader has the ability to lead MACD at critical situations. Almost all smoothing methods encounter in technical analysis are based on a relative-weighted sum of past prices, and the Leader is no exception. The concealed weights of MACD Leader are such that more relative weight is used in the more recent prices than the respective weights used by the components of MACD. In effect, the Leader expresses more changes in average price dynamics for the recent price movement than MACD, thus eventually leading MACD, especially when significant trend changes are about to take place.
Siligardos creates two less-laggard moving averages indicators in its formula using the same periods as follows
Indicator1 = ma(source, fast_length) + ma(source - ma(source, fast_length), fast_length)
Indicator2 = ma(source, slow_length) + ma(source - ma(source, slow_length), slow_length)
and then take the difference:
Indicator1 - Indicator2
The result is a new MACD Leader indicator
macdx = macd + ma(source - fast_ma, fast_length) - ma(source - slow_ma, slow_length)
• MACD-Source , a custom experimental interpretation of mine ,
MACD Source, presents an application of MACD that evaluates Source/MA Ratio, relatively with less lag, as a basis for MACD Line, also can be expressed as source convergence/divergence to its moving average. Among the various techniques for removing the lag between price and moving average (MA) of the price, one in particular stands out: the addition to the moving average of a portion of the difference between the price and MA. MACD Source, is based on signal length mean of the difference between Source and average value of shot length and long length moving average of the source (Source/MA Ratio), where the source is actual value and hence no lag and relatively less lag with the average value of moving average of the source . Mathematically expressed as,
macdx = ma(source - avg( ma(source, fast_length), ma(source, slow_length) ), signal_length)
MACD Source provides relatively early crossovers comparing to MACD and better momentum direction indications, assuming the lengths are set to same values
For further details, you are invited to check the following two studies, where the first seeds were sown of the MACD-Source idea
Price Distance to its Moving Averages study, adapts the idea of “Prices high above the moving average (MA) or low below it are likely to be remedied in the future by a reverse price movement", presented in an article by Denis Alajbeg, Zoran Bubas and Dina Vasic published in International Journal of Economics, Commerce and Management
First MACD like interpretation comes with the second study named as “ P-MACD ”, where P stands for price, P-MACD study attempts to display relationship between Price and its 20 and 200-period moving average. Calculations with P-MACD were based on price distance (convergence/divergence) to its 200-period moving average, and moving average convergence/divergence of 20-period moving average to 200-period moving average of price.
Now as explained above, MACD Source is a one adapted with traditional MACD, where Source stands for Price, Volume Indicator etc, any source applicable with MACD concept
2- Allows usage of variety of different sources, including Volume related indicators
The most common usage of Source for MACD calculation is close value of the financial instruments price. As an experimental approach, this study will allow source to be selected as one of the following series;
• Current Close Price (close)
• Average of High, Low, and Close Price (hlc3)
• On Balance Volume (obv)
• Accumulation Distribution (accdist)
• Price Volume Trend (pvt)
Where,
-Current Close Price and Average of High, Low, and Close Price are price actions of the financial instrument
- Accumulation Distribution is a volume based indicator designed to measure underlying supply and demand
- On Balance Volume (OBV) , is a momentum indicator that measures positive and negative volume flow
- Price Volume Trend (PVT) is a momentum based indicator used to measure money flow
3- Can be plotted along with MACD in the same window using the same scaling
Default setting of MACD-X will display MACD-Source with Current Close Price as a source and traditional MACD can be plotted eighter as a companion of MACD-X or can be selected to be plotted alone.
Applying both will add ability to compare, or use as a confirmation of one other
In case, traditional MACD Is plotted along with MACD-X to avoid misinterpreting, the lines plotted, the area between MACD-X Line and Signal-X Line is highlighted automatically, even if the highlight option not selected. Otherwise highlight will be applied only if that option selected
4- 4C Histogram
Histogram is plotted with four colors to emphasize the momentum and direction
5- Customizable
Additional to ability of selecting Calculation Method, Source, plotting along with MACD, there are few other option that allows users to customize the MACD-X indicator
Lengths are configurable, default values are set as 12, 26, 9 respectively for fast, slow and smoothing length. Setting lengths to 8,21,5 respectively Is worth checking, slower length moving averages will lead to less lag and earlier reaction to price actions but yet requires a caution and back testing before applying
Highlight the area between MACD-X Line and Signal-X Line, with colors emphasising the direction
Label can be added to display Calculation Method, Source and Length settings, the aim of this label is to server only as a reminder to trades to be aware of settings while they are occupied with charts, analysis etc.
Here comes another question, which is of more importance having the reminder or having the indicators with multi timeframe feature? Build-in Multi Time Frame features of Pine is not supported when labels and lines introduced in the script, there are other methods but brings complexity. To be studied further, this version will be with labels for time being.
Epilogue
MACD-X is an alternative variant of MACD, the insight/signals provided by MACD are also applicable to MACD-X with early and clear warnings for the changes in the trend.
If MACD is essential to your analysis, then it is my guess that after using the MACD-X for a while and familiarizing yourself with its unique character and personality, you will make it an inseparable companion to other indicators in your charts.
The various signals generated by MACD/MACD-X are easily interpreted and very few indicators in technical analysis have proved to be more reliable than the MACD, and this relatively simple indicator can quickly be incorporated into any short-term trading strategy
Disclaimer : Trading success is all about following your trading strategy and the indicators should fit within your trading strategy, and not to be traded upon solely
The script is for informational and educational purposes only. Use of the script does not constitutes professional and/or financial advice. You alone the sole responsibility of evaluating the script output and risks associated with the use of the script. In exchange for using the script, you agree not to hold dgtrd TradingView user liable for any possible claim for damages arising from any decision you make based on use of the script

KingEMA21-55ZoneI used the moving average with the habit of 21-55, so added two moving average
When the price runs above 55, it only looks for the buy signal.
When the price runs below 55, it only looks for sell signals.
The first step up through the 55 moving average after the first confirmation can buy homeoply,
The first pull down after crossing the 55 moving average for the first time confirms that it can be sold in line with the trend.
Price horizontal finishing, moving average frequently across the field observation.
The yellow area in the interval from 81to 55 is the homeopathic warehouse addition signal.
When the price is above the 55 moving average, the k-line closes below the 21-day moving average as a callback signal
Prices below the 55 ema close above the 21 - day ema as a rebound signal
After the correction and rebound signals come out, we should make half of the profit and the other half of the stop loss in the break-even place.
Moving average is very suitable for the trend of strong varieties, is not suitable for volatile market.
Only at the end of the shock market moving average upward or downward divergent when it is possible to be used.
1. Repeatedly entangle the mean line of horizontal disk stage and observe it from the field
2. Sell the three EMA moving averages when they can't exceed 89EMA with downward crossing
3, many times can not break the new low when prices go sideways profit
4. Buy when the price reaches 89EMA after the convergence of triangle 3 is broken
5, the Angle of price rise slowed and closed below the 21 moving average when profit
6. Left field observation during transverse oscillation.
Sit tight while news or data cause prices to fall quickly
8. Buy when the price triangle breaks through the 55 moving average upward
9, the price does not rise to slow down when the horizontal closed below the 21 moving average when profit
10, price horizontal shock finishing at the same time the average line also transverse finishing field observation
11, the price of the triangle after finishing through the 89 moving average to buy.At this point all the averages have turned up
12, the second time can not break through the new high when the negative line can profit
13, the price of the first time in the same period of time through 89 after the first step back can be re-bought.
中文翻译
价格在55上面运行时时只找买入信号、
价格在55下面运行时只寻找卖出信号、
第一次向上穿过55均线后的第一次回踩确认可以顺势买入、
第一次向下穿过55均线后的第一次回抽确认可以顺势卖出、
价格横盘整理,均线频繁穿越时离场观察。
21-55区间里面黄色区域为顺势加仓信号,
价格在55均线上面时K线收盘在21天均线下面时为回调信号
价格在55均线下面时K线收盘在21天均线上面时为反弹信号
在回调和反弹信号出来之后我们应该获利一半的头寸,另外一半止损放到盈亏平衡的地方。
均线非常适合趋势性很强的品种,并不适合震荡行情。
只有在震荡行情结束时均线向上或向下发散时才有被运用的可能。
1、横盘阶段均线反复纠缠,离场观察
2、三条EMA均线向下交叉回抽无法超越55EMA时卖出
3、多次不能破新低时价格走横时获利
4、价格在3处三角形收敛被突破后站上了55EMA时买入
5、价格上涨角度变缓并收盘在21均线下面时获利
6、横盘震荡时离场观察。
7、见死不救新闻或数据导致价格快速下跌时观望
8、价格三角形向上突破时穿过55均线时买入
9、价格不升减速走横时收盘于21均线下面时获利
10、价格横盘震荡整理同时均线也横向整理时离场观察
11、价格突破三角形整理后重新穿过89均线时买入。此时所有均线已经向上翘头
12、第二次不能突破新高时收阴线可以获利
13、价格在同一个时间周期内第一次穿过89以后的第一次回踩可以重新买入
14、21-55作为牛熊的分水岭。在21-55区域之下只考虑做空,21-55之上只考虑做多。如果21-55走横则以位置决定高位倾向空低位倾向多。
15、K线会因为指标的设置自动变成两个颜色块,绿色看涨,红色看跌。做趋势看K线颜色。牛市的红色可以当成入场K熊市绿色当成入场K

KingEMA21-55-89-144I used the moving average with the habit of 21-55, so added two moving average, one is the short line 8EMA, the other is the medium and long line 89ema
Explain the application of moving averages through the disk surface:
When the price runs above 89, it only looks for the buy signal.
When the price runs below 89, it only looks for sell signals.
The first step up through the 89 moving average after the first confirmation can buy homeoply,
The first pull down after crossing the 89 moving average for the first time confirms that it can be sold in line with the trend.
Price horizontal finishing, moving average frequently across the field observation.
The yellow area in the interval from 8 to 21 is the homeopathic warehouse addition signal.
When the price is above the 89 moving average, the k-line closes below the 21-day moving average as a callback signal
Prices below the 89 ema close above the 21 - day ema as a rebound signal
After the correction and rebound signals come out, we should make half of the profit and the other half of the stop loss in the break-even place.
Moving average is very suitable for the trend of strong varieties, is not suitable for volatile market.
Only at the end of the shock market moving average upward or downward divergent when it is possible to be used.
1. Repeatedly entangle the mean line of horizontal disk stage and observe it from the field
2. Sell the three EMA moving averages when they can't exceed 89EMA with downward crossing
3, many times can not break the new low when prices go sideways profit
4. Buy when the price reaches 89EMA after the convergence of triangle 3 is broken
5, the Angle of price rise slowed and closed below the 21 moving average when profit
6. Left field observation during transverse oscillation.
Sit tight while news or data cause prices to fall quickly
8. Buy when the price triangle breaks through the 89 moving average upward
9, the price does not rise to slow down when the horizontal closed below the 21 moving average when profit
10, price horizontal shock finishing at the same time the average line also transverse finishing field observation
11, the price of the triangle after finishing through the 89 moving average to buy.At this point all the averages have turned up
12, the second time can not break through the new high when the negative line can profit
13, the price of the first time in the same period of time through 89 after the first step back can be re-bought.
中文翻译
价格在89上面运行时时只找买入信号、
价格在89下面运行时只寻找卖出信号、
第一次向上穿过89均线后的第一次回踩确认可以顺势买入、
第一次向下穿过89均线后的第一次回抽确认可以顺势卖出、
价格横盘整理,均线频繁穿越时离场观察。
8-21区间里面黄色区域为顺势加仓信号,
价格在89均线上面时K线收盘在21天均线下面时为回调信号
价格在89均线下面时K线收盘在21天均线上面时为反弹信号
在回调和反弹信号出来之后我们应该获利一半的头寸,另外一半止损放到盈亏平衡的地方。
均线非常适合趋势性很强的品种,并不适合震荡行情。
只有在震荡行情结束时均线向上或向下发散时才有被运用的可能。
1、横盘阶段均线反复纠缠,离场观察
2、三条EMA均线向下交叉回抽无法超越89EMA时卖出
3、多次不能破新低时价格走横时获利
4、价格在3处三角形收敛被突破后站上了89EMA时买入
5、价格上涨角度变缓并收盘在21均线下面时获利
6、横盘震荡时离场观察。
7、见死不救新闻或数据导致价格快速下跌时观望
8、价格三角形向上突破时穿过89均线时买入
9、价格不升减速走横时收盘于21均线下面时获利
10、价格横盘震荡整理同时均线也横向整理时离场观察
11、价格突破三角形整理后重新穿过89均线时买入。此时所有均线已经向上翘头
12、第二次不能突破新高时收阴线可以获利
13、价格在同一个时间周期内第一次穿过89以后的第一次回踩可以重新买入
14、21-55作为牛熊的分水岭。在21-55区域之下只考虑做空,21-55之上只考虑做多。如果21-55走横则以位置决定高位倾向空低位倾向多。
15、K线会因为指标的设置自动变成两个颜色块,绿色看涨,红色看跌。做趋势看K线颜色。牛市的红色可以当成入场K熊市绿色当成入场K

KingEMA8-21-55-89I used the moving average with the habit of 21-55, so added two moving average, one is the short line 8EMA, the other is the medium and long line 89ema
Explain the application of moving averages through the disk surface:
When the price runs above 89, it only looks for the buy signal.
When the price runs below 89, it only looks for sell signals.
The first step up through the 89 moving average after the first confirmation can buy homeoply,
The first pull down after crossing the 89 moving average for the first time confirms that it can be sold in line with the trend.
Price horizontal finishing, moving average frequently across the field observation.
The yellow area in the interval from 8 to 21 is the homeopathic warehouse addition signal.
When the price is above the 89 moving average, the k-line closes below the 21-day moving average as a callback signal
Prices below the 89 ema close above the 21 - day ema as a rebound signal
After the correction and rebound signals come out, we should make half of the profit and the other half of the stop loss in the break-even place.
Moving average is very suitable for the trend of strong varieties, is not suitable for volatile market.
Only at the end of the shock market moving average upward or downward divergent when it is possible to be used.
1. Repeatedly entangle the mean line of horizontal disk stage and observe it from the field
2. Sell the three EMA moving averages when they can't exceed 89EMA with downward crossing
3, many times can not break the new low when prices go sideways profit
4. Buy when the price reaches 89EMA after the convergence of triangle 3 is broken
5, the Angle of price rise slowed and closed below the 21 moving average when profit
6. Left field observation during transverse oscillation.
Sit tight while news or data cause prices to fall quickly
8. Buy when the price triangle breaks through the 89 moving average upward
9, the price does not rise to slow down when the horizontal closed below the 21 moving average when profit
10, price horizontal shock finishing at the same time the average line also transverse finishing field observation
11, the price of the triangle after finishing through the 89 moving average to buy.At this point all the averages have turned up
12, the second time can not break through the new high when the negative line can profit
13, the price of the first time in the same period of time through 89 after the first step back can be re-bought.
中文翻译
价格在89上面运行时时只找买入信号、
价格在89下面运行时只寻找卖出信号、
第一次向上穿过89均线后的第一次回踩确认可以顺势买入、
第一次向下穿过89均线后的第一次回抽确认可以顺势卖出、
价格横盘整理,均线频繁穿越时离场观察。
8-21区间里面黄色区域为顺势加仓信号,
价格在89均线上面时K线收盘在21天均线下面时为回调信号
价格在89均线下面时K线收盘在21天均线上面时为反弹信号
在回调和反弹信号出来之后我们应该获利一半的头寸,另外一半止损放到盈亏平衡的地方。
均线非常适合趋势性很强的品种,并不适合震荡行情。
只有在震荡行情结束时均线向上或向下发散时才有被运用的可能。
1、横盘阶段均线反复纠缠,离场观察
2、三条EMA均线向下交叉回抽无法超越89EMA时卖出
3、多次不能破新低时价格走横时获利
4、价格在3处三角形收敛被突破后站上了89EMA时买入
5、价格上涨角度变缓并收盘在21均线下面时获利
6、横盘震荡时离场观察。
7、见死不救新闻或数据导致价格快速下跌时观望
8、价格三角形向上突破时穿过89均线时买入
9、价格不升减速走横时收盘于21均线下面时获利
10、价格横盘震荡整理同时均线也横向整理时离场观察
11、价格突破三角形整理后重新穿过89均线时买入。此时所有均线已经向上翘头
12、第二次不能突破新高时收阴线可以获利
13、价格在同一个时间周期内第一次穿过89以后的第一次回踩可以重新买入
14、21-55作为牛熊的分水岭。在21-55区域之下只考虑做空,21-55之上只考虑做多。如果21-55走横则以位置决定高位倾向空低位倾向多。
15、K线会因为指标的设置自动变成两个颜色块,绿色看涨,红色看跌。做趋势看K线颜色。牛市的红色可以当成入场K熊市绿色当成入场K

Channel Break [for free bot]I present to you a script for testing the channel breakout strategy for the Bitmex exchange.
Cryptocurrency itself is a trending tool, which is why breakout strategies generate the largest profits, and the channel breakout strategy is one of the most effective trend strategies.
The optimization result shows the result of trading on a volume of 20% of the deposit. But since Bitmex trades in futures contracts, you can use 50%, 100% and even much more, depending on your attitude to risk.
At the time of publication on the Bitmex exchange there are 12 different contracts, i.e. You can diversify your trading well (by pre-optimizing the settings for each contract).
In the script, you can set up many trading options - timeframe, periods for buying and selling, method of exiting a trade, stop loss, take profit, risk management, etc.
Thus, you create a strategy "for yourself".
Представляю Вам скрипт для тестирования стратегии пробоя канала для биржи Битмекс.
Криптовалюта, сама по себе является трендовым инструментом, именно поэтому, пробойные стратегии генерируют самую большую прибыль, а стратегия пробоя канала – является одной из самых эффективных трендовых стратегий.
На результате оптимизации показан результат торговли на объеме в 20% от депозита. Но так как на Битмекс торговля идет фьючерсными контрактами, Вы можете использовать 50%, 100% и даже намного больше, в зависимости от Вашего отношения к риску.
На момент публикации на бирже Битмекс есть 12 разных контрактов, т.е. Вы можете хороши диверсифицировать свою торговлю (предварительно оптимизируя настройки по каждый контракт).
В скрипте Вы можете настроить множество вариантов торговли - таймфрейм, периоды для покупки и продажи, метод выхода из сделки, стоп-лосс, тейк-профит, рискменеджмент и т.п.
Таким образом Вы создаете стратегию "под себя".

mForex - Keltner channel + EMA Scalping systemTransaction setup parameters
Time frame: M5, M15
Currency pair: EUR / USD , GPB / USD
Transaction: London, USA
Number of orders / day: 10 - 15 orders
Trading strategies
=== BUY ===
Candles close on the upper Keltner
EMA10 crosses the upper Keltner range from below
Stop loss in the middle band or up to 12 pips
Profit target: 15-25 pips
=== SELL ===
Candles close below Keltner below
EMA10 crosses the Keltner range below from above
Stop loss in the middle band or up to 12 pips
Profit target: 15-25 pips

13612WThis script is a 13612W momentum filter used in the Vigilant Asset Allocation (VAA) and Defensive Asset Allocation (DAA) created by Wouter J. Keller and Jan Willem Keuning.
This asset allocation strategy was uploaded to SSRN in 2017 and 2018.
13612W Calculation Method
(Profitability in Last 1 months * 12 +
Profitability in Last 3 months * 4 +
Profitability in Last 6 months * 2 +
Profitability in Last 12 months)/4
Let me briefly explain one of the VAAs, VAA-G4.
The VAA-G4 has an annualized return of 17.7%, a Sharpe ratio of 1.07% and Max Drawdown of 16.1%.
(It's too long and complicated to describe all VAA, DAA strategies. Above all, the translator performance is not good.)
VAA Global 4 Universe: SPY, EFA, EEM, AGG
Cash Universe: SHY , IEF, LQD
If 13612W of VAA Global 4 Universe is negative at least one
>> 100% of assets hold one of the highest 13612W of Cash Universe
If all 13612W of VAA Global 4 Universe are positive
>> 100% of assets hold one of the highest 13612W of VAA Global 4 Universe
Rebalancing is done every month according to this method.

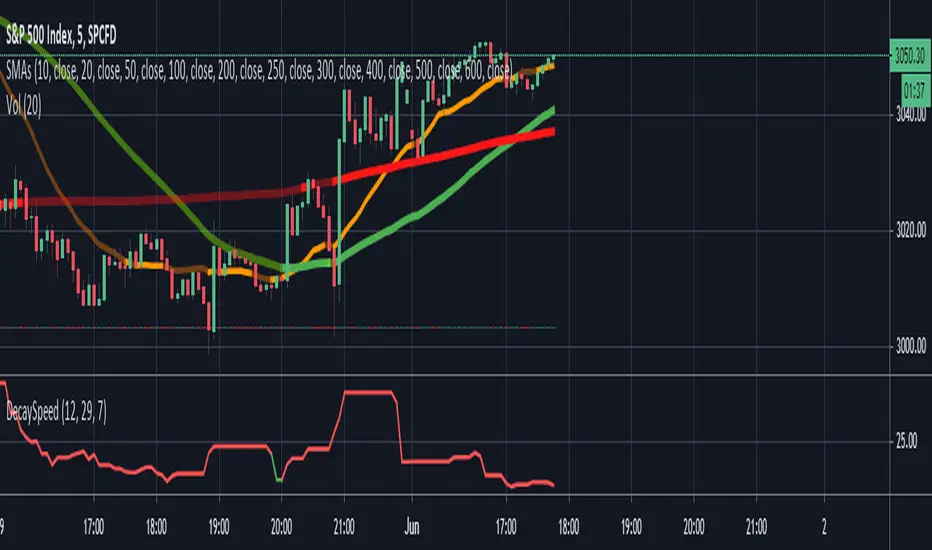
Options Decay Speed for 0DTEUse only for:
SPX, 5 minutes time frame
This indicator is complementing options 0DTE strategy - selling options for SPX index in the same day as they are expiring. Output of the indicator (red or green color of the curve) indicates whether is profitable to sell options at given moment at delta and VIX specified in the parameters. Changing parameter "Candles" is not recommended.
Main thought is that options expire with certain speed (theta decay) when stock doesnt move. When stock moves in unfavorable direction slowly enough, decay speed can compensate for disadvantage coming from option delta. Intuitively there must be certain speed of stock value change (expressed in stock value per 5 minutes) that is exactly compensating theta decay. This indicator calculates those two values (details below) and shows, where theta decay is faster than stock movement in the last hour and thus favorable to sell options.
Indicator gets its result from comparing two values:
1) volatility in the form of highest high and lowest low for past 12 candles (one hour in total) divided by 12 - meaning average movement of stock expressed in
2) speed of options value decay in form of combination of theta decay and option delta. Formulas are approximation of Black-Scholes model as Pine script doesnt allow for advanced functions. Approximations are accurate to 2 decimal points from market open to one hour before market close and will not indicate green when accuracy is not sufficient. Its value is also expressed in so its mutualy comparable.
My focus was not on code elegance but on practical usability.
Written by Ondřej Škop.
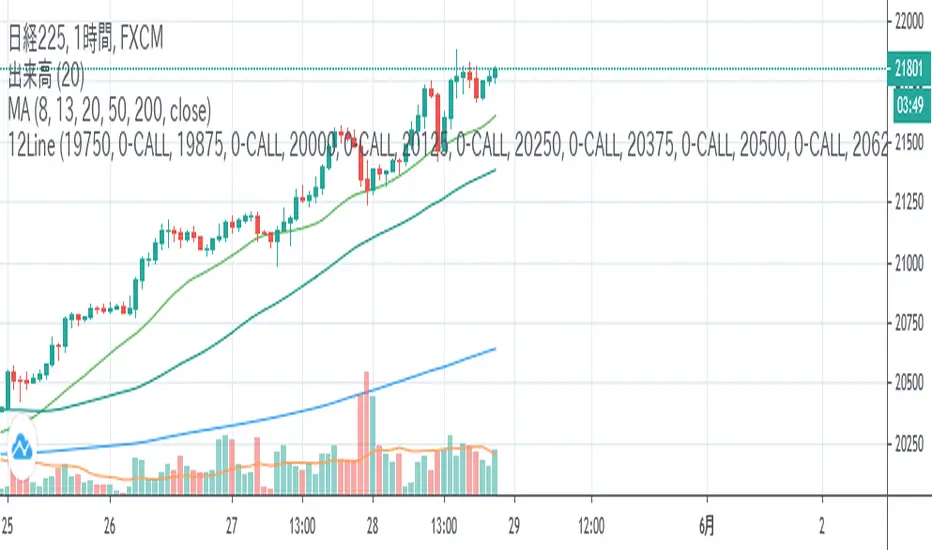
12LineA horizontal line is displayed during Nikkei 225 futures trading to help you draw a line quickly.
If you check the check box, you can display up to 12 lines of 6 types at the entered price.
日経平均先物取引時に水平ラインを表示し、素早いライン描画を助けます。
表示したい価格を入力し、チェックボックスをONにすると6種類の線を最大12本表示できます。
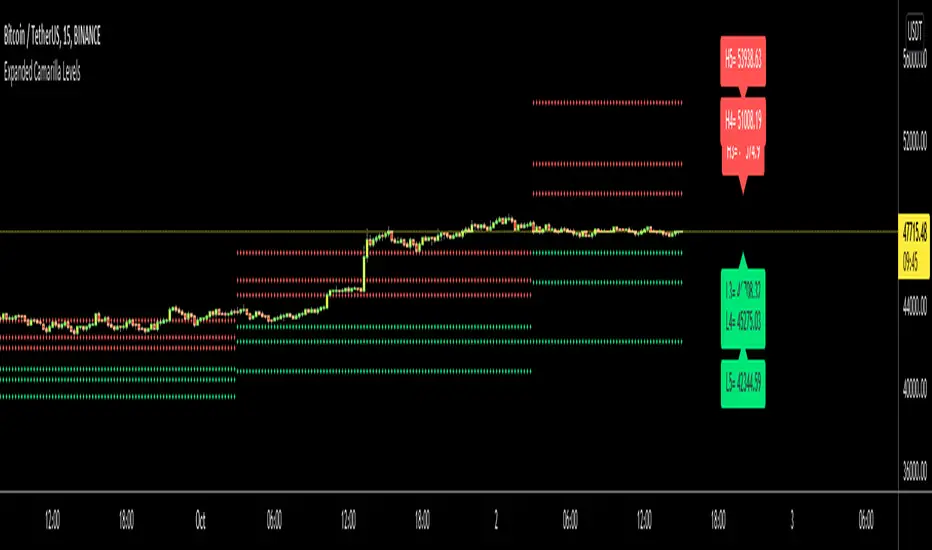
Expanded Camarilla LevelsHello Everyone,
The Expanded Camarilla Level s is introduced in the book " Secrets of a Pivot Boss: Revealing Proven Methods for Profiting in the Market " by Franklin Ocho a. I will not write a lot about the book, you should read it for yourself. There are many great ideas in the book, such using these levels, following trend, time price opportunity, Advanced Camarilla Concepts and much more.
The definition/formula of the levels defined in the book. ( actualy L1, L2, H1 and H2 levels are not used in the strategy, so not shown on the chart )
RANGE = highhtf - lowhtf
H5 = (HIGH/ LOW) * CLOSE
H4 = CLOSE + RANGE * 1.1/2
H3 = CLOSE+ RANGE * 1.1/4
H2 = CLOSE+ RANGE * 1.1/6
H1 = CLOSE+ RANGE * 1.1/12
L1 = CLOSE- RANGE * 1.1/12
L2 = CLOSE- RANGE * 1.1/6
L3 = CLOSE- RANGE * 1.1/4
L4 = CLOSE- RANGE * 1.1/2
L5 = CLOSE- (H5 - CLOSE)
Levels:
Strategy: you need to take care of the candles, as you can see there is bearish candle on first part, and Bullish Candle on second part!
Another Strategy:
An Example:
ENJOY!
.BXBT IndexThe current .BXBT index weighted as close as possible to BitMEX's with updates as BitMEX refreshes their index.
Difference between this and the script titled '2020 March 27 .BXBT Index': this one will receive updates because it doesn't have a date in its title.
Methodology
www.bitmex.com
"BitMEX Index Weights, assuming no constituent exchanges have been excluded due to Index Protection Rules, last updated 27 December 2019 at 12:00:05 UTC."
Binance: -
Bitstamp: 10.61%
Bittrex: 2.53%
Coinbase: 52.30%
Gemini: 6.89%
Huobi: -
Itbit: 4.21%
Kraken: 23.46%
Poloniex: -
ItBit's weight is combined with Gemini's due to ItBit not being on TradingView as of now. BITTREX:BTCUSD substituted with BITTREX:BTCUSDT*POLONIEX:USDTUSD to backfill because Bittrex only recently (late 2018) started to offer a fiat BTC/USD pair. Not that it matters since the index used in 2018 didn't include Bittrex if I remember correctly.
What is actually used for 27/12/2019 to 27/03/2020:
Binance: -
Bitstamp: 10.61%
Bittrex: 2.53%
Coinbase: 52.30%
Gemini: 11.10%
Huobi: -
Itbit: -
Kraken: 23.46%
Poloniex: -
Options:
Toggle candlesticks or close line
Change price source to be used for indicators
To be added: Change quarter to show indexes for different times, with labels that apply to the appropriate index used
Reasons to use this vs. the index itself: (not many)
It is helpful as a reference for other indicators or creation of an index.

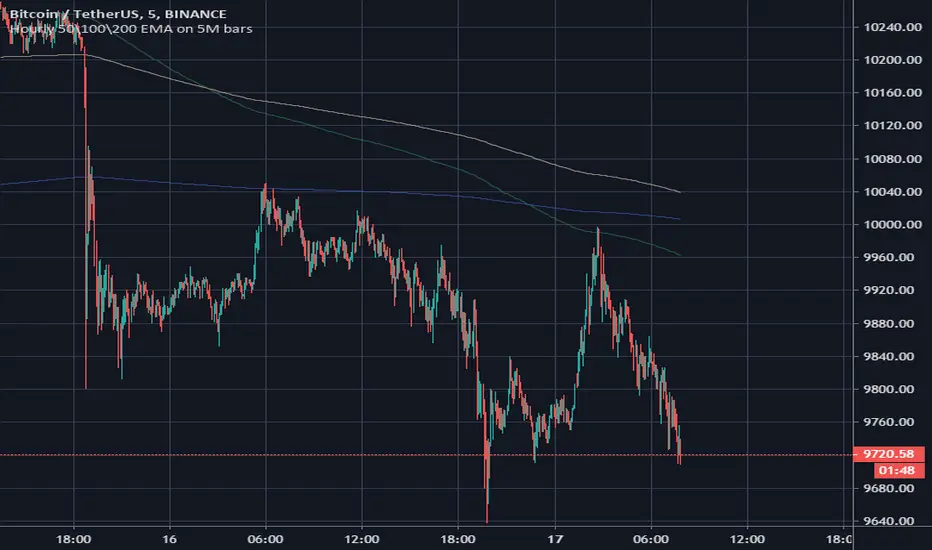
Hourly 50\100\200 EMA on 5M barsHello. This script was created for traders using a 5 minute timeframe. The script allows you to plot EMA from a higher level timeframe. Its formula includes the multiplication of the classical values of 50/100/200 EMA by 12, because in one hour it is 12 times for 5 minutes. You must use script only at 5M timeframe, because his interval is unique and not compare with other timeframes.
Often, an hourly EMA on a 5-minute timeframe becomes a strong level of support or price resistance. You can use this script on 5M timeframe with "daily 50/100/200 EMA" script on 1H timeframe for best scalping results.
Good luck in trading!
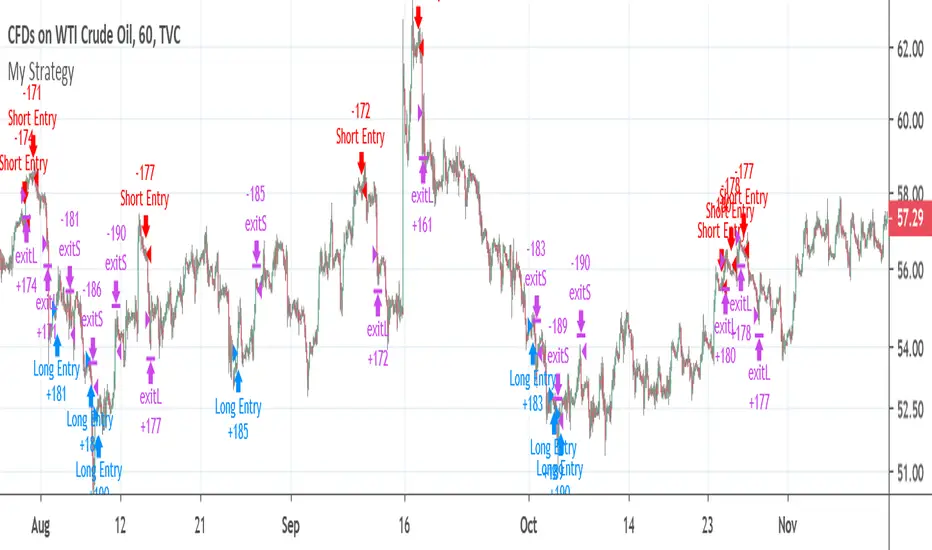
CCI strategy on OIL1HThis indicator is based on Commodity Channel Index.
It buys when CCI on period 200 is under -130 and it´s rising last 12 bars. It closes the position by hitting Take Profit, Stop Loss or opening short position.
It sells when CCI on period 200 is over 130 and it´s falling last 12 bars. It closes the position by hitting Take Profit, Stop Loss or opening short position.
This strategy seems to working just on USOIL on 1 hour chart. This can predict that it´s just luck and not proper strategy or indicator I would use for trading.
This script is just for educational purposes and that´s why the script is open. I will be happy if you will leave comment and try to come up with some ideas how to improve this strategy, so it can be used also on other commodities/forex pairs.
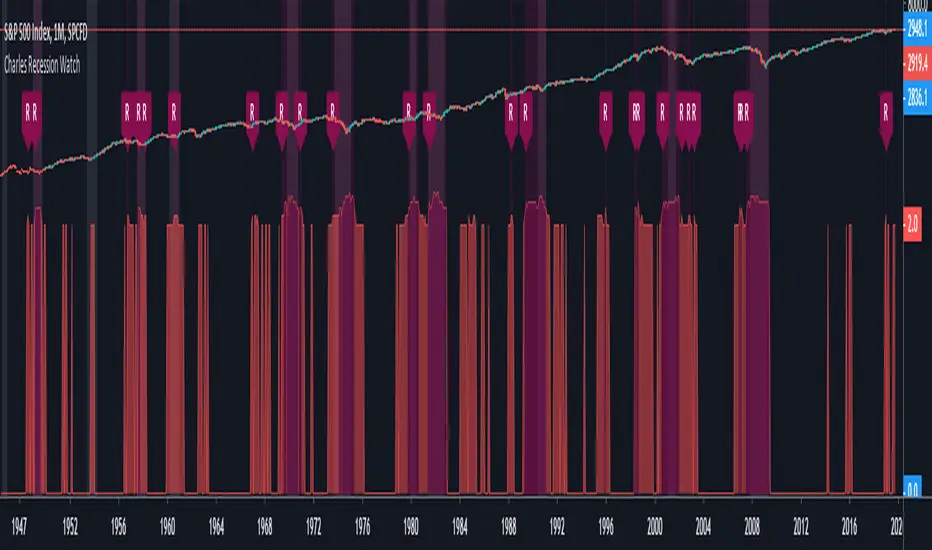
Charles Recession WatchThe “Recession Watch” indicator tracks 7 key economic metrics which have historically preceded US recessions. It provides a real-time indication of incoming recession risk.
This indicator gives a picture of when risk is increasing, and therefore when you might want to start taking some money out of risky assets.
All of the last seven recessions were preceded by a risk score of 3 or higher. Six of them were preceded by a risk score of 4 or higher. Unfortunately data prior to 1965 was inconsistent and prior recessions could not be considered.
Based on the indicator hit rate at successfully flagging recessions over the last 50 years, risk scores have the following approximate probabilities of recession:
- 0-1: Low
- 2: 25% within next 18 months
- 3: 30% within next 12 months
- 4-7: 50% within next 12 months
Note that a score of 3 is not necessarily a cause for panic. After all, there are substantial rewards to be had in the lead up to recessions (averaging 19% following yield curve inversion). For the brave, staying invested until the score jumps to 4+, or until the S&P500 drops below the 200day MA, will likely yield the best returns.
Notes on use:
- use MONTHLY time period only (the economic metrics are reported monthly)
- If you want to view the risk Score (1-7) you need to set your chart axis to "Logarithmic"
Enjoy and good luck!
ATR - Baby WhaleScript that shows you the ATR and 0.5 ATR.
You can use this to define your stop loss level when you see a SFP.
Standard setting is the 24 period ATR. You can use this for a 1h chart (24 hours in a day).
So when you play on a 5m chart, you can change the setting to 12 period (12 5m candles in 1 hour).
