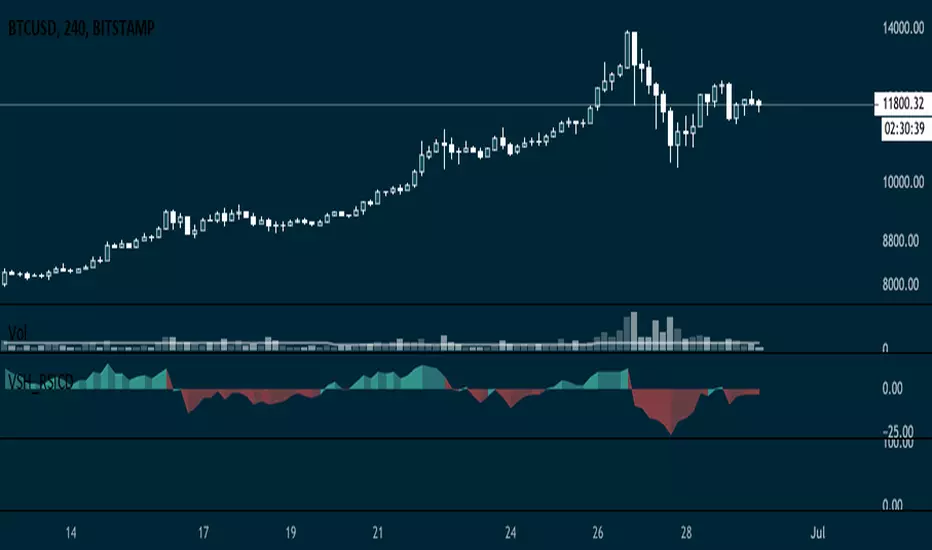
VSH_RSICDRSI Convergence Divergence Histogram (only) inspired by VSH_RSI and traditional MACD but purely based on RSI.
Not only does decent job capturing momentum transition (base cross) but can also be used to identify cleaner divergences.
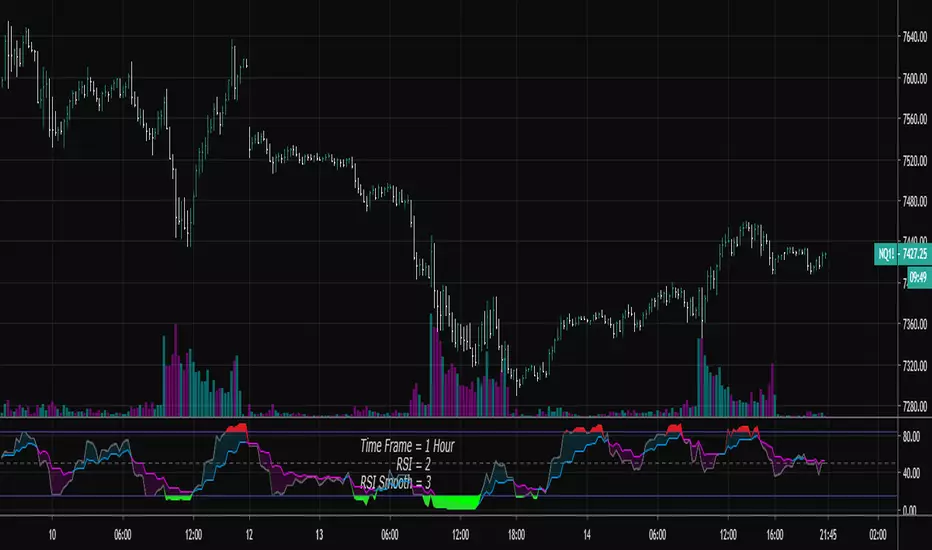
Rsi-2
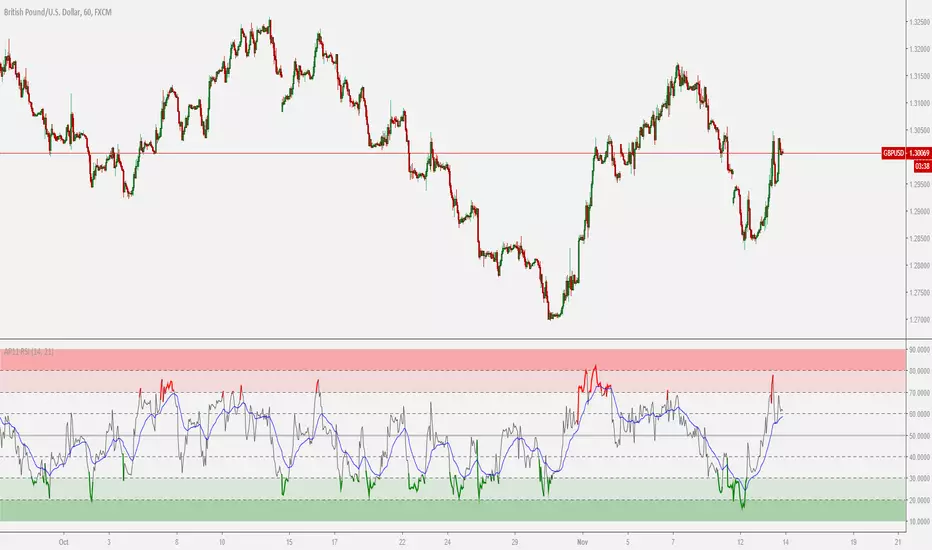
RSI Shaded - MTF
Non-repainting multiple time frame RSI with shading of overbought and oversold levels.
Includes option for simple moving average smooth of the RSI (Larry Connors)
Includes option to plot the EMA of the RSI
Related to RSI Shaded .
For other multiple time frame indicators see:
Adaptive ATR-ADX Trend
Fisher Transform MTF
ADX-DI MTF
Laguerre RSI MTF
OBV AverageThis study calculates the OBV and enables the ability to get the SMA of an OBV with a dynamic value of lookback set.

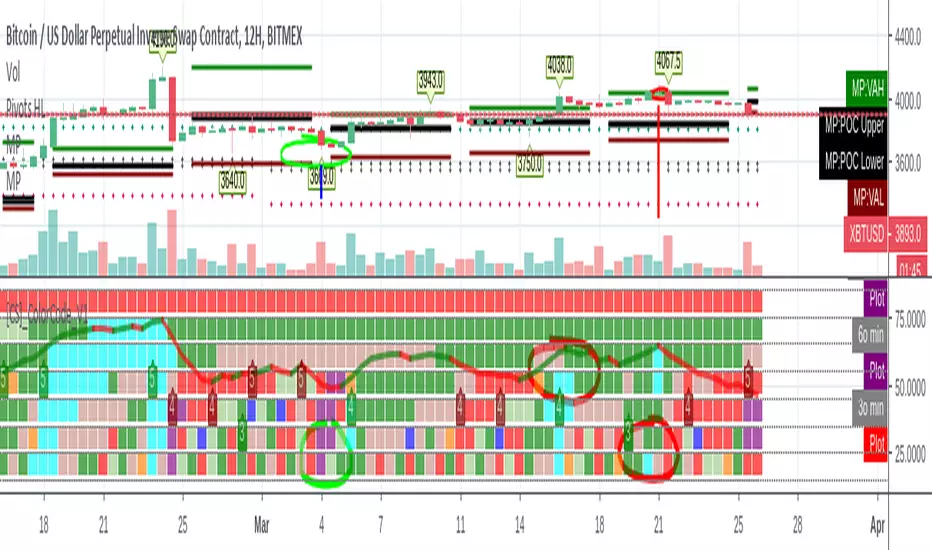
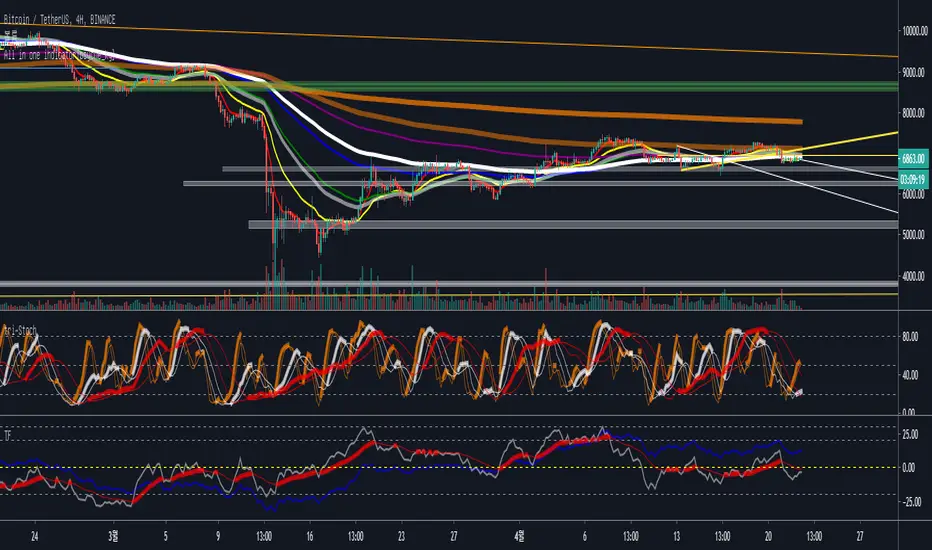
[CS]_ColorCode_V1 Multitimeframe Cardwell ReversalsToday I decided to create a powerful indicator for helping in identifying trend continuation and reversals using Cardwell's famous techniques.
For the whom interested Cardwell's work is widely presented in different textbooks such as "John Hayden" The Complete RSI Guide and accessible online.
From "John Hayden" The Complete RSI Guide:
Wilder (Author of RSI) states in his opinion that the greatest value of the RSI is in pointing out a divergence between the graphs for the RSI and price behavior. Their graphical behavior reveals a bullish divergence (or as he calls
it a bottom failure swing) when the price makes a new low, while the RSI continues under 30 and fails to make a new low. When the RSI proceeds to exceed the previous RSI peak, a short-term buy signal occurs
according to Wilder.
However, what the average investor comprehends is a small part of the dynamic overall picture. For example, if the range effectively shifts in a bull market so
that 80 is overbought, then Andrew Cardwell realized that the support level must also shift. Inversely if the oversold level in a bear market will shift down to 20, then the resistance level in a bear market must also
shift.
Another tools I prefer to use to indicate trend is moving averages, the standard workhorse used by most technical traders. Moving averages are valuable, as they will remove the volatility from whatever they are
calculated from. For example, calculating a moving average based on the RSI, effectively removes the volatility and gives a smoother signal. In fact, the trend can be confirmed by calculating a 9 period simple
moving average and a second 45 period weighted moving average on both the RSI and price.
From Cardwell's famous RSI Workbook, when the:
1. The 9 period on price is above the 45 period on price, and The 9 period on RSI is above the 45 period on RSI the trend is up.
2. The 9 period on price is below the 45 period on price, and The 9 period on RSI is below the 45 period on RSI the trend is down.
3. The 9 period on price is above the 45 period on price, and The 9 period on RSI is below the 45 period on RSI the trend is sideways to up.
4. The 9 period on price is below the 45 period on price, and The 9 period on RSI is above the 45 period on RSI the trend is sideways to down.
Since the RSI is more volatile than the price, the 9 period simple moving average (SMA) on RSI will cross its respective 45 period weighted moving average (WMA) before the 9 period (SMA) on price will cross its
respective 45 period moving average. I place more emphasis on the moving averages based on price than those based on RSI. Staying aware of what the moving averages are doing will help you to stay focused on
the overall trend. When I am talking to another trader, I will often say that the moving average on price is positive.
This implies that the short term, 9 period SMA is, above the longer term, 45 WMA. The largest moves will frequently come when both moving averages are moving in the same direction. One more thought on
moving averages. You will find the moving average 45 WMA will prove to be support or resistance on both price and RSI. For example, you will often see a bullish market retrace to its respective 45 period
moving average (price and/or RSI). When this is observed it is another sign of what the trend actually is.
On the indicator:
1. is represented in Green Color
2. is represented in Red Color
3. is represented in Light-Green-Grey
4. is represented in Light-Pink-Grey
1. + Overbought (RSI Above 80) is represented in Acqua
2. + Oversold (RSI Below 20) is represented in Purple
1. + RSI Turned Bearish (RSI Below 50) is represented in Orange
2. + RSI Turned Bullish (RSI Above 50) is represented in Blue
In Addition a counter is displayed about the positives or negatives timeframes and an average line is computed across timeframes with green / red color comparison.
Timeframes are specified in the indicator panel and are the following:
- Weekly
- Daily
- 12h
- 4h
- 2h
- 1h
- 30 min
Enjoy,
CryptoStatistical
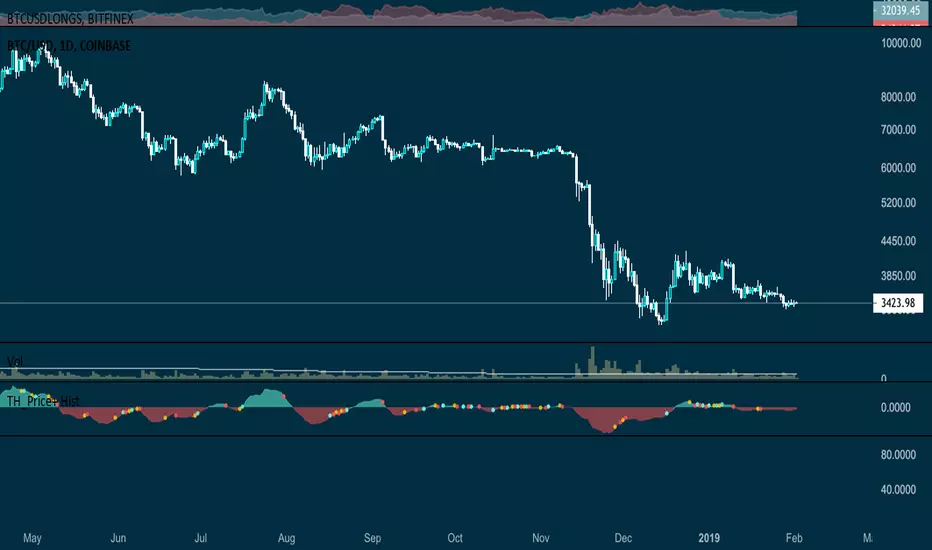
TH_Price+ HistogramPrice plotted into centralized oscillator normalized via 7/14 moving averages. The Histogram reveal longer trends while flags warn for early entry/exits. This script has been backtested with astonishing results particularly on 4H and Daily timeframes.
You can use this in combination with Hull+ or Delta Map (Premium), RSI+ or RSI Delta (Premium) and also OBV+ Histogram for stronger confirmations.
MFIww MFI/RSI_v2[wozdux]A new version of the indicator Mfi_v2. Added new control parameters.
tt - the averaging period of the volume.
Len - the period for calculating the MPI.
nn-averaging period MFI (blue line). level-critical levels from below and above (black horizontal lines).
Level 0 or 50 - switch between different histogram views with the middle at either level 50 or level 0.
key level-key to remove black critical levels.
key ema (MFI, nn) - key to remove mfi averaging (blue line).
key color-key to remove histogram coloring.
key colomns a-line - key switching modes represent the mfi histrogram or line.
---------------------------
Новая версия индикатора MFIww_v2. Добавлены новые управляющие параметры.
tt- период усреднения объема.
Len - период вычисления MFI.
nn- период усреднения MFI (голубая линия).
level- критические уровни снизу и сверху (черные горизонтальные линии).
Level 0 or 50 - переключение между разными представлениями гистрограммы с серединой либо на уровне 50 , либо на уровне 0.
key level- ключ убрать черные критические уровни.
key ema(mfi,nn) - ключ убрать усреднение mfi (голубая линия).
key color- ключ убрать расцветку гистрограммы.
key colomns-line - ключ переключения режимов представления mfi гистрограммой или линией.

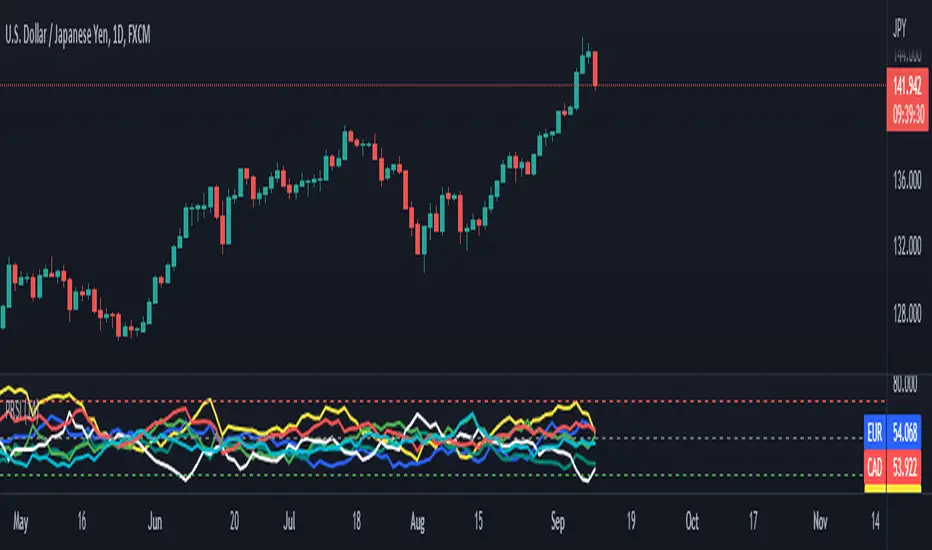
pooya AVG RSIThis is an RSI range for the most popular index in FOREX:
EUR
USD
GBP
JPY
AUD
CAD
CHF
NZD
comment your opinion
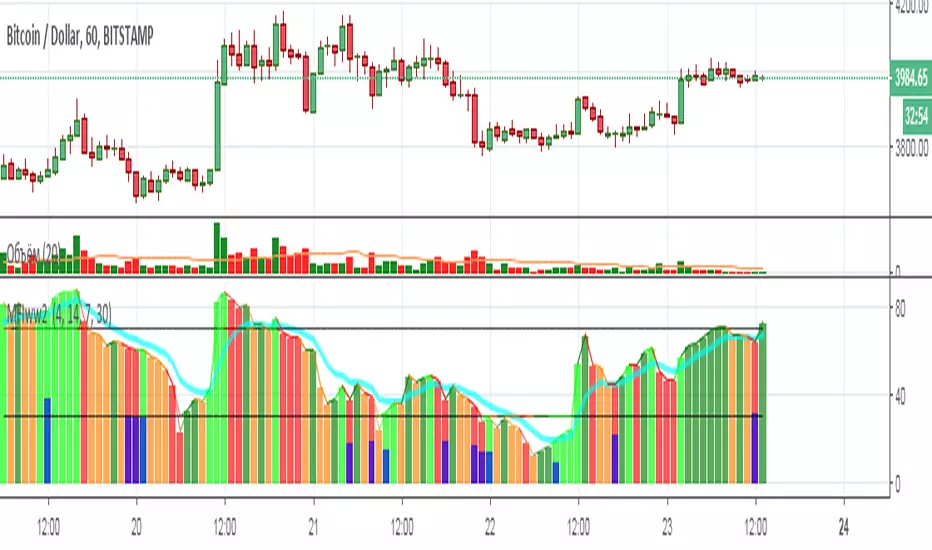
MFIww2 MFI/RSI [wozdux]Bill Williams indicator (MFI).
The indicator calculates the range of oscillations per unit volume. In fact, this indicator shows the tick volume or the readiness of the market to move the price.
The indicator is presented as vertical columns or as a line with levels.
Vertical columns are painted in different colors depending on the displacement of the indicator and the displacement of the volume. The indicator can increase or decrease (+-). The volume can also increase or decrease (+-). The combination of these factors generates four types of indicator columns.
++ lime
+- dark green
-+ red
-- orange
The red bar on Williams is a squat bar. This bar is important for market reversal indication.
-------------------------------
Индикатор Билла Вильямса (MFI).
Индикатор вычисляет диапазон колебаний на единицу объема. Фактически этот индикатор показывает тиковый объем или готовность рынка переместить цену.
Индикатор представлен в виде вертикальных колонок или в виде линии с уровнями.
Вертикальные колонки раскрашены в различные цвета в зависимости от смещения индикатора и смещения объема. Индикатор может увеличиваться или уменьшаться (+-). Объем также может увеличиваться или уменьшаться (+-). Сочетание этих факторо порождает четыре вида столбиков индикатора.
++ салатный
+- темно-зеленый
-+ красный
-- оранжевый
Красный столбик по Вильямсу есть приседающий бар. Этот бар важен для индикации разворота рынка.

RSI Cross by uykusuzpenguenRSI Cross Explanation;
It's simple,
When short-term RSI crossover long-term RSI ; BUY ( Green Area )
When short-term RSI crossunder long-term RSI ; SELL ( Red Area )
You can change RSI lenghts or moving average lenght on settings.
If you knew that, you would sell all your bitcoins at a price of $13.500 and not look back on 8th January.
Happy trading.

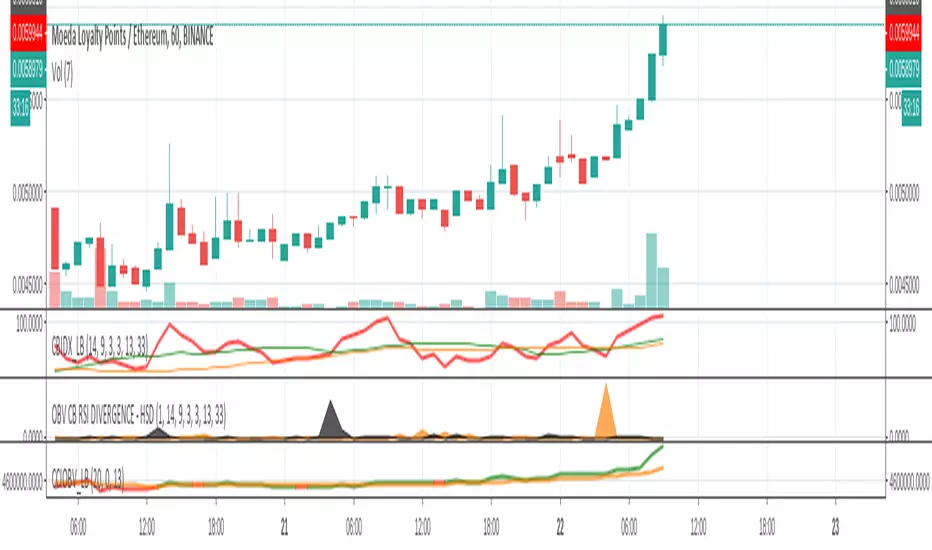
OBV CB RSI DIVERGENCE - HSDShows divergence spikes between OBV and Constance Brown RSI
Trade in the direction of the obv trend when it spikes
Includes LazyBear code and A&E's help - very much appreciated
Useful for all markets n instruments, i guess
StochRSI+StochRSI+ is a Stoch RSI study enhanced with some background highlights and flags to enhance the visual reading of standard oscillator.
Default Settings:
RSI: 13
Stoch RSI: 13
%K: 3
%D: 3
Oversold: 20
Extended Oversold: 7
Overbought: 80
Extended Overbought: 93
Activate Highlights and/or Flags for:
- Stoch RSI Oversold/Overbought. (Default: Active)
- Stoch RSI Extended Oversold/Overbought. (Default: Active)
- %K crosses %D. (Default: Inactive)
RSI MACD+RSI MACD is a typical MACD indicator with RSI as its source, instead of price close.
Enhanced with signals whenever crossings occur.
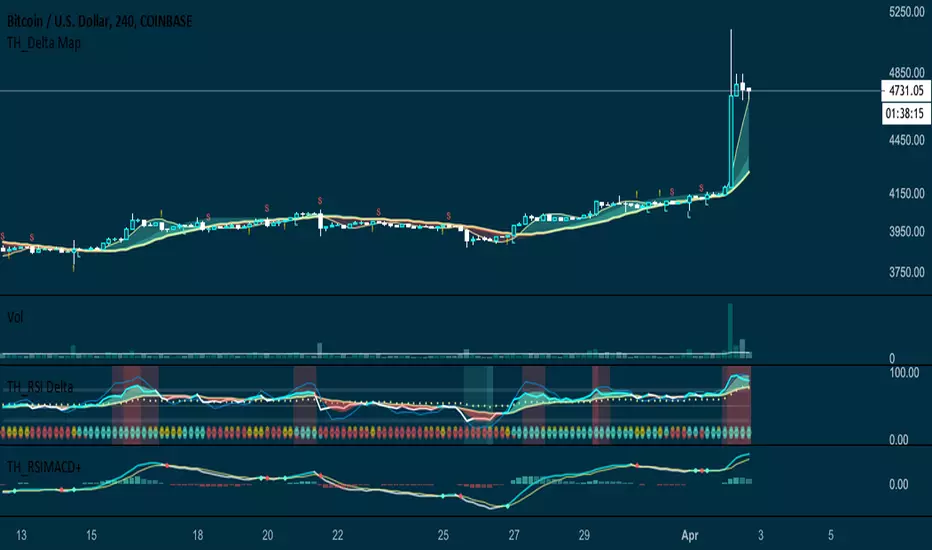

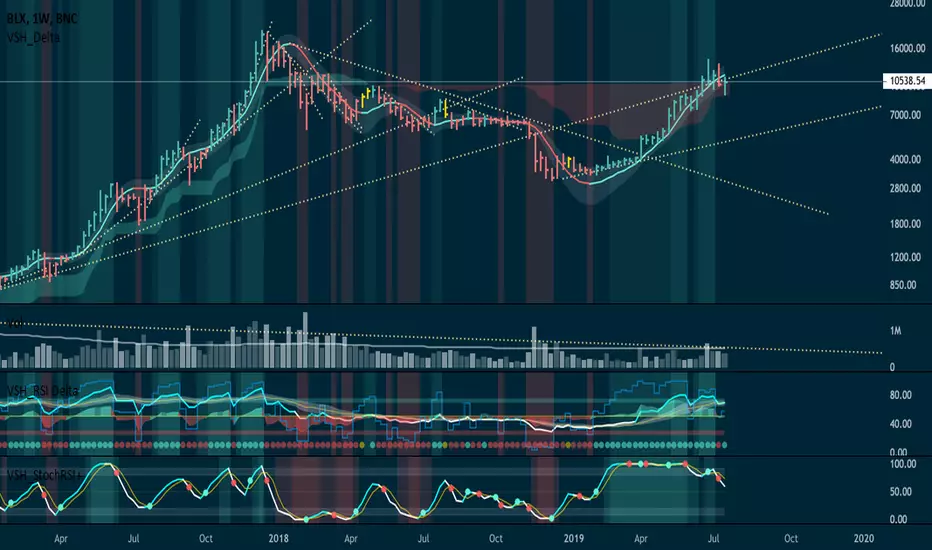
RSI 𝝙 MapRSI 𝝙 Map is a on-chart application of signals produced by the original RSI 𝝙 Indicator.
RSI 𝝙 is a full study system of several RSI analysis that can be used on different timeframes and adapt strategy to trending markets or trading ranges.
Default Settings:
RSI: 13
Linear Regression of RSI: 34
Signal RSI: 5
Long RSI: 55
RSI 𝝙 Histogram: Delta between RSI and Long RSI based on Signal RSI_Length.
Activate Vertical Bar Highlights and/or Signal Candle Flags for:
- RSI Oversold/Overbought. (Default: Highlight Bar)
- Signal RSI Oversold/Overbought. (Default: Highlight Bar)
- RSI crossing its Linear Regression . (Default: Signal Candle Flag)
- RSI crossing its Long RSI . (Default: Off)
- Signal RSI crossing its RSI . (Default: Off)
- Signal RSI crossing its Long RSI . (Default: Off)
- RSI 𝝙 Histogram crossing baseline. (Default: Off)
Users can also do extra tuning in Style Section of Format options.
The market behaves differently when the pacing changes, volatility changes and when it trends or when it ranges. Develop an understanding of it with the help of this study.
Avoid risking more than 1% per trade. Be responsible for always making a priority about protecting capital and risk management. Develop emotional control and use this RSI study to develop a more complete trading system without any need for extra indicators other than Price and Volume .
👆active signals:
RSI Overbought/Oversold
Signal RSI Overbought/Oversold
RSI crossing Linear Regression
👆active signals:
RSI Overbought/Oversold
Signal RSI Overbought/Oversold
Signal RSI crossing RSI
Signal RSI crossing Long RSI
👆active signals:
RSI Overbought/Oversold
Signal RSI Overbought/Oversold
RSI crossing Linear Regression
RSI crossing Long RSI
Signal RSI crossing RSI
RSI+RSI+ is an augmented version of standard Relative Strength Index (RSI) enhanced with a EMA cloud and some momentum background highlights.
Includes 7 Color Themes (4 dark, 3 light).

RSI 𝝙RSI 𝝙 is a full study system of several RSI analysis that can be used on different timeframes and adapt strategy to trending markets or trading ranges.
Identify better divergences/convergences, alerts for *potential* entry, flat and exit signals. Adapt personal strategy according to the market pace, behaviour and timeframe.
Default Settings:
RSI: 13
Linear Regression of RSI: 34
Signal RSI: 5
Long RSI: 55
RSI 𝝙 Histogram: Delta between RSI and Long RSI based on Signal RS 0.31% Length.
Activate Vertical Bar Highlights and/or Signal Flags for:
- RSI Oversold/Overbought. (Default: Highlight Bar)
- Signal RSI Oversold/Overbought. (Default: Highlight Bar)
- RSI crossing its Linear Regression . (Default: Signal Flag)
- RSI crossing its Long RSI . (Default: Off)
- Signal RSI crossing its RSI . (Default: Off)
- Signal RSI crossing its Long RSI . (Default: Off)
- RSI 𝝙 Histogram crossing baseline. (Default: Off)
Users can also do extra tunning in Style Section of Format options.
Typical use case for Daily timeframe:
RSI cross its Linear Regression produce a close signal of the on-going trend. RSI 𝝙 Histogram crossing could also provide early an signal or a confirmation. Then look RSI or RSI 𝝙 Histogram is forming a Divergence. If divergence is confirmed after candle close you can look into Signal RSI crossing RSI/Long RSI or RSI breaking the support/resistance horizontal/trendlines OR if you are more conservative wait until RSI cross Long RSI . The different markets will show slightly diff behaviours but with this indicator, we can capture its essence independently of timeframe.
RSI being above/bellow Long RSI establishes the relatively long-term bias in trending markets. This is also valid for Weekly and Monthly timeframes.
This is just a guideline suggestion. The reality is users of this indicator need to observe the market's behaviour and identify which signals will provide more reliable entries, exits and/or remain until next signals before the next round of trades.
The market behaves differently when pacing changes, volatility changes, when it trends or when it ranges. Develop an understanding of it with the help of this study.
Avoid risking more than 1% per trade. Be responsible for always making a priority about protecting capital and risk management. Develop emotional control and use this RSI study to develop a more complete trading system without any need for extra indicators other than Price and Volume .
👆active signals:
RSI crossing Linear Regression
RSI crossing Long RSI
👆active signals:
Signal RSI Long RSI
👆active signals:
RSI crossing Linear Regression
Also note that RSI 𝝙 Histogram divergences/convergences flag very often significant momentum changes. This important information is extremely useful when also looking to volume anomalies and help deciding to close a position (or enter next) before flash crash occur where a signal might come slightly late on higher timeframes.
TTM Apollo 11 RSIColor coded RSI to give a better indication of when to buy or sell based on the RSI level along with an included EMA signal to help describe the trend.
Stoch_Williams_RSI[wozdux]2Strategy. The indicator gives buy and sell signals based on two or three indicators.
Alert 2 is the signal from the two indicators is the Stochastic + Williams. Alert 3 signal from three Stochastic + Williams+ RSI indicators is simple. The Alert4 signal from the three Stochastic + Williams+MTF indicators is simple. Alert5 signal from three Stochastic + Williams+ RSI-2 indicators smoothed.
Settings.
""alert 2 show" - show signal button
""alert 3 show" - show signal button
""alert 4 show" - show signal button
""alert 5 show" - show signal button
To use, you need to connect the "alert" by one of the "alert-2-3-4-5".
Стратегия. Индикатор дает сигналы на покупку и продажу на основе двух или трех индикаторов.
Alert2 это сигнал от двух индикаторов Stochastic + Williams. Alert3 сигнал от трех индикаторов Stochastic + Williams+ RSI простой. Alert4 сигнал от трех индикаторов Stochastic + Williams+MTF простой. Alert5 сигнал от трех индикаторов Stochastic + Williams+ RSI-2 сглаженный.
Настройки.
"alert2 show"- кнопка показать сигнал
"alert3 show"- кнопка показать сигнал
"alert4 show"- кнопка показать сигнал
"alert5 show"- кнопка показать сигнал
Чтобы воспользоваться, нужно подключить "оповещение" по одному из «alert-2-3-4-5».

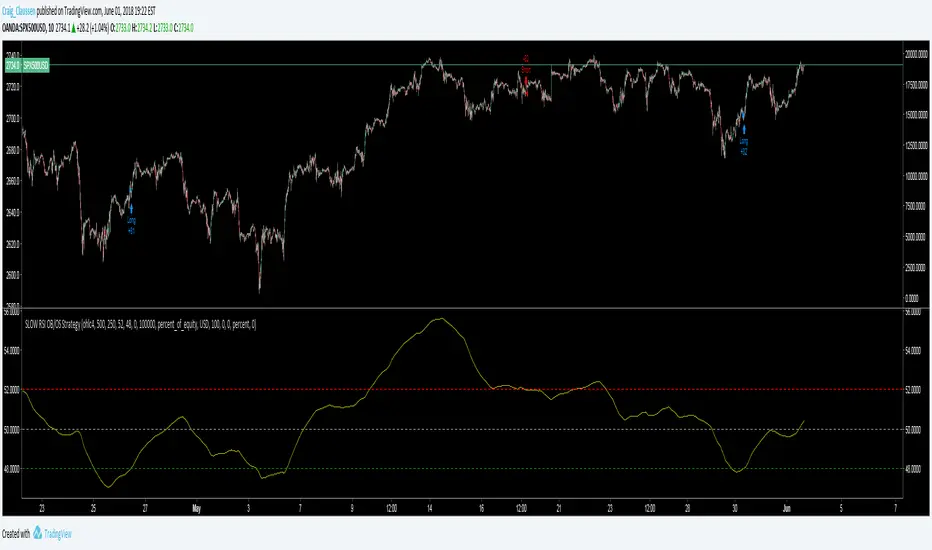
SLOW RSI OB/OS StrategySlowing the RSI down opens up a whole new world of possibilities.
This concept can work for a lot of TA indicators including the MACD.
See script source code for further description. Feel free to add pyramid trades at your own discretion in your format menu.
No this doesn't repaint!
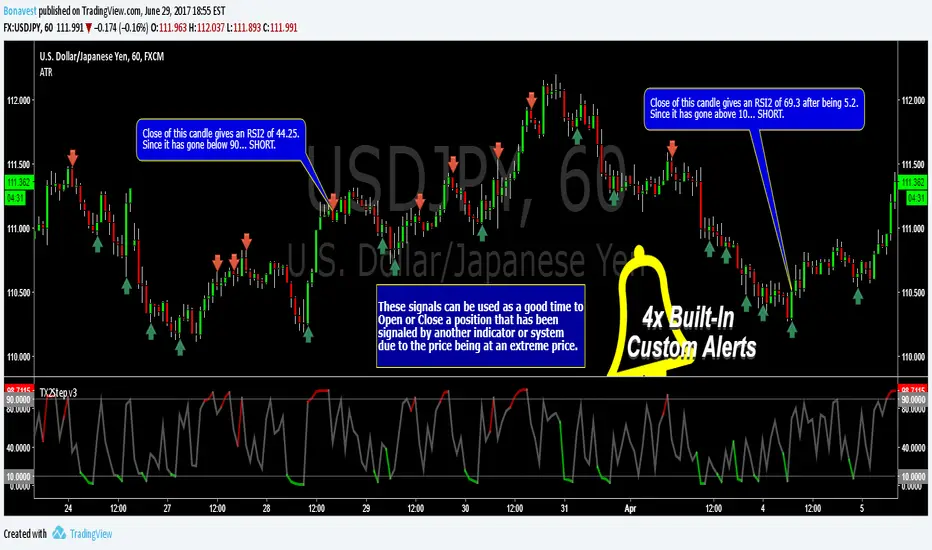
TEXAS 2 Step RSI-2 - Alerts Built-inBe sure to Add to Favorites (down below) and/or Like/Follow this script so that you will be alerted to UPDATES.
Adding to Favorites makes it available in your list of Indicators.
The Texas 2 Step is a lower indicator (arrows on candles added for reference) based on the RSI-2 Strategy made famous by Larry Connors.
I use this indicator for:
Timing Entries and Exits
Trading Between Up/Ddown Signals
Detecting Trends and Pull Backs
I use this indicator by looking for the RSI-2 number going back inside the 10-90 range(gray) after being outside (red/green). This tells me the price is no longer at an extreme. You never know how many candles will remain in the extreme areas so wait for a candle to close inside the range.
On longer time frames (daily/weekly) you will notice several candles will stay in the extreme areas resulting in 100 pips or more before returning to the inside range. In these cases you can go LONG/SHORT in the direction of the extreme area and close your position once it returns to the inside range.
There are 4 Built-In Notifications already created for you and are available by simply right clicking in the indicator area and selecting:
Condition: TX2Step v3 - RSI
Then 1 of the 4 Alerts:
Green Alert - RSI2 > 90 and line turns Green
Red Alert - RSI2 < 10 and line turns Red
Down - RSI2 < 90 after being in the top RSI2 > 90 area
Up - RSI2 > 10 after being in the bottom RSI2 < 10 area
I look forward to hearing your thoughts on the indicator and will definitely like to build upon this indicator and continue to update it.
This adaptation was based off of the original code from the talented Chris Moody.
Plenty of additional information about Larry Connors RSI-2 Strategy with PDFs and Backtests in the stock markets on the original Script.
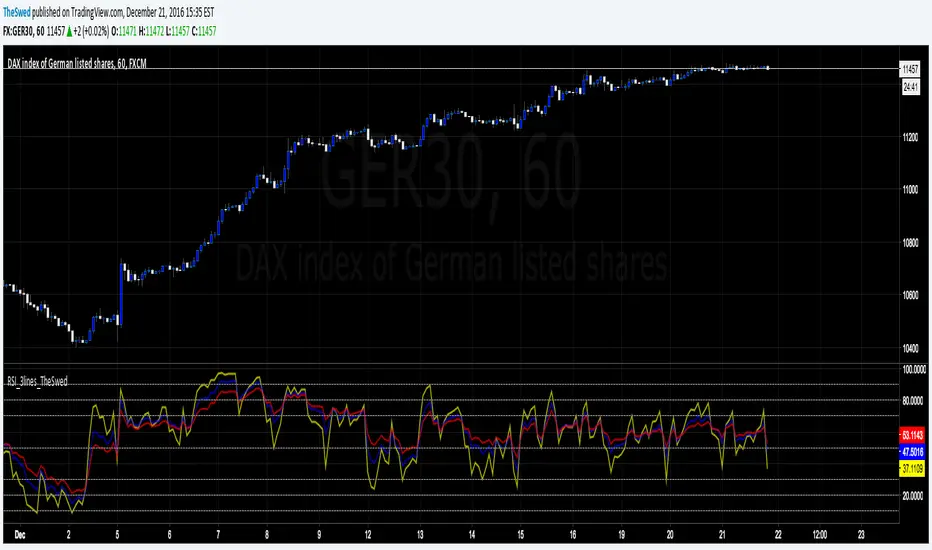
RSI_3lines_TheSwedRSI script with 3 lines. Also added lines: 90, 80, 20 and 10 to the script as I use this for trading.