FluxPulse Momentum [JOAT]FluxPulse Momentum - Adaptive Multi-Component Oscillator
FluxPulse Momentum is a composite oscillator that blends three distinct momentum components into a single, smoothed signal line. Rather than relying on a single indicator, it synthesizes adaptive RSI, normalized rate of change, and a Kaufman-style efficiency ratio to provide a multi-dimensional view of momentum.
What This Indicator Does
Combines RSI, Rate of Change (ROC), and Efficiency Ratio into one weighted composite
Applies EMA smoothing to reduce noise while preserving responsiveness
Displays overbought/oversold zones with optional background highlighting
Generates buy/sell signals when the oscillator crosses its signal line in favorable zones
Provides a real-time dashboard showing current state, momentum direction, and efficiency
Core Components
Adaptive RSI (50% weight) — Standard RSI calculation normalized around the 50 level
Normalized ROC (30% weight) — Rate of change scaled relative to its recent maximum range
Efficiency Ratio (20% weight) — Measures directional movement efficiency, inspired by Kaufman's adaptive concepts
The final composite is smoothed twice using EMA to create both a fast line and a signal line.
Signal Logic
// Buy signal: crossover in lower half
buySignal = ta.crossover(qmo, qmoSmooth) and qmo < 50
// Sell signal: crossunder in upper half
sellSignal = ta.crossunder(qmo, qmoSmooth) and qmo > 50
Signals are generated only when the oscillator is positioned favorably—buy signals occur below the 50 midline, sell signals occur above it.
Dashboard Information
The on-chart table displays:
Current oscillator value with gradient coloring
Momentum state (Overbought, Oversold, Bullish, Bearish, Neutral)
Momentum direction and acceleration
Efficiency ratio percentage
Active signal status
Inputs Overview
RSI Length — Period for RSI calculation (default: 14)
ROC Length — Period for rate of change (default: 10)
Smoothing Length — EMA smoothing period (default: 3)
Overbought/Oversold Levels — Threshold levels for zone detection
Await Bar Confirmation — Wait for bar close before triggering alerts
How to Use It
Watch for crossovers between the main line and signal line
Use overbought/oversold zones to identify potential reversal areas
Monitor the histogram for momentum acceleration or deceleration
Combine with price action analysis for confirmation
Alerts
Buy Signal — Bullish crossover in the lower zone
Sell Signal — Bearish crossunder in the upper zone
Overbought/Oversold Crosses — Level threshold crossings
This indicator is provided for educational purposes. It does not constitute financial advice. Always conduct your own analysis before making trading decisions.
— Made with passion by officialjackofalltrades
RATE

Adaptive Momentum Pressure (AMP)🔹 Adaptive Momentum Pressure (AMP)
A hybrid momentum oscillator that adapts to volatility and trend dynamics.
AMP measures the rate of change of price pressure and automatically adjusts its sensitivity based on market volatility.
It reacts faster in trending markets and smooths out noise during consolidation — helping traders identify genuine momentum shifts early while avoiding whipsaws.
🧠 Core Concept
AMP fuses three elements into one adaptive momentum model:
Normalized Momentum (ROC) – captures directional acceleration of price.
Adaptive Smoothing – the smoothing length dynamically contracts when volatility rises and expands when it falls.
Directional Bias – derived from the short-term EMA slope to weight momentum toward the prevailing trend.
Combined, these form a pressure value oscillating between –100 and +100, revealing when momentum expands or fades.
⚙️ How It Works
Calculates a normalized rate of change (ROC) relative to recent volatility.
Adjusts its effective length using the ATR — more volatile periods shorten the lookback for quicker reaction.
Applies a custom EMA that adapts in real time.
Modulates momentum by a normalized EMA slope (“trend bias”).
Produces a smoothed AMP line with a Signal line and crossover markers.
🔍 How to Read It
Green AMP line rising above Signal → Building bullish momentum.
Red AMP line falling below Signal → Fading or bearish momentum.
White Signal line = smoothed confirmation of trend energy.
Green dots = early bullish crossovers.
Red dots = early bearish crossovers.
Typical interpretations:
AMP crossing above 0 from below → early bullish impulse.
AMP peaking near +50–100 and curling down → potential momentum exhaustion.
Crosses below 0 with red pressure → bearish confirmation.
⚡ Advantages
✅ Adaptive across all markets and timeframes
✅ Built-in trend bias filters false signals
✅ Reacts earlier than RSI/MACD while reducing noise
✅ No manual retuning required
🧩 Suggested Use
Combine with structure or volume tools to confirm breakouts.
Works well as a momentum confirmation filter for entries/exits.
Optimal display: separate oscillator pane (not overlay).
Use it responsibly — AMP is an analytical tool, not financial advice.

New Rate - PROIndicator Description: New Rate - PRO
The New Rate - PRO is an advanced trading indicator designed to assist traders in identifying significant price levels and potential reversal points within a specified time frame. By highlighting key highs and lows, projecting trendlines, and providing visual cues, this indicator enhances your ability to make informed trading decisions. It offers extensive customization options, ensuring adaptability to various trading styles and market conditions.
---
Key Features:
Customizable Color Themes: Choose between Dark and Light color styles to match your chart preferences.
High and Low Line Detection: Automatically identifies and draws lines for significant high and low price levels within the defined analysis period.
Midline Projection: Optionally displays a midline representing the 50% range between the detected high and low, aiding in trend analysis.
Candle Coloring: Colors the first six candles within the analysis range with a specific color, while the remaining candles are displayed in a subdued gray for clarity.
Trading Session Highlight: Highlights the designated trading hours on the chart, providing a clear visual reference for active trading periods.
Touch Detection Arrows: Plots arrows on the chart when the price touches the detected high or low levels, indicating potential trading opportunities.
Extensive Customization Options: Allows users to adjust line colors, styles, widths, label texts, and more to suit individual trading preferences.
Timeframe and Range Configuration: Defines the specific timeframe and time range for analysis, ensuring precise detection of significant price levels.
How Does the Indicator Work?
Color Style Selection:
- Choose between "Dark" or "Light" themes to match your chart setup, adjusting the color palette for optimal visibility.
High and Low Line Detection:
- The indicator analyzes the first six candles within the specified time range to identify the highest and lowest price levels.
- Once detected, it draws horizontal lines extending 25 candles to the right, marking these significant levels on the chart.
Midline Projection:
- If enabled, the indicator calculates the midpoint between the detected high and low.
- It then draws a horizontal line at this midpoint, providing an additional reference for potential support or resistance.
Candle Coloring:
- The first six candles within the analysis period are colored based on user selection (default: yellow).
- Subsequent candles are displayed in a semi-transparent gray, allowing the key candles to stand out.
Trading Session Highlight:
- Highlights the active trading hours on the chart using a semi-transparent orange background.
- This visual aid helps traders focus on periods of increased market activity.
Touch Detection Arrows:
- When the price touches the previously detected high or low levels, the indicator plots an upward green arrow or a downward red arrow, respectively.
- These arrows signal potential entry points for buy or sell trades.
Customization of Labels and Lines:
- Users can customize the colors, styles (Solid, Dotted, Dashed), and widths of the high, low, and midline.
- Label texts and font sizes are also adjustable to enhance readability.
How to Use the Indicator?
Setup Color Themes:
- Select your preferred color theme ("Dark" or "Light") to ensure the indicator aligns with your chart's appearance.
Configure High and Low Lines:
- Adjust the line color, style, and width to clearly distinguish high and low levels on the chart.
- Enable or disable the midline based on your analysis needs.
Set Timeframe and Analysis Range:
- Define the chart's timeframe in minutes (e.g., 5 minutes) to tailor the indicator's sensitivity.
- Specify the start and end hours and minutes for the analysis period to focus on specific trading sessions.
Customize Candle Colors:
- Choose the color for the first six candles within the analysis range.
- The remaining candles will automatically be displayed in a default gray color.
Enable Trading Session Highlight:
- Activate the background highlight for the trading session to visually separate active trading hours from inactive periods.
Monitor Touch Detection Arrows:
- Watch for green upward arrows indicating potential buy signals when the price touches the high level.
- Look for red downward arrows signaling potential sell opportunities when the price reaches the low level.
Adjust Labels and Visual Elements:
- Modify label texts and font sizes to ensure clarity and avoid clutter on the chart.
- Fine-tune line styles and colors for better visual differentiation.
Plan Your Trades:
- Use the detected high and low levels as reference points for setting entry, stop-loss, and take-profit levels.
- Combine with other technical analysis tools to confirm trade signals and enhance decision-making.
---
What Makes This Indicator Original?
Dynamic High and Low Detection: Automatically identifies significant price levels within a defined time range, providing timely insights into market movements.
Midline Projection Feature: Offers an additional reference point by calculating and displaying the midpoint between high and low levels, aiding in trend analysis.
Customizable Visual Elements: Extensive customization options for colors, styles, and labels allow traders to tailor the indicator to their specific preferences and trading environments.
Touch Detection Arrows: Provides clear visual signals when the price interacts with key levels, facilitating quick decision-making for trade entries.
Trading Session Highlight: Enhances focus by visually distinguishing active trading periods, helping traders concentrate on high-probability trading times.
Trade Summary Visualization: (If applicable based on code) Offers a summary of recent trades, allowing traders to assess performance directly on the chart.
Additional Considerations
Testing and Optimization: Before deploying the indicator in live trading, test it on historical data and a demo account to fine-tune settings according to your trading strategy.
Complementary Analysis: Use the indicator alongside other technical analysis tools such as moving averages, trendlines, and oscillators to confirm trade signals.
Risk Management: Always set appropriate stop-loss and take-profit levels to manage risk effectively, regardless of the indicator's signals.
Stay Informed: Keep abreast of market news and economic events that may influence price movements and affect the indicator's performance.
Adjust for Different Assets: Customize the indicator's settings based on the asset's volatility and trading behavior to enhance accuracy and reliability.
---
Example Configuration
To help you get started, here is an example configuration:
Color Style: Dark
Line Color (High and Low): Red
Line Style (High and Low): Dotted
Line Width (High and Low): 2
Midline Color (50%): Blue
Show Midline: Yes
Label Text Color: Gray
Label Font Size: Medium
Candle Color (First 6 Candles): Yellow
Default Candle Color (Remaining Candles): Semi-transparent Gray
Timeframe Minutes: 5
Analysis Start Time: 08:35
Analysis End Time: 09:05
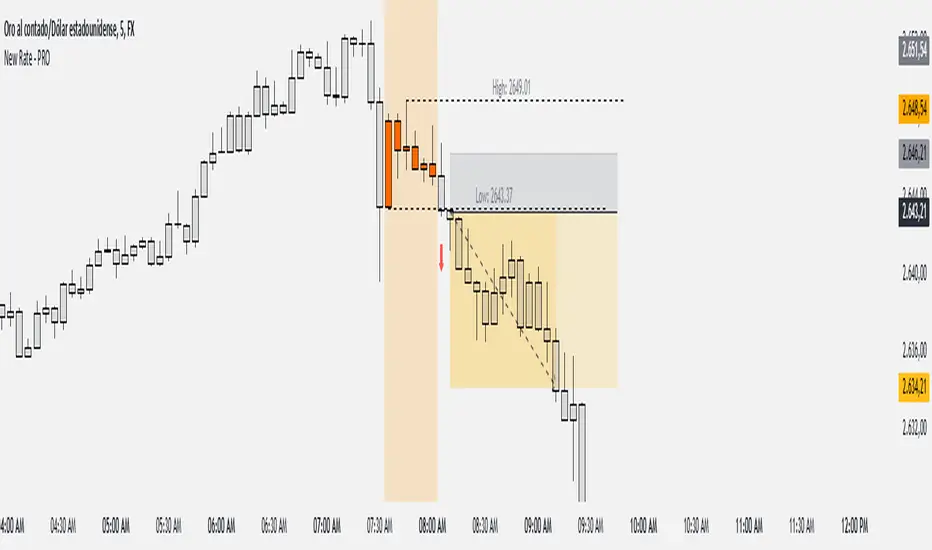
These settings are optimized for a 5-minute XAUUSD chart during the 8:35 to 09:05 trading session, highlighting key price levels and providing clear visual signals for potential trades.
Conclusion
The New Rate - PRO indicator is tool that combines dynamic price level detection with extensive customization and real-time visual cues. By automatically identifying significant highs and lows, projecting trendlines, and signaling potential trade opportunities, it enhances your ability to navigate the markets effectively. Its adaptability through customizable settings ensures that it can be tailored to various trading styles and market conditions, making it a valuable addition to any trader's toolkit.
Interest Rate Trading (Manually Added Rate Decisions) [TANHEF]Interest Rate Trading: How Interest Rates Can Guide Your Next Move.
How were interest rate decisions added?
All interest rate decision dates were manually retrieved from the 'Record of Policy Actions' and 'Minutes of Actions' on the Federal Reserve's website due to inconsistent dates from other sources. These were manually added as Pine Script currently only identifies rate changes, not pauses.
█ Simple Explanation:
This script is designed for analyzing and backtesting trading strategies based on U.S. interest rate decisions which occur during Federal Open Market Committee (FOMC) meetings, to make trading decisions. No trading strategy is perfect, and it's important to understand that expectations won't always play out. The script leverages historical interest rate changes, including increases, decreases, and pauses, across multiple economic time periods from 1971 to the present. The tool integrates two key data sources for interest rates—USINTR and FEDFUNDS—to support decision-making around rate-based trades. The focus is on identifying opportunities and tracking trades driven by interest rate movements.
█ Interest Rate Decision Sources:
As noted above, each decision date has been manually added from the 'Record of Policy Actions' and 'Minutes of Actions' documents on the Federal Reserve's website. This includes +50 years of more than 600 rate decisions.
█ Interest Rate Data Sources:
USINTR: Reflects broader U.S. interest rate trends, including Treasury yields and various benchmarks. This is the preferred option as it corresponds well to the rate decision dates.
FEDFUNDS: Tracks the Federal Funds Rate, which is a more specific rate targeted by the Federal Reserve. This does not change on the exact same days as the rate decisions that occur at FOMC meetings.
█ Trade Criteria:
A variety of trading conditions are predefined to suit different trading strategies. These conditions include:
Increase/Decrease: Standard rate increases or decreases.
Double/Triple Increase/Decrease: A series of consecutive changes.
Aggressive Increase/Decrease: Rate changes that exceed recent movements.
Pause: Identification of no changes (pauses) between rate decisions, including double or triple pauses.
Complex Patterns: Combinations of pauses, increases, or decreases, such as "Pause after Increase" or "Pause or Increase."
█ Trade Execution and Exit:
The script allows automated trade execution based on selected criteria:
Auto-Entry: Option to enter trades automatically at the first valid period.
Max Trade Duration: Optional exit of trades after a specified number of bars (candles).
Pause Days: Minimum duration (in days) to validate rate pauses as entry conditions. This is especially useful for earlier periods (prior to the 2000s), where rate decisions often seemed random compared to the consistency we see today.
█ Visualization:
Several visual elements enhance the backtesting experience:
Time Period Highlighting: Economic time periods are visually segmented on the chart, each with a unique color. These periods include historical phases such as "Stagflation (1971-1982)" and "Post-Pandemic Recovery (2021-Present)".
Trade and Holding Results: Displays the profit and loss of trades and holding results directly on the chart.
Interest Rate Plot: Plots the interest rate movements on the chart, allowing for real-time tracking of rate changes.
Trade Status: Highlights active long or short positions on the chart.
█ Statistics and Criteria Display:
Stats Table: Summarizes trade results, including wins, losses, and draw percentages for both long and short trades.
Criteria Table: Lists the selected entry and exit criteria for both long and short positions.
█ Economic Time Periods:
The script organizes interest rate decisions into well-defined economic periods, allowing traders to backtest strategies specific to historical contexts like:
(1971-1982) Stagflation
(1983-1990) Reaganomics and Deregulation
(1991-1994) Early 1990s (Recession and Recovery)
(1995-2001) Dot-Com Bubble
(2001-2006) Housing Boom
(2007-2009) Global Financial Crisis
(2009-2015) Great Recession Recovery
(2015-2019) Normalization Period
(2019-2021) COVID-19 Pandemic
(2021-Present) Post-Pandemic Recovery
█ User-Configurable Inputs:
Rate Source Selection: Choose between USINTR or FEDFUNDS as the primary interest rate source.
Trade Criteria Customization: Users can select the criteria for long and short trades, specifying when to enter or exit based on changes in the interest rate.
Time Period: Select the time period that you want to isolate testing a strategy with.
Auto-Entry and Pause Settings: Options to automatically enter trades and specify the number of days to confirm a rate pause.
Max Trade Duration: Limits how long trades can remain open, defined by the number of bars.
█ Trade Logic:
The script manages entries and exits for both long and short trades. It calculates the profit or loss percentage based on the entry and exit prices. The script tracks ongoing trades, dynamically updating the profit or loss as price changes.
█ Examples:
One of the most popular opinions is that when rate starts begin you should sell, then buy back in when rate cuts stop dropping. However, this can be easily proven to be a difficult task. Predicting the end of a rate cut is very difficult to do with the the exception that assumes rates will not fall below 0.25%.
2001-2009
Trade Result: +29.85%
Holding Result: -27.74%
1971-2024
Trade Result: +533%
Holding Result: +5901%
█ Backtest and Real-Time Use:
This backtester is useful for historical analysis and real-time trading. By setting up various entry and exit rules tied to interest rate movements, traders can test and refine strategies based on real historical data and rate decision trends.
This powerful tool allows traders to customize strategies, backtest them through different economic periods, and get visual feedback on their trading performance, helping to make more informed decisions based on interest rate dynamics. The main goal of this indicator is to challenge the belief that future events must mirror the 2001 and 2007 rate cuts. If everyone expects something to happen, it usually doesn’t.

Funding Rate [CryptoSea]The Funding Rate Indicator by is a comprehensive tool designed to analyze funding rates across multiple cryptocurrency exchanges. This indicator is essential for traders who want to monitor funding rates and their impact on market trends.
Key Features
Exchange Coverage: Includes data from major exchanges such as Binance, Bitmex, Bybit, HTX, Kraken, OKX, Bitstamp, and Coinbase.
Perpetual Futures and Spot Markets: Fetches and analyzes pricing data from both perpetual futures and spot markets to provide a holistic view.
Smoothing and Customization: Allows users to smooth funding rates using a moving average, with customizable MA lengths for tailored analysis.
Dynamic Candle Coloring: Option to color candles based on trading conditions, enhancing visual analysis.
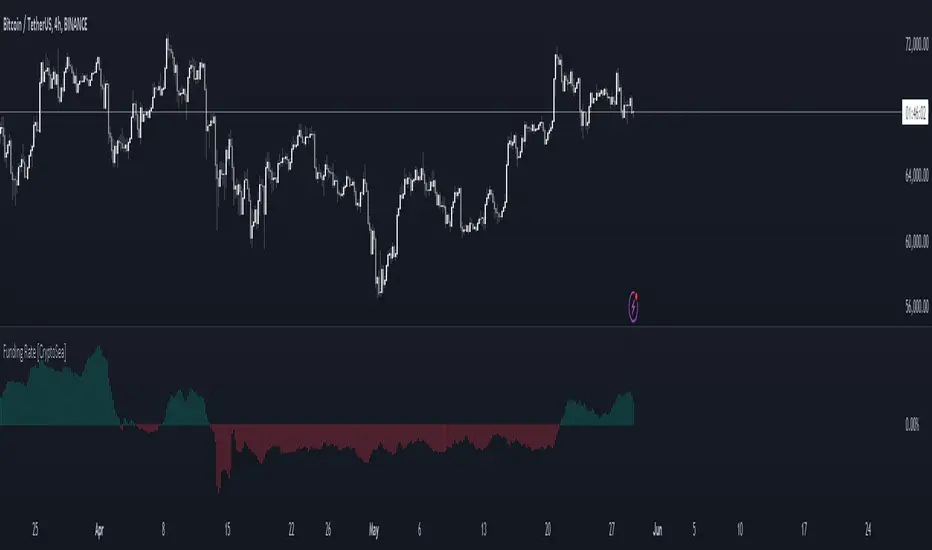
In the example below, the indicator shows how the funding rate shifts with market conditions, providing clear visual cues for bullish and bearish trends.
How it Works
Data Integration: Uses a secure security fetching function to retrieve pricing data while preventing look-ahead bias, ensuring accurate and reliable information.
TWAP Calculation: Computes Time-Weighted Average Prices (TWAP) for both perpetual futures and spot prices, forming the basis for funding rate calculations.
Funding Rate Calculation: Determines the raw funding rate by comparing TWAPs of perpetual futures and spot prices, then applies smoothing to highlight significant trends.
Color Coding: Highlights the funding rate with distinct colors (bullish and bearish), making it easier to interpret market conditions at a glance.
In the example below, the indicator effectively differentiates between bullish and bearish funding rates, aiding traders in making informed decisions based on current market dynamics.
Application
Market Analysis: Enables traders to analyze the impact of funding rates on market trends, facilitating more strategic decision-making.
Trend Identification: Assists in identifying potential market reversals by monitoring shifts in funding rates.
Customizable Settings: Provides extensive input settings for exchange selection, MA length, and candle coloring, allowing for personalized analysis.
The Funding Rate Indicator by is a powerful addition to any trader's toolkit, offering detailed insights into funding rates across multiple exchanges to navigate the cryptocurrency market effectively.
Rate of Change Suite [QuantraSystems]Rate of Change Suite
Introduction
The "Rate of Change Suite" (𝓡𝓸𝓒 𝓢𝓾𝓲𝓽𝓮) refines traditional RoC concepts by incorporating additional elements that provide more nuanced views of market trends, potential reversions, and momentum shifts.
Its main benefits are that it allows traders to detect momentum changes and frontrun trend shifts.
The suite is designed to be highly adaptable, catering to various trading styles, timeframes and market conditions. It is comprised of 3 metrics:
The RoC base line plots the rate of change, the Signal Histogram to confirm trends, and the Signal Confirmation Oscillator to inform reversal probabilities. For the early detection of trend shifts, the 𝓡𝓸𝓒 𝓢𝓾𝓲𝓽𝓮 is a comprehensive tool for the toolkit of modern traders.
A core component of the 𝓡𝓸𝓒 𝓢𝓾𝓲𝓽𝓮 is the ability to apply its processing techniques to any other indicator found on TradingView - essentially leveraging the signal power of existing analysis methods. This is achieved by modifying the ‘Source’ input.
Legend
𝓡𝓸𝓒 base line: The primary component of the suite, the RoC Line, offers a direct view of market momentum. An upward trending RoC line informs the potential for a long position, while a downward trend might signal the opportunity for a short position. Both include a secondary confirmation by the color change of the line itself. The Heikin Ashi transformed version of the RoC line provides greater resistance to rapid movements, or outliers.
Signal Histogram: This feature works in tandem with the base RoC Line, providing an additional third confirmation of trends. A rising histogram supports the presence of an upward trend. Conversely, a declining histogram aligns with downward trends.
Signal Confirmation Oscillator: This dotted-line is crucial for detecting peaks or troughs in market momentum: These can precede reversals or shifts in the prevailing trend. Traders can use this signal to anticipate and prepare for potential changes quicker than others.
Case Study
Primarily a tool to follow trends, the 𝓡𝓸𝓒 𝓢𝓾𝓲𝓽𝓮 implies much more – you can trade with a confirmed trend signal entry and a mean reversion signal for the exit:
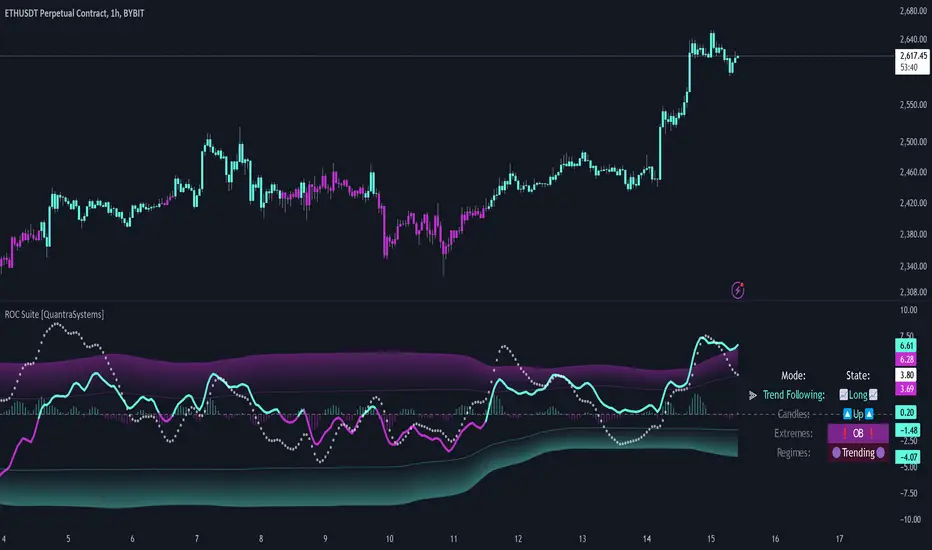
Here we see two practical cases of the 𝓡𝓸𝓒 𝓢𝓾𝓲𝓽𝓮 on the 1h BTC chart.
In the first scenario, the trader waits for three confirmations from the indicator.
The 𝓡𝓸𝓒 baseline to lead the run and looks for confirmation two and three:
𝓡𝓸𝓒 base line color shifts
and the Signal Histogram follows past the null midline.
The trader has adjusted their risk beforehand and enters the long position.
The 𝓡𝓸𝓒 𝓢𝓾𝓲𝓽𝓮 shows traders when to take profit:
The Signal Confirmation Oscillator (SCO, dotted line) moves beyond the 𝓡𝓸𝓒 baseline and the Signal Histogram. The trader can take 50% of the profit already.
The trader waits patiently, and if the SCO reverses, the rest of the position is closed.
The same works inversely for the second trade, which successfully frontran the decline shortly after.
Recommended Settings
Day Trading (1H chart)
Length: 30
Smooth Length: 10
Display Variant: Classic
Choose Mode: Trend Following
Investing – Follow Trend (1D chart)
Default settings
Notes
Quantra Standard Value Contents:
The Heikin-Ashi (HA) candle visualization smoothes out the signal line to provide more informative insights into momentum and trends. This allows earlier entries and exits by observing the indicator values transformed by the HA.
Various visualization options are available to adjust the indicator to the user’s preference: Aside from HA, a classic line, or a hybrid of both.
A special feature of Quantra’s indicators is that they are probabilistically built - therefore they work well as confluence and can easily be stacked to increase signal accuracy.
To add to Quantra's indicators’ utility we have added the option to change the price bars’ colors based on different signals:
Choose Mode for Coloring
Trend Following (Indicator above mid line counts as uptrend, below is downtrend)
Extremes (Everything beyond the SD bands is highlighted to signal mean reversion)
Candles (Color of HA candles as barcolor)
Reversions (Only for HA) (Reversion Signals via the triangles if HA candles change trend while beyond the SD bands, high probability entries/exits)
Divergence Sensitivity: Quantra’s 𝓡𝓸𝓒 𝓢𝓾𝓲𝓽𝓮 is finely tuned to detect divergences, a key feature for identifying possible trend reversals.
Trend Following and Reversions: Primarily a tool for trend following, the 𝓡𝓸𝓒 𝓢𝓾𝓲𝓽𝓮 is also adept at spotting potential reversions and slowdowns in momentum.
Range Trading Compatibility: In its Heikin Ashi Candles mode, the suite becomes particularly effective for range trading strategies.
High Customizability: Traders can customize the suite with various visualization options, including classic line representation, HA transformation, and bar coloring. These can be based on Heikin Ashi Candles or Trend Following approaches, providing flexibility to adapt to different trading scenarios.
Methodology
The 𝓡𝓸𝓒 𝓢𝓾𝓲𝓽𝓮 is built on a foundation of functions that define and calculate the Rate of Change. They employ a variety of moving average types (SMA, EMA, DEMA, TEMA, WMA, etc.) which can be selected to optimize the RoC line.
A bespoke function to calculate Heikin-Ashi values is engineered to offer a more consistent view of the trend.
The Signal Histogram is derived by mathematically processing the base RoC signal. The Signal Confirmation Oscillator is based on a modified formula, adjusted to align with the RoC dynamics.
With a range of customization options for its visual presentation, including color schemes and display styles, the 𝓡𝓸𝓒 𝓢𝓾𝓲𝓽𝓮 is designed to cater to both trend following indications as well as finding signals for mean reversion trades. This multifaceted approach enables the 𝓡𝓸𝓒 𝓢𝓾𝓲𝓽𝓮 to allow the trader to combine signals of both types to de-risk his positions.
MADI(Moving average deviation rate index)This script is "Moving average deviation rate" to Indexing.
index = average deviation rate / (Sigma * (input:SIgma)) * 100
It's for people who like simplicity.

Broadview Delta (ROC)The Broadview Delta (ROC) is a trading indicator designed to provide insights into significant price changes in financial markets. ROC stands for Rate of Change, and it measures the percentage difference between the current price and a price from a specific number of periods ago. The Broadview Delta takes the concept of ROC a step further by incorporating bands of significance based on the highest and lowest price values within a defined time window. This allows traders to identify significant changes in price that are directly correlated with recent highs and lows.
The ROC indicator is widely used by traders and investors to assess the momentum and strength of price movements. It is particularly helpful in identifying potential trend reversals, overbought or oversold conditions, and divergences between price and momentum. By comparing the current price to a historical price point, ROC provides a normalized measurement of price change, enabling traders to gauge the speed and magnitude of market movements.
The Broadview Delta builds upon the traditional ROC by setting bands of significance based on recent highs and lows. These bands provide a contextual reference point for evaluating the significance of price changes. When the current price exceeds a significant upper band, it suggests a potential overbought condition, indicating that the price may be due for a correction. Conversely, if the current price falls below a significant lower band, it signals a potential oversold condition, implying that the price may be primed for a rebound. The bands of significance allow traders to identify crucial price levels where significant market reactions are likely to occur.
By mapping significant changes in price in relation to recent highs and lows, the Broadview Delta offers traders a clearer picture of market dynamics. It helps traders identify critical inflection points where price action is likely to encounter resistance or support. This information empowers traders to make informed decisions about entering or exiting trades, setting profit targets, and placing stop-loss orders.
The Broadview Delta indicator can be applied to various financial instruments, such as stocks, commodities, currencies, and indices. It can be used on different timeframes, ranging from intraday charts to longer-term charts, depending on the trader's preferred trading style and objectives.
The Broadview Delta (ROC) is a powerful trading indicator that combines the principles of the Rate of Change with bands of significance based on recent highs and lows. By providing a direct correlation between significant price changes and recent price extremes, it enhances the ability of traders to identify crucial market turning points. Incorporating the Broadview Delta into trading strategies can improve decision-making, increase the accuracy of trade entries and exits, and ultimately contribute to more profitable trading outcomes.

Global Unemployment RateThe Global Unemployment rate estimates what is the rate of unemployment of the whole world, taking same data from multiple countries and normalizing them.
It includes the Eurozone + 19 countries from all the continents, which are some of the richest countries as well as some of the most populous.
It sadly does not include India as its unemployment data on trading view as of today (Feb 2023) is only since year 2019, which is too short

Fed Funds Rate ProjectionsThis script makes projections via drawing boxes based upon changes in the fed funds rate (FRED:EFFR).
It works by turning the change in the fed funds rate into a user defined percentage (using a multiplier, by default a 1% rate of change implies a 10% change in the chart) and then drawing a box that distance away depending on the direction of the rate of change.
The size of the multiplier should depend on the duration of the asset which this is being applied to, for example, a long duration asset such as a high beta growth stock should use a larger multiplier.

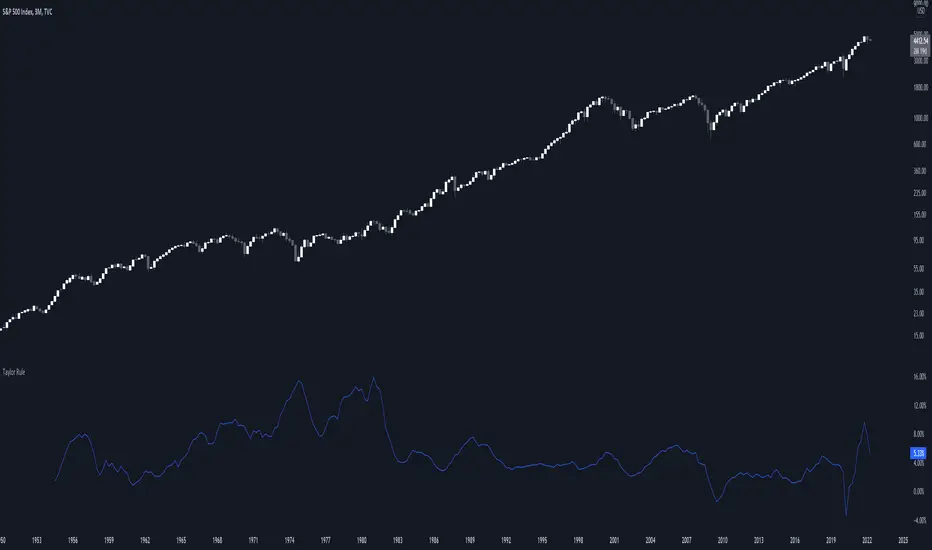
Taylor RuleThe Taylor rule is a simple formula that John Taylor devised to guide policymakers. It calculates what the federal funds rate should be, as a function of the output gap and current inflation. Here, we measure the output gap as the difference between potential output and real GDP. Inflation is measured by changes in the CPI, and we use a target inflation rate of 2%. We also assume a steady-state real interest rate of 2%.
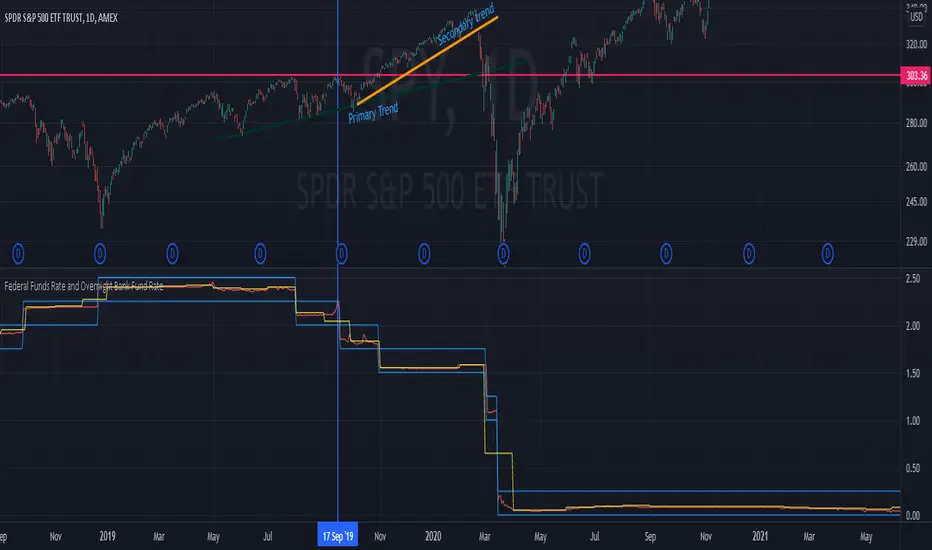
Federal Funds Rate and Overnight Bank Fund RateAMEX:SPY
Comparison of the Overnight Bank Fund Rate and the Effective Federal Funds Rate.
The Fed sets a discount rate of 100 basis points above the effective federal funds rate to discourage ("penalize") banks from borrowing from its reserves. If lending banks have excess in their reserves, the borrowing banks have ease in negotiating a lower rate overnight to maintain its requirements. For this reason its a good indicator of the economy. If it becomes more difficult for banks to maintain the required reserve amount they may charge borrowing banks higher rates.
Both the Effective Federal Funds Rate and Overnight Bank Fund Rate use the same data. Except, the OBFR includes overnight Eurodollar transaction data and certain overnight “selected deposit” transactions that are placed at domestic bank branches controlled by a U.S. banking office.
The indicator includes the lower and upper bound target rate set by the Federal Reserve.
An interesting note:
Notice the jump in the Overnight Bank Rate followed by Fed buying to provide liquidity and lower rates in Sept 2019.
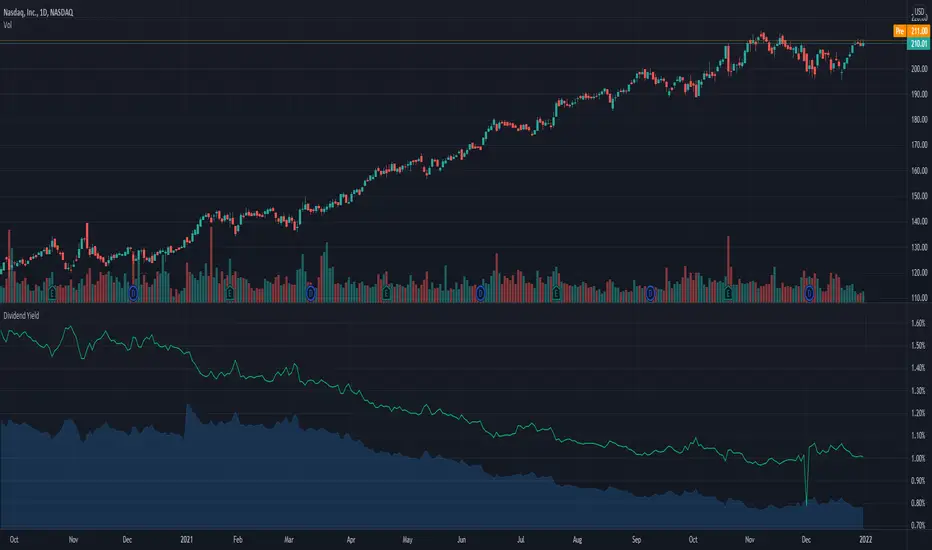
Dividend Yield & Dividend Growth Rate (Most Accurate)In this indicator it shows the dividend yield in green line and dividend growth rate in blue area.
Currently our dividend yield calculation is the most accurate in TradingView.
Dividend growth rate is the annualized percentage growth rate experienced by dividends of a given stock over 5 years period of time.
Many established companies have sought to regularly increase dividends paid to investors.
Silen's Financials P/E & P/S[x10] RatesThis script aims to give a better visualization of P/E and P/S rates compared to the build-in "Price to earnings ratio" and "Price to sales ratio" in the "Financials" Section of Tradingview. For those of you don't know, those rates compare earnings and sales with your share price in regard to market cap and outstanding shares.
The scripts differs to the build-in versions in the following points:
- P/E & P/S rates are combined in one indicator
- Negative P/E rates are displayed better: Positive P/E rates are green, Negative P/E rates are red
- For visualization reasons, the indicator will cap positive and negative P/E rates at 100. (P/E rates above those levels are not siginificant either way)
- P/E & P/S rate are directly displayed on the graph
- Both P/E and P/S rates are combined on one left scale
- For visualization reasons, P/S rate is showing 10x the actual P/S rate. Using the standard P/S rate would result in hard-to-recognize changes of the P/S line.
To sum up:
- Positive P/E rates are green
- Negative P/E rate are red
- P/S rates are multiplied by 1 0
- P/S rates are yellow
How to use P/E and P/S rates:
The US market average for P/E rates is roughly ~18 in the US right now (10/2022) while the market average for P/S rates is roughly ~3 in the US. Note that average P/E and P/S can change when the market situation changes.
P/E and P/S rates help you value your stock better and help you decide whether your stock is undervalued or overvalued compared to the market or the industry when it comes to earnings and sales. If you compare to Market averages, a positive P/E of less than 18 means that your stock is likely unvervalued. A P/S rate below 3 (30 in the chart!) means that your stock is likely undervalued as well. If your stock shows rates above those, it is likely that it is overvalued compared to market averages.
Please note that P/E and P/S rates are not the only factors that make up a stock valuation. Valuations are complex and subjective.
A positive P/E rate also means that your company is profitable.
A Negative P/E rate means that your company is unprofitable.
If you have any questions or feedback let me know!
Disclaimer: This script doesn't show the actual P/S rate. It shows the P/S rate multiplied by 10, due to visualization issues. Positive P/E Rates above 100 are displayed as 100. Positive P/E rates are green, Negative P/E rates are red and multiplied by -1.
Disclaimer2: @Tradingview_Team: I couldn't find the right category for this script but categories are mandatory. I assume that "Breadth Indicators" is still the closest there is. Please let me know if you want me to change the category.
Disclaimer3: For visualization, the opacity of the displayed image is 70%. The standard opacity for the P/E and P/S lines is 50% and can be changed in the indicator settings. I found this setting more useful when working together with other indicators on the same chart
Disclaimer4: Earnings Per Share, Total Revenue used are TTM. Total Shares Outstanding used are FQ.

Extremely high win rate FOREX swing strategyTHis is a very simple yet extremely efficient FOREX strategy .
In general it tends to work the best against NZD and AUD pairs, however other major pairs and crosses can work as well.
It's made of a time management, together with MACD , moving average , a price action rule and a risk management.
THe logic behind is the next one :
For LONG:
We have 3 ascending candles.
Histogram of MACD is positive.
Last close of a candle is was above moving average.
If all those previous condition happened before 17/18 UTC time depending if its summer time or not, we enter the trade.
For Short:
We have 3 descending candles.
Histogram of MACD is negative.
Last close of a candle is was below moving average.
If all those previous condition happened before 17/18 UTC time depending if its summer time or not, we enter the trade.
RIsk management
For risk management, since we aim to have a 95%+ win rate, we aim to have a 5:1 or 10:1 risk to reward ratio. Meaning that for each $ we can win, we can lose 5-10$.
THats why I recommend to be extremely careful when playing with leverage with this strategy.

% Divergence of RSIA simple script that plots the difference between the %ROC of price vs the %ROC of RSI, AKA the % of divergence. A simple way to analyze how strong a potential divergence is. Top reversals are above 0, bottom reversals are below. A value of 0 means price and RSI are changing by the same % value. So, if oscillator is moving up as price moves up, it means divergence is increasing. If oscillator moves down as price moves up, it means divergence is decreasing.

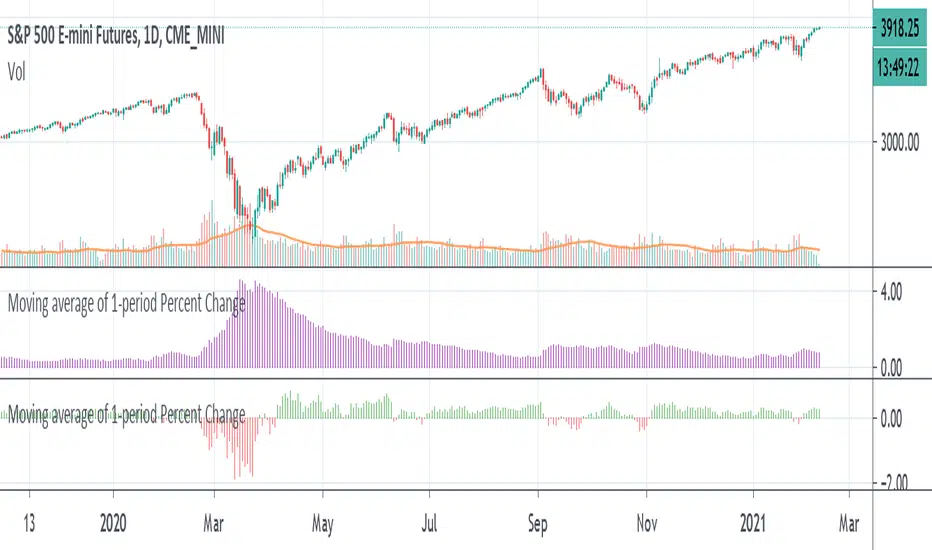
Moving average of 1-period Percent ChangeAnother way of finding the average range of the bars using 1 period percentage change of the price and taking an average of them. It's given in percentages and the absolute value of the average can be shown when the option is turned on, or the average including the up and down bars can be shown. Perhaps an alternative way of looking at volatility or range of the bars. If you prefer a line version over histogram, just simply change the style under the settings of the indicator.
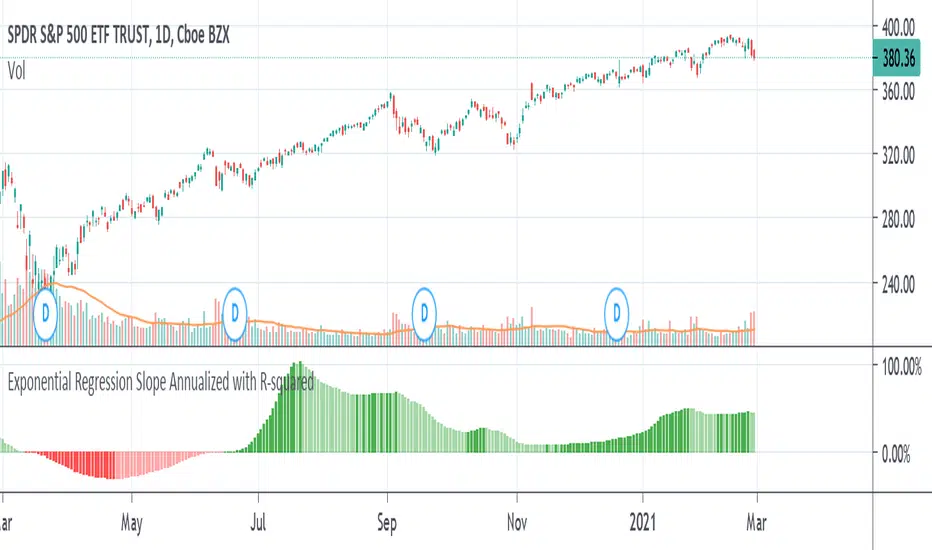
Exponential Regression Slope Annualized with R-squared HistogramMy other indicator shows the linear regression slope of the source. This one finds the exponential regression slope and optionally multiplies it by R-squared and optionally annualizes it. Multiplying by R-squared makes sure that the price movement was significant in order to avoid volatile movements that can throw off the slope value. Annualizing the exponential slope will let you see how much percentage you will make in a year if the price continues at its current pace.
The annualized number is the number of trading days in a year. This and the length might need adjusting for the extra bars that might be in futures or other markets. The number does not have to be a year. For example, it can be a month if you set the number to 20 or so trading days to find how much you would make in a month if price continues at its current pace, etc. This can also be used as an alternative to relative strength or rate of change.

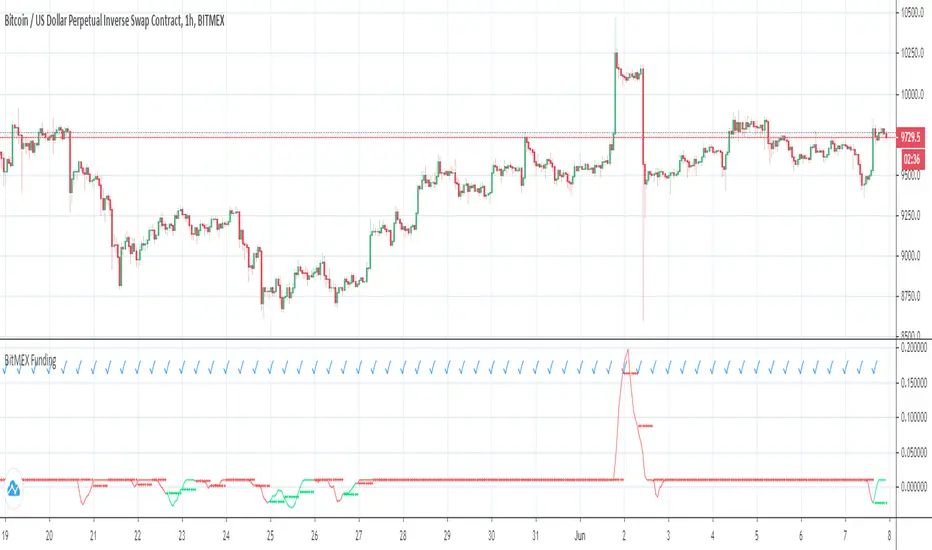
BitMEX Funding Rate CalculationThis script implements the full funding rate formulas found on the BitMEX site for XBTUSD, ETHUSD, and XRPUSD. It uses the 1-min premium and interest tickers found here on TradingView to calculate an 8-hour TWAP, then uses base initial and maintenance margins to apply caps on absolute rate and delta from prior value. Caps are applicable only to position sizes below 200 XBT. When chart history exceeds the available history of 1min date on TradingView, the indicator switches to 1hr data to provide estimates.
Outputs:
Either a check (using 1min data) or a question mark (using 1hr data) upon each new funding period.
Current funding rate, every 8 hours.
Current funding prediction for the next funding period.
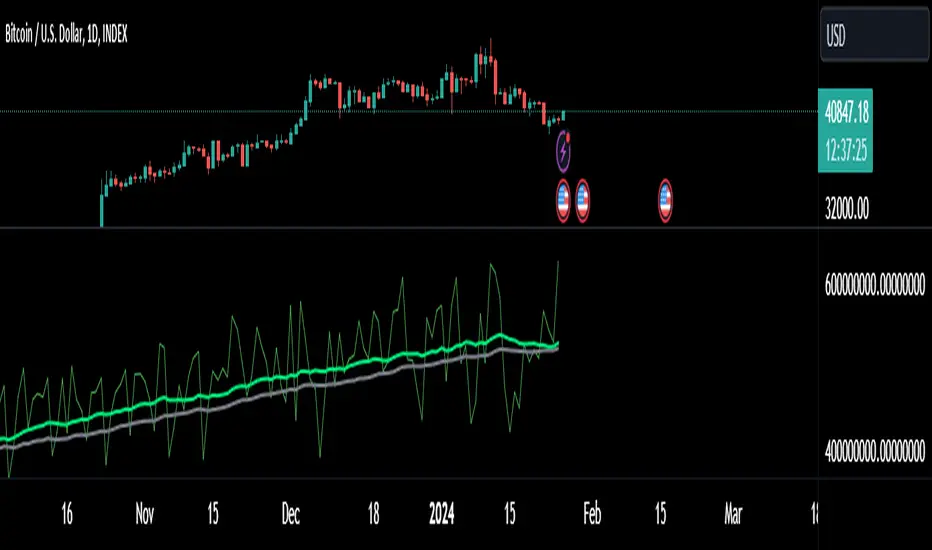
Hash Ribbons Backtest - Bitcoin Beats YT
Hello Hello Hello and welcome back to Bitcoin Beats!
This is a script written by capriole_charles
Go check out the original!
I have added leverage and stoploss % but also made it a strategy so we can look back at past trades to see patterns and profit.
Personally I feel this is not enough data to trade off as BTC is such a young asset. However I have seen other models similar to this for other assets that hold strong.
Trade safe!
Good bye from bitcoin beats!
Not Meant For The 1H! My Bad! higher timeframes are better!
The "Spring" is the confirmed Miner capitulation period:
The 1st "gray" circle is the start of Capitulation (1 month Hash Rate crosses UNDER 2 month Hash Rate)
Last "green" circle is the end of Capitulation (1 month Hash Rate crosses OVER 2 month Hash Rate)
The "greener" the spring gets (up until blue) represents Hash Rate recovery (it is increasing)
The "blue" circle is the first instance of positive momentum following recovery of Hash Rate (1m HR > 2m HR). This is historically a rewarding place to buy with limited downside.
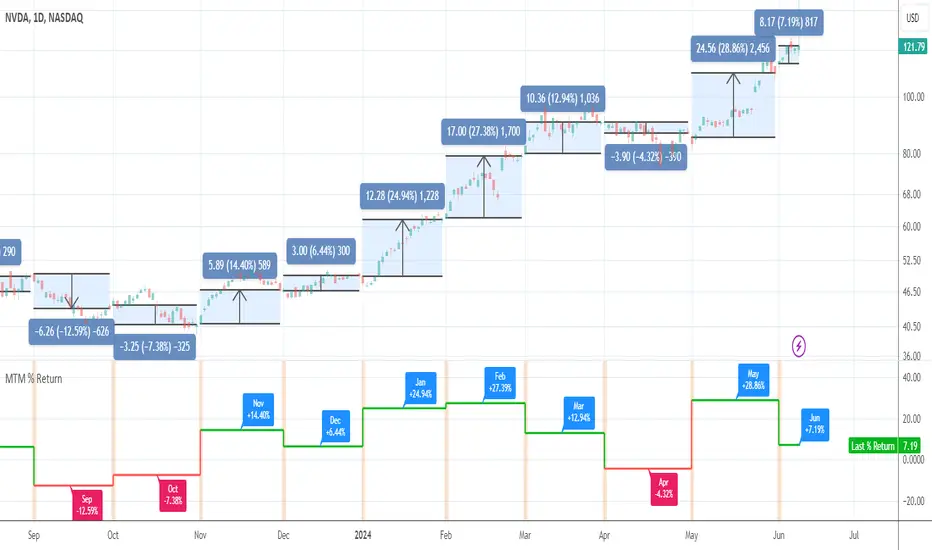
Month-to-Month % ReturnAn utility tool to see month-to-month performance of the asset and to eliminate the need in drawings. It works everywhere but better in use on the daily timeframe.
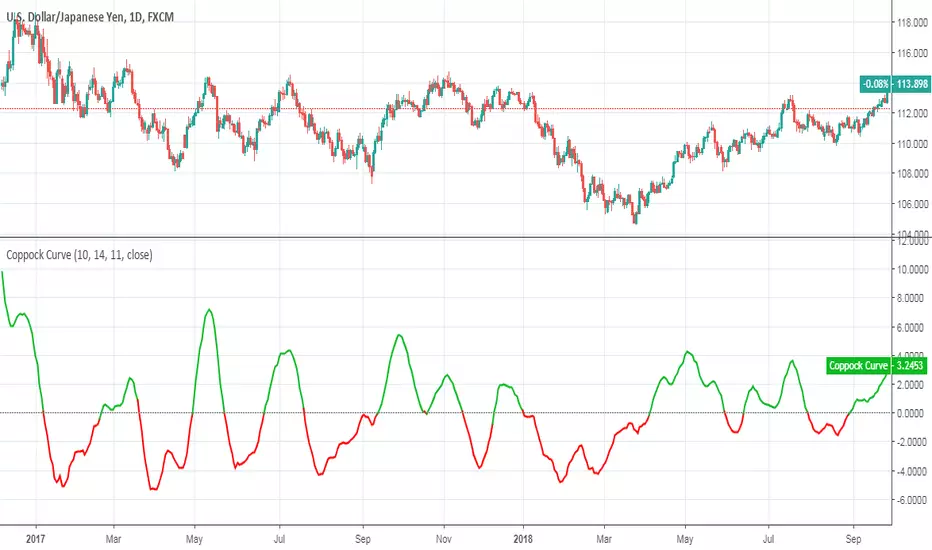
Coppock CurveThis indicator was originally developed by Edwin "Sedge" Coppock (Barron's Magazine, October 1962).
Specially for @AlexMayorov :
1) Buy when indicator crosses the zero line upside
2) Sell when indicator crosses the zero line downside