ICMCBased on basic Nimblr TA, Momentum Candles combined with Breakout/Breakdown can detect a change in trend direction.
Nimblr mainly categorizes candlesticks into Momentum (Body > 50%) and Indecision (Body < 50%) candlesticks.
⁕ shows Momentum Candles, others are Indecision Candles
↑ shows Breakout
↓ shows Breakdown
Yellow lines show the current Indecision candle and white lines the past Indecision candle.
Priceflow

Trend Stability (Expo)
Trend Stability (Expo) is a multifunctional trend trading tool that identifies all aspects of trend trading. The indicator helps traders to stay on the right side of the market, identify retracements, reversals, and trend strength. In addition to that, we have added momentum - moves for traders that want to do trend scalping. The candle coloring displays the current trend and gives early signs of trend reversals and retracements.
➤ All in one trading tool that filters out noise and leaves us with insights that matter.
Real-Time with Alerts
No Repainting
Works on any market and in any timeframe
HOW TO USE
Use the indicator to gain insights into all aspects of trend trading:
Trend Stability/equilibrium
Trend Strength
Trend Retracements
Trend Reversals
Trend Filter
Momentum Moves
INDICATOR IN ACTION
4-hour chart
The setting used on the chart below displays negative momentum-moves with a noise-free positive trend.
I hope you find this indicator useful , and please comment or contact me if you like the script or have any questions/suggestions for future improvements. Thanks!
I will continually work on this indicator, so please share your experience and feedback as it will enable me to make even better improvements. Thanks to everyone that has already contacted me regarding my scripts. Your feedback is valuable for future developments!
-----------------
Disclaimer
Copyright by Zeiierman.
The information contained in my scripts/indicators/ideas does not constitute financial advice or a solicitation to buy or sell any securities of any type. I will not accept liability for any loss or damage, including without limitation any loss of profit, which may arise directly or indirectly from the use of or reliance on such information.
All investments involve risk, and the past performance of a security, industry, sector, market, financial product, trading strategy, or individual’s trading does not guarantee future results or returns. Investors are fully responsible for any investment decisions they make. Such decisions should be based solely on an evaluation of their financial circumstances, investment objectives, risk tolerance, and liquidity needs.
My scripts/indicators/strategies/ideas are only for educational purposes!
ACCESS THE INDICATOR
• Contact me on TradingView or use the links below

Angle & Price FlowThis is a simple end of the day indicator based on open and close values.
Angles:
Identifying narrow angles helps to find breakouts
Maximum angle = High chance of reversal
Minimum angle = Chance of breakouts on the next day or upcoming days.
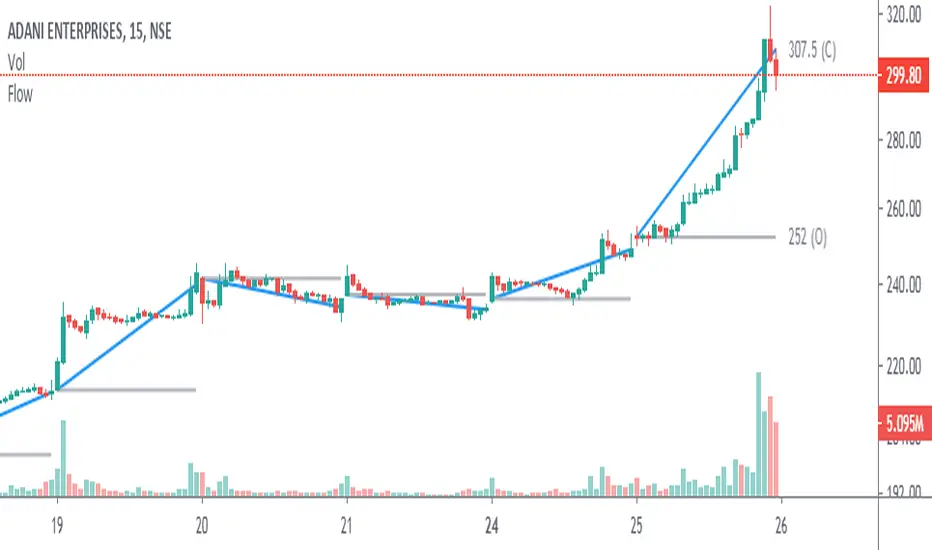
Price Flow:
I personally use price flow to simplify the flow of candlestick chart and to identify breakouts using rounding bottoms and rounding top patterns, sharp corners for reversals.
Features:
Multi time frame
Labels
Hide previous period
Combine it with other indicators for better result.
Angle & Price FlowThis is a simple end of the day indicator based on open and close values.
Angles:
Identifying narrow angles helps to find breakouts
Maximum angle = High chance of reversal
Minimum angle = Chance of breakouts on the next day or upcoming days.
Price Flow:
I personally use price flow to simplify the flow of candlestick chart and to identify breakouts using rounding bottoms and rounding top patterns, sharp corners for reversals.
Features:
Multi time frame
Labels
Hide previous period
Combine it with other indicators for better result.

The Center..some measure of “center” or average price is useful.
- Adam H. Grimes
This line off Adams blog inspired me to cook up a very simple indicator that just takes the High and Low of the time given (input in minutes), adds them together and divides it in half. This way we get a center based on the higher timeframe. Not only does it inform you of the dominating trend, but also works as a sort of momentum indicator if you measure the distance price is from the center.
Got the daily high/low calculations off www.tradingview.com
