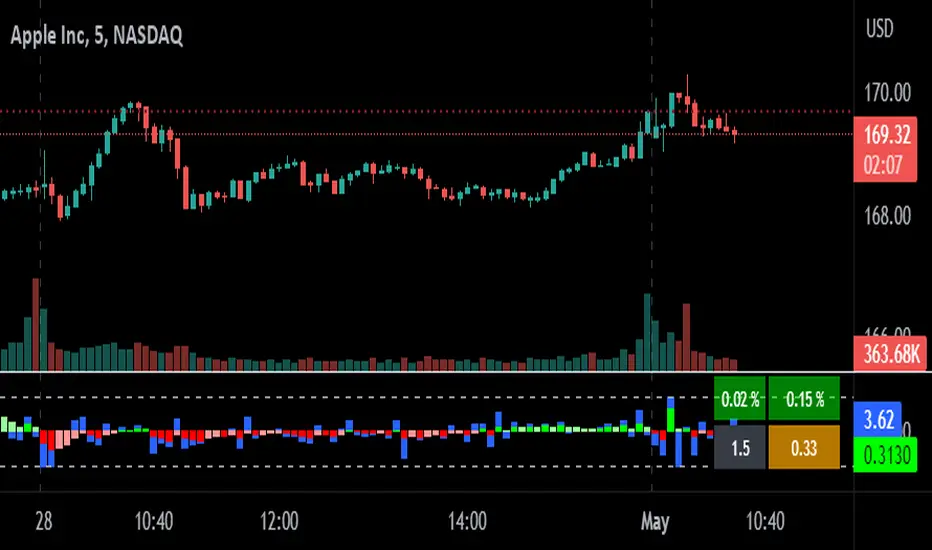
relative performanceThis indicator is built to mesure the performance of a stock vs the index of choice. it is best use for the intraday session because it doesn't take gap into account when doing the calculation. This is how i made my math (using AAPL compared to SPY for simplicity)
(change AAPL / ATR AAPL) - (change SPY / ATR SPY) * beta factor * volume factor
change is calculated open to close for each candle instead of close to close. this is why gap does not affect the calculation
blue columns is an instant snap shot of the RP
red and green columns is the moving average of the blue columns
limit is the max value for the blue line when ploting them on the chart but doesn't affect the calculation
option:
indice: default with SPY but could use any stock
moving average choice: let you choose between EMA or SMA green and red columns
rolling average length : number of bar for the moving average
I made an auto adjust for the 5 min chart and the 2 min chart so you can swithc between both chart and have the same average (default value set to 6x 5min and 15x 2 min, giving you the average of the last 30min)
volume weighing let you choose if you want a volume factor or not. volume factor is only going to multiplie the result of the price move. it cannot move it from positive to negative.
this is the calculation
(volume AAPL / volume SMA AAPL) / (volume SPY / volume sma SPY)
meaning that a higher volume on the thicker compared to it's sma while having a lower volume on SPY will give you a big relative performance.
you can choose the number of bar in the average for the volume.
BETA factor work the same way that the volume factor does. you got to manualy enter your beta. default is set to 1.5
table
top line : blue square is you RP value (same has the blue columns bar) and your reference thicker
middle line : pourcentage move from the open (9:30 open) for your stock on the left and the reference on the right
bottom line : beta on the left and volume factor on the right
feel free to ask question or give modification idea!
Performance
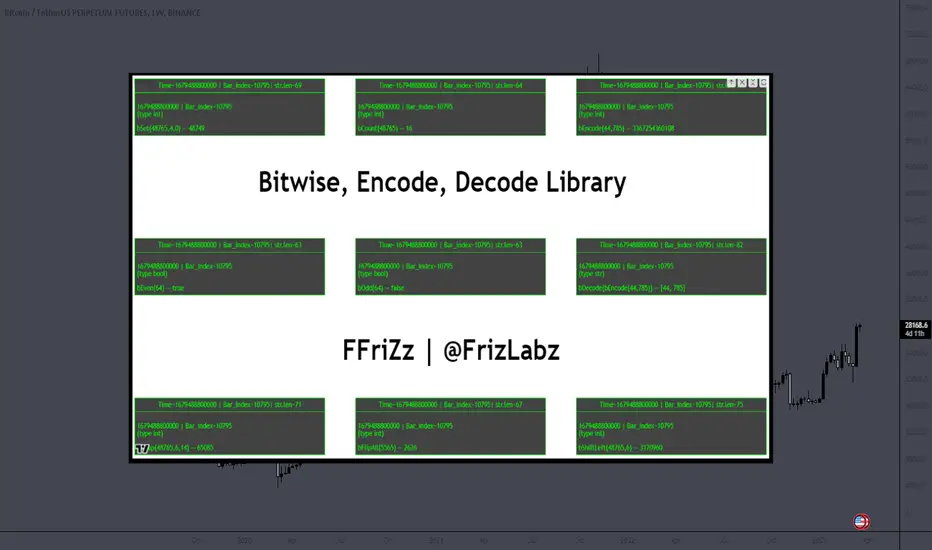
Bitwise, Encode, DecodeLibrary "Bitwise, Encode, Decode"
Bitwise, Encode, Decode, and more Library
docs()
Hover-Over Documentation for inside Text Editor
bAnd(a, b)
Returns the bitwise AND of two integers
Parameters:
a : `int` - The first integer
b : `int` - The second integer
Returns: `int` - The bitwise AND of the two integers
bOr(a, b)
Performs a bitwise OR operation on two integers.
Parameters:
a : `int` - The first integer.
b : `int` - The second integer.
Returns: `int` - The result of the bitwise OR operation.
bXor(a, b)
Performs a bitwise Xor operation on two integers.
Parameters:
a : `int` - The first integer.
b : `int` - The second integer.
Returns: `int` - The result of the bitwise Xor operation.
bNot(n)
Performs a bitwise NOT operation on an integer.
Parameters:
n : `int` - The integer to perform the bitwise NOT operation on.
Returns: `int` - The result of the bitwise NOT operation.
bShiftLeft(n, step)
Performs a bitwise left shift operation on an integer.
Parameters:
n : `int` - The integer to perform the bitwise left shift operation on.
step : `int` - The number of positions to shift the bits to the left.
Returns: `int` - The result of the bitwise left shift operation.
bShiftRight(n, step)
Performs a bitwise right shift operation on an integer.
Parameters:
n : `int` - The integer to perform the bitwise right shift operation on.
step : `int` - The number of bits to shift by.
Returns: `int` - The result of the bitwise right shift operation.
bRotateLeft(n, step)
Performs a bitwise right shift operation on an integer.
Parameters:
n : `int` - The int to perform the bitwise Left rotation on the bits.
step : `int` - The number of bits to shift by.
Returns: `int`- The result of the bitwise right shift operation.
bRotateRight(n, step)
Performs a bitwise right shift operation on an integer.
Parameters:
n : `int` - The int to perform the bitwise Right rotation on the bits.
step : `int` - The number of bits to shift by.
Returns: `int` - The result of the bitwise right shift operation.
bSetCheck(n, pos)
Checks if the bit at the given position is set to 1.
Parameters:
n : `int` - The integer to check.
pos : `int` - The position of the bit to check.
Returns: `bool` - True if the bit is set to 1, False otherwise.
bClear(n, pos)
Clears a particular bit of an integer (changes from 1 to 0) passes if bit at pos is 0.
Parameters:
n : `int` - The integer to clear a bit from.
pos : `int` - The zero-based index of the bit to clear.
Returns: `int` - The result of clearing the specified bit.
bFlip0s(n)
Flips all 0 bits in the number to 1.
Parameters:
n : `int` - The integer to flip the bits of.
Returns: `int` - The result of flipping all 0 bits in the number.
bFlip1s(n)
Flips all 1 bits in the number to 0.
Parameters:
n : `int` - The integer to flip the bits of.
Returns: `int` - The result of flipping all 1 bits in the number.
bFlipAll(n)
Flips all bits in the number.
Parameters:
n : `int` - The integer to flip the bits of.
Returns: `int` - The result of flipping all bits in the number.
bSet(n, pos, newBit)
Changes the value of the bit at the given position.
Parameters:
n : `int` - The integer to modify.
pos : `int` - The position of the bit to change.
newBit : `int` - na = flips bit at pos reguardless 1 or 0 | The new value of the bit (0 or 1).
Returns: `int` - The modified integer.
changeDigit(n, pos, newDigit)
Changes the value of the digit at the given position.
Parameters:
n : `int` - The integer to modify.
pos : `int` - The position of the digit to change.
newDigit : `int` - The new value of the digit (0-9).
Returns: `int` - The modified integer.
bSwap(n, i, j)
Switch the position of 2 bits of an int
Parameters:
n : `int` - int to manipulate
i : `int` - bit pos to switch with j
j : `int` - bit pos to switch with i
Returns: `int` - new int with bits switched
bPalindrome(n)
Checks to see if the binary form is a Palindrome (reads the same left to right and vice versa)
Parameters:
n : `int` - int to check
Returns: `bool` - result of check
bEven(n)
Checks if n is Even
Parameters:
n : `int` - The integer to check.
Returns: `bool` - result.
bOdd(n)
checks if n is Even if not even Odd
Parameters:
n : `int` - The integer to check.
Returns: `bool` - result.
bPowerOfTwo(n)
Checks if n is a Power of 2.
Parameters:
n : `int` - number to check.
Returns: `bool` - result.
bCount(n, to_count)
Counts the number of bits that are equal to 1 in an integer.
Parameters:
n : `int` - The integer to count the bits in.
to_count `string` - the bits to count
Returns: `int` - The number of bits that are equal to 1 in n.
GCD(a, b)
Finds the greatest common divisor (GCD) of two numbers.
Parameters:
a : `int` - The first number.
b : `int` - The second number.
Returns: `int` - The GCD of a and b.
LCM(a, b)
Finds the least common multiple (LCM) of two integers.
Parameters:
a : `int` - The first integer.
b : `int` - The second integer.
Returns: `int` - The LCM of a and b.
aLCM(nums)
Finds the LCM of an array of integers.
Parameters:
nums : `int ` - The list of integers.
Returns: `int` - The LCM of the integers in nums.
adjustedLCM(nums, LCM)
adjust an array of integers to Least Common Multiple (LCM)
Parameters:
nums : `int ` - The first integer
LCM : `int` - The second integer
Returns: `int ` - array of ints with LCM
charAt(str, pos)
gets a Char at a given position.
Parameters:
str : `string` - string to pull char from.
pos : `int` - pos to get char from string (left to right index).
Returns: `string` - char from pos of string or "" if pos is not within index range
decimalToBinary(num)
Converts a decimal number to binary
Parameters:
num : `int` - The decimal number to convert to binary
Returns: `string` - The binary representation of the decimal number
decimalToBinary(num, to_binary_int)
Converts a decimal number to binary
Parameters:
num : `int` - The decimal number to convert to binary
to_binary_int : `bool` - bool to convert to int or to string (true for int, false for string)
Returns: `string` - The binary representation of the decimal number
binaryToDecimal(binary)
Converts a binary number to decimal
Parameters:
binary : `string` - The binary number to convert to decimal
Returns: `int` - The decimal representation of the binary number
decimal_len(n)
way of finding decimal length using arithmetic
Parameters:
n `float` - floating decimal point to get length of.
Returns: `int` - number of decimal places
int_len(n)
way of finding number length using arithmetic
Parameters:
n : `int`- value to find length of number
Returns: `int` - lenth of nunber i.e. 23 == 2
float_decimal_to_whole(n)
Converts a float decimal number to an integer `0.365 to 365`.
Parameters:
n : `string` - The decimal number represented as a string.
Returns: `int` - The integer obtained by removing the decimal point and leading zeroes from s.
fractional_part(x)
Returns the fractional part of a float.
Parameters:
x : `float` - The float to get the fractional part of.
Returns: `float` - The fractional part of the float.
form_decimal(a, b, zero_fix)
helper to form 2 ints into 1 float seperated by the decimal
Parameters:
a : `int` - a int
b : `int` - b int
zero_fix : `bool` - fix for trailing zeros being truncated when converting to float
Returns: ` ` - float = float decimal of ints | string = string version of b for future use to ref length
bEncode(n1, n2)
Encodes two numbers into one using bit OR. (fastest)
Parameters:
n1 : `int` - The first number to Encodes.
n2 : `int` - The second number to Encodes.
Returns: `int` - The result of combining the two numbers using bit OR.
bDecode(n)
Decodes an integer created by the bCombine function.(fastest)
Parameters:
n : `int` - The integer to decode.
Returns: ` ` - A tuple containing the two decoded components of the integer.
Encode(a, b)
Encodes by seperating ints into left and right of decimal float
Parameters:
a : `int` - a int
b : `int` - b int
Returns: `float` - new float of encoded ints one on left of decimal point one on right
Decode(encoded)
Decodes float of 2 ints seperated by decimal point
Parameters:
encoded : `float` - the encoded float value
Returns: ` ` - tuple of the 2 ints from encoded float
encode_heavy(a, b)
Encodes by combining numbers and tracking size in the
decimal of a floating number (slowest)
Parameters:
a : `int` - a int
b : `int` - b int
Returns: `float` - new decimal of encoded ints
decode_heavy(encoded)
Decodes encoded float that tracks size of ints in float decimal
Parameters:
encoded : `float` - encoded float
Returns: ` ` - tuple of decoded ints
decimal of float (slowest)
Parameters:
encoded : `float` - the encoded float value
Returns: ` ` - tuple of the 2 ints from encoded float
Bitwise, Encode, Decode Docs
In the documentation you may notice the word decimal
not used as normal this is because when referring to
binary a decimal number is a number that
can be represented with base 10 numbers 0-9
(the wiki below explains better)
A rule of thumb for the two integers being
encoded it to keep both numbers
less than 65535 this is because anything lower uses 16 bits or less
this will maintain 100% accuracy when decoding
although it is possible to do numbers up to 2147483645 with
this library doesnt seem useful enough
to explain or demonstrate.
The functions provided work within this 32-bit range,
where the highest number is all 1s and
the lowest number is all 0s. These functions were created
to overcome the lack of built-in bitwise functions in Pinescript.
By combining two integers into a single number,
the code can access both values i.e when
indexing only one array index
for a matrices row/column, thus improving execution time.
This technique can be applied to various coding
scenarios to enhance performance.
Bitwise functions are a way to use integers in binary form
that can be used to speed up several different processes
most languages have operators to perform these function such as
`<<, >>, &, ^, |, ~`
en.wikipedia.org
SFC Smart Money BenchmarkA benchmark is a standard or point of reference, which traders can use to measure something else.
This indicator is showing how correlated pairs are performing and what is the current correlation between them.
Features:
- Market performance - daily, weekly, monthly
- Sigma - volatility . It will be coloured in red, if the volatility is bigger than one standard deviation.
-Correlation - Positive correlation will be coloured in green if it is confirmed by the P-value, negative correlation in red.
-Confidence intervals
-Determination
Markets:
- Metal sector
- US Stock Indices
- Major USD Pairs
Market performance
The indicator is plotting a table with the current performance of the particular group, for example the metal sector and all correlated Gold pairs. The table is showing the performance of the pairs based on monthly, weekly and daily bases in the same time. In this case the trader can track all pairs simultaneously and see if there are anomalies between the pairs - SMT Divergence.
For example:
We know that Gold and Silver are very strong correlated pairs. In this case if Gold is going up, but Silver not, probably this move is only current manipulation and the true move is not clear. In that moment the trader can decide not to open an order or take some profit.
With the Sigma value traders also can track the current volatility of the price. The strength of the volatility is measured by the standard deviation.
-1>Sigma<1 - The asset is moving normally
-2>Sigma<-1 or 21 - The asset is volatile
-3>Sigma<-2 or 32 - The asset is very volatile
Correlation
The indicator is showing the current correlation between all pair from the table. The correlation is set to the first pair of the table. In order to make the correlation more accurate the indicator calculates the P-value and the Determination coefficient. The confidence intervals are also displayed in order to show how strong correlation should be expected.
Pearson correlation is a measure of linear correlation between two sets of data. It is the ratio between the covariance of two variables and the product of their standard deviations; thus, it is essentially a normalized measurement of the covariance, such that the result always has a value between −1 and 1. As with covariance itself, the measure can only reflect a linear correlation of variables, and ignores many other types of relationships or correlations.
P-value evaluates how well your data rejects the null hypothesis, which states that there is no relationship between two compared groups. Successfully rejecting this hypothesis tells you that your results may be statistically significant. In academic research, p-value is defined as the probability of obtaining results ‘as extreme’ or ‘more extreme’, given that the null hypothesis is true — essentially, how likely it is that you would receive the results (or more dramatic results) you did assuming that there is no correlation or relationship (e.g. the thing that you’re testing) among the subjects
Coefficient of Determination is just the square of pearson’s correlation coefficient R. This is done as it is easier to explain linear regression in terms of R² than R. As R ranges from -1 to 1, R² would range from 0 to 1 — clearly explaining relationship with 0 being not related and 1 being perfectly related.
The correlation confidence interval is the range in which the population correlation is most likely to be found.
The degree of certainty for which it is likely to be within that range is called the confidence level.
When you collect sample data, you can not know the exact value of the correlation.
Note:
For the Stock indices there is an extra calculation, showing the current market expectations - Fear and Greed Index. The calculated index could differs a bit from the original CNN Fear and Greed indicator, because they calculate the index based on Future markets. This indicator calculate the index based on the market that we trade - indices.
Supported pairs:
-Option Gold - XAUUSD , GDX , Silver , Aluminum, Platinum , Palladium, 30Y US Yields, 10Y US Yields, 2Y US Yields, XAUEUR, XAUGBP, XAUAUD , XAUCAD , XAUCNY , XAUJPY
-Option Others - Table1: SP500 , US30, NAS100 ; Table2: DXY , EURUSD , GBPUSD , AUDUSD

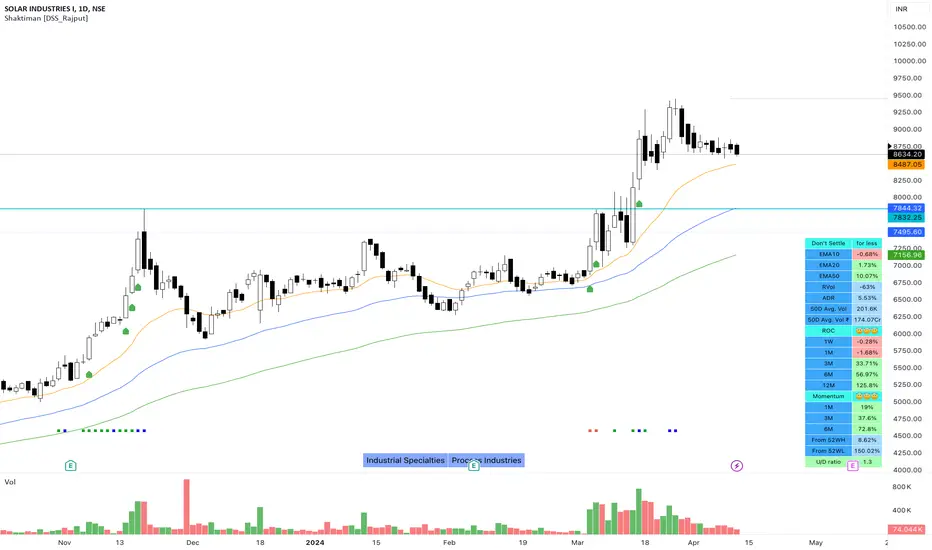
Shaktiman [DSS_Rajput]I'm a Momentum Trader, following the Indian markets, Mark Minervini and William O'Neil follower.
User Settings
Inputs tab
EMA option for Table - It compares the current price of the symbol to its key EMA's and calculates the rate of return to make it easier to track the performance of the symbol. It Helps you to identify how far the price is from its Key EMA's
ADDITIONAL TABLE DATA - It will allow you to use multiple performance data sets with your set of customizable inputs (You can change periods as per your requirements)
Show Inside Bar (IB): Allows you to add Inside Bar on your chart
Show NR4 (Narrow Range): Allows you to add an NR4 bar on your chart
Show INR7(Narrow Range): Allows you to add NR7 Bar on your chart
Distance_From_EMA_Table: Allows you to enable/disable the price difference with its key EMA's table.
ROC_Table: It compares the current price of the symbol to its past price and calculates the rate of return to make it easier to track the performance of the symbol.
Note that the Performance sidebar is not updated in real-time, while this indicator is, so on real-time charts.
The formula of the calculation is (Current value - Past value) * 100 / Past value, where Past value is: 1W, 1M, 3M, 6M, 1Y
Momentum_Table: It compares the current price of the symbol to its past lowest price of that period and calculates the %Gain of the symbol from the low of that period
Power_Play_Candidate: It will show the power play candidate, similar to IBD, It merely qualifies for Power_Play.
You need to wait for the Right Entry point. It will give you 8 Week Range.
According to IBD, it should move 100%+ in less than 8 weeks. You can modify your criteria by changing the percentage gain.
U/D Ratio: IBD defines the U/D ratio as "A 50-day ratio that is derived by dividing total volume on up days by the total volume on down days.
A ratio greater than 1.0 implies positive demand for a stock"
UpVol criteria: close>open and vice versa for DownVol
Rvol (Relative Vol): Percentage volume change (compared to daily average volume)
ADR : It allows you to add the Average Daily Range to the table.
Show 50D Avg. Vol & Avg. Vol rupee: It allows you to add 50-Day Avg. Vol and 50-Day Avg. Vol rupee.
Show_Bull_Snort: Allows you to add bull snort to your chart and style the bar.
Bull Snort is the work of Oliver Kell. For more info about Oliver kell, check youtube videos of Oliver Kell.
Normal Moving Average: Plot 4 Simple, Exponential, and Weighted Moving Averages. (You can choose an option between EMA/SMA/WMA)
Fixed Moving Average : Plot 4 Simple, Exponential, and Weighted Moving Averages. (You can choose an option between EMA/SMA/WMA)
Plus Point: It will not change its value when you switch to a different timeframe. Let's say you applied Fixed Daily 20MA, on the intraday chart.
It will not change its value and It will give you much more clarity that, from where the price is bouncing from 20MA. Explore it (You will definitely love it!)
Fixed Moving Average : Plot 2 Simple, Exponential, and Weighted Moving Averages. (You can choose an option between EMA/SMA/WMA)
Plus Point: It will not change its value when you switch to a different timeframe. (It's like Plotting 10 Week Line on Daily Chart & Intraday Charts)
Numbers of weeks to show High & Low: It will add data to the tables and also add 52 weeks of High & Low lines on the charts.
(Number of weeks is customizable, you can change as per your requirements.)
Style tab
You can modify the style and color of any of the inputs except table color.
Conclusion
If you like this script, click on Add to favorite indicators, so that you can easily add this indicator from your favorites tab right away.
Hope you find this useful. Please leave any questions you have in the comment section and I'll be happy to answer them.
Thanks!
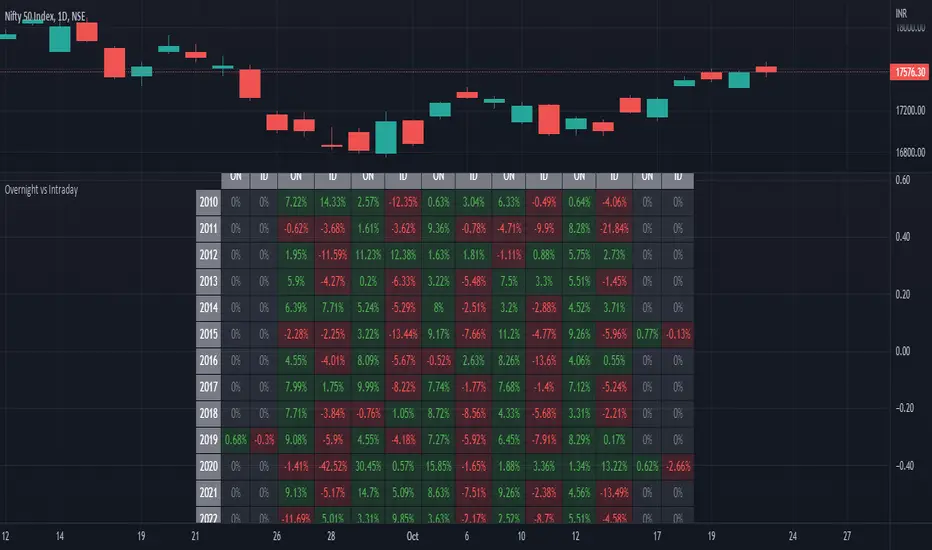
ILM Overnight vs Intraday Performance - Tabular FormUse this indicator on Daily Timeframe
This script compares Overnight vs Intraday Performance based on the Day of the Week (DOW) - Sun - Sat of index/stock/currency/commodity symbols.
ON column indicates Overnight performance = open/close -1
ID column indicates Intraday performance = close-open/1
The calculations are detailed in the tooltips of the individual table cells.
Performance Tablethis scrip is modified of Performance Table () of TradingView user @BeeHolder = Thank u very much.
-
@BeeHolder formula is based on daily basis,
but my calculation is based on respective day, week and month.
-
The formula of the calculation is (Current Close - Previous Close) * 100 / Previous Close, where Past value is:
1D = close 1 day before
5D = close 5 day before
1W - close 1 week before
4W = close 4 week before
1M - close 1 month before
3M - close 3 month before
6M - close 6 month before
12M - close 12 month before
52W - close 52 week before
Also table position cane be set.
thank you all
-

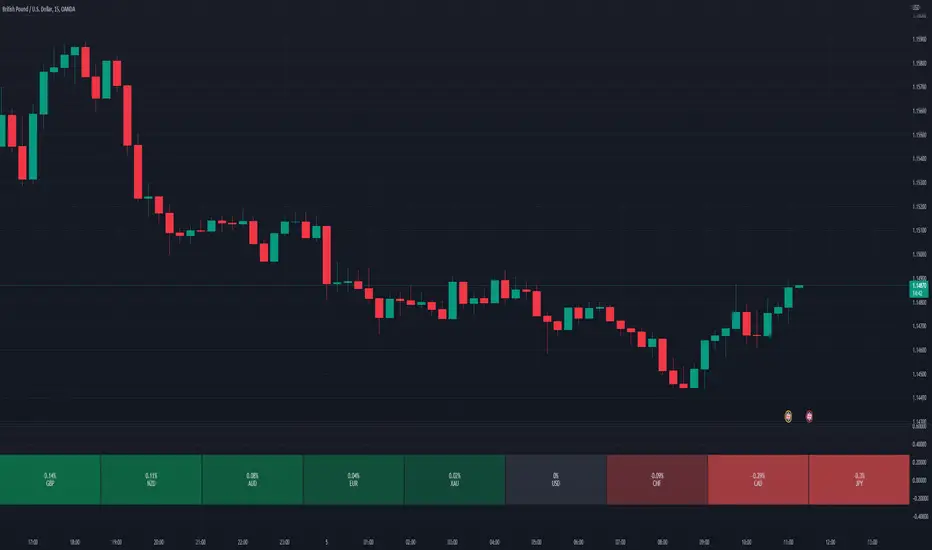
Relative Perfomance IndexHello Traders.
Lets keep it simple..
1. Take the major pairs that have USD in them and watch their change over a specific timeframe.
2. Now lets sort these changes of each pair from the most positive to the most negative.
Good, I see you have some ideas already.
This is exactly what this indicator does. You will visualize the biggest change in pairs of the timeframe of your choice and from this you can decide on pairs that you want to trade.
Monthly Returns of a Strategy in a ChartIt's a simple example of how you can present your strategy's monthly performance in a chart.
You maybe know that there is no support of these kind of charts in TradingView so this chart is actually a table object under the hood.
Table visual appearance is customizable, you can change:
Location
Bar Width / High
Colors
Thanks to @MUQWISHI for hard work, for helping me coding it.
It's not about the strategy itself but the way you display returns on your chart. So pls don't critique my choice of the strategy and its performance 🙂
Disclaimer
Please remember that past performance may not be indicative of future results.
Due to various factors, including changing market conditions, the strategy may no longer perform as well as in historical backtesting.
This post and the script don’t provide any financial advice.

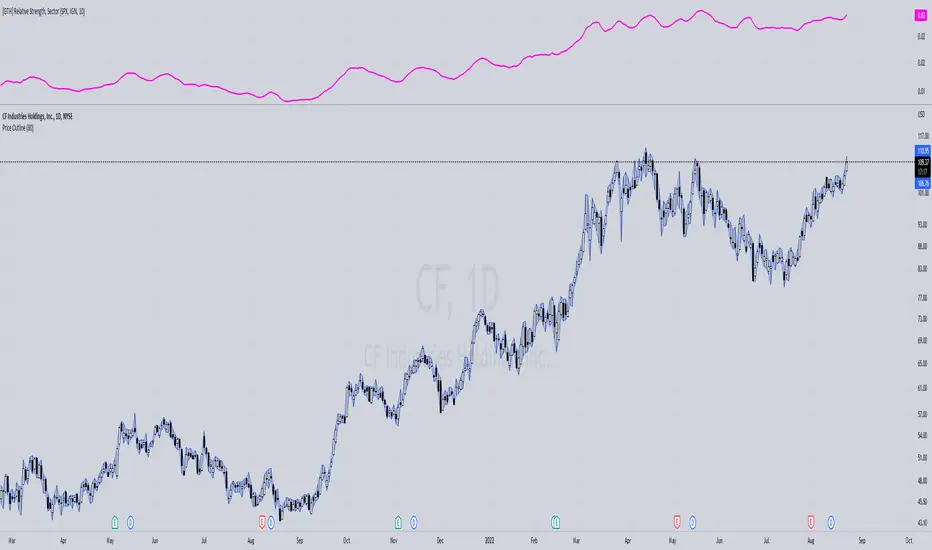
[GTH] Relative Strength, SectorsDisplays the Relative Strength (RS) of a symbol in relation to some common sector ETFs, SPX and NDX (select from drop-down list). This is done by dividing the symbol's price by the chosen sector ETF's price.
You can also select a symbol of your choice to compare against.
Interpretation:
RS line ascending: symbol performs stronger than the sector ETF.
RS line decending: symbol performs weaker than the sector ETF.
In case of error reports: please be specfic. Thanks.
Trend Strategy - TradingEDThis case study is based on different previous studies: Trend Cloud Performance & Bollinger Bands Performance , with only one count for the different indicators and independent performance charts. The use of this indicator is restricted to private use and it can be used only by invitation. Different functionalities have been added to the original code, such as alerts and signals that seek to make trading much easier to interpret by any type of trading operator of any experience level , from beginner to intermediate and advanced.
Main functions of this modified indicator:
1) The SOURCE for the count can be determined by the trader (close, open, etc).
2) The MEASURE can be based on a CANDLES count if you are trading OHLC Charts from 1D onwards, or if your trading is intraday, you can also select counts by MINUTES , HOURS or DAYS , depending on your trading style.
3) LENGTH , by default it will be loaded as 20 but considering the previous point, you can modify it according to your convenience.
4) STANDARD DEVIATION , by default it will come loaded with 2 deviations, but you can modify it according to your convenience to operate.
6) You have the option to hide or show a LABEL at the top of the chart, with respect to the signals: bullish green, bearish red.
7) You have the option to hide or show SIGNALS based on the MOVING AVERAGES that you have previously chosen.
8) You have the option to hide or show SIGNALS based on the STANDARD DEVIATION that you have previously chosen.
Main functions to customize the style of this indicator:
a) You can select the colors for the UPPER BAND , MOVING AVERAGE and LOWER BAND depending on the trend, whether it is BEARISH or BULLISH , with the colors that best suit you. *
b) When you have a SHORT SIGNAL or a LONG SIGNAL , you can change the EMOTICON that comes by default. **
c) For any type of SIGNAL , it is painted as a VERTICAL LINE in the graph, you can change the color that comes by default. *
d) In the case of the LABELS that appear at the top, the text is not modifiable, but you can customize both the type of label and change the default color. *
e) You can select the colors for the BACKGROUND of the indicator according to the trend, whether it is BEARISH or BULLISH , with the colors that best suit you. *
* By default, they are marked as red for downtrends and green for uptrends.
** By default, they are marked with an emoticon indicating the possible direction of the price, down if it is bearish or up if it is bullish.

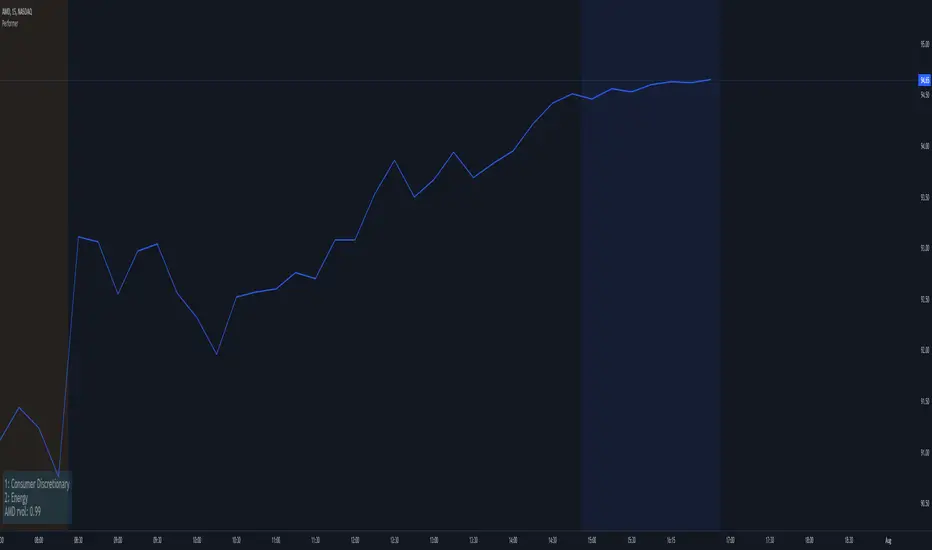
PerformerTired of spending time chasing down top performing sector(s) of the day? With this indicator, it automatically shows you the top two performing sectors for the market's open trading day. Why only two? This is because most people would rather focus their trading only the top one or two performing sector/stock(s) of the trading day and you really need only one good trade to make your money for the trading day. Also, why clutter up your chart with a big information window showing the entire list of sectors? This script is free for all to use and was designed to be non-cluttering for those who like to keep their charts clean. You can tuck this indicator in one of any of the 4 corners of your charting window for that clean look. This script features two things:
- Shows the top two performing sectors (the first 2 lines of the Information Window; there's no option to remove this, as this is the intention of having this indicator - if one of the sectors doesn't work out for you, there's usually another sector, so that's why we have the top 2)
- The last line (3rd line) shows the ticker symbol of the current stock/security you're looking at, along with the relative volume (this relative volume follows my own formula and will not match any other relative volume's found elsewhere - you can hide or show this from the settings menu)
What was removed from the original design?
Parts of this script contains the old original leftover code I disabled where the original idea was to also show you the top performing stock within the absolute top performing sector; however, I ran into a snag in getting this to work properly. I think it's a limitation issue, as well as preventing scripters from unintentionally causing a performance hit on the client and/or server side. Upon running into this issue, I then decided on, how about randomly showing a few tickers for the top performing sector, but also ran into an issue where I didn't like how it behaved. In any case, those who aren't new to the stock market should somewhat have many of these ticker symbols memorized, as well as know (or at least have an idea) a few ticker symbols in the various stock sectors. Again, this extra feature has been disabled and many parts of the original code cleaned up (or disabled) to reduce any unnecessary performance hits (for this published release). Even though this additional feature was removed/disabled from this public release, you can however, utilize the relative volume to help you figure out if the stock/security you're currently looking at is below, at or above the normal average volume. Typically, if you see a high relative volume in a particular stock/security, you know that there's a lot of trading activity with that stock/security for the day, so it's worth keeping that stock/security on your watchlist.
* Please note that this script is in its early beta stage and there could be bugs. This is being provided as is and the information provided by this script is meant for informational/entertainment purposes only. As always, please use proper due-diligence and not 100% relying on a single indicator for your trading.
Strategy BackTest Display Statistics - TraderHalaiThis script was born out of my quest to be able to display strategy back test statistics on charts to allow for easier backtesting on devices that do not natively support backtest engine (such as mobile phones, when I am backtesting from away from my computer). There are already a few good ones on TradingView, but most / many are too complicated for my needs.
Found an excellent display backtest engine by 'The Art of Trading'. This script is a snippet of his hard work, with some very minor tweaks and changes. Much respect to the original author.
Full credit to the original author of this script. It can be found here: www.tradingview.com
I decided to modify the script by simplifying it down and make it easier to integrate into existing strategies, using simple copy and paste, by relying on existing tradingview strategy backtester inputs. I have also added 3 additional performance metrics:
- Max Run Up
- Average Win per trade
- Average Loss per trade
As this is a work in progress, I will look to add in more performance metrics in future, as I further develop this script.
Feel free to use this display panel in your scripts and strategies.
Thanks and enjoy :)

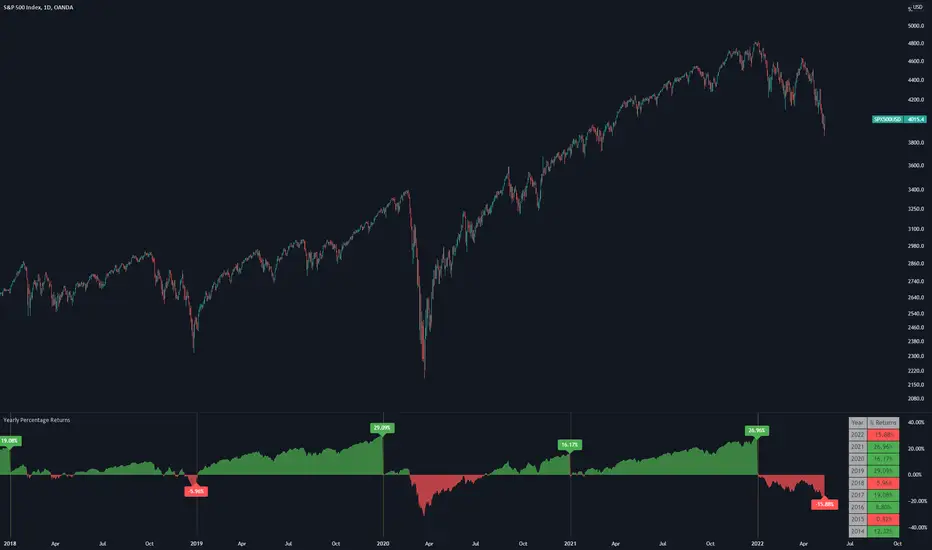
Yearly Percentage ReturnsAn indicator that lets you visualize the historical Yearly Percentage returns of any symbol .
Key Features:
Displays the yearly returns from start to end of each year
Displays a table showing all yearly returns for current symbol
Displays start of each year as a vertical line
Displays up to 5 custom horizontal levels
Table Settings:
Enable table - Show/Hide the table
Size - Sets the size of the table
Position - Sets the position of the table on the screen
Direction - Sets the direction of the table to display the data (Vertically or Horizontally)
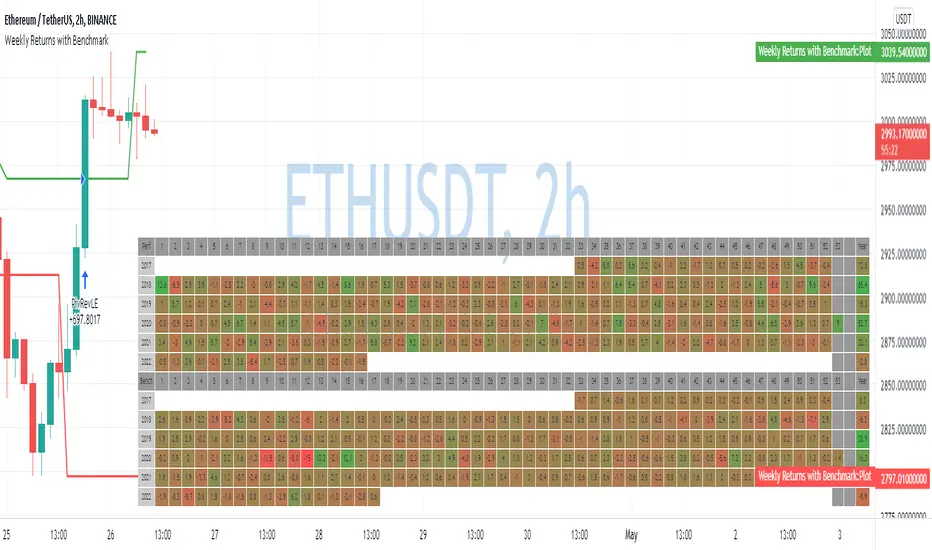
Weekly Returns with BenchmarkSome time ago I published Monthly returns table. Now It's time for weekly one.
To get it work you need a pretty big screen, but I hope it will be useful for some of you.
Features of this table includes:
Display weekly returns of your strategy, benchmark, and alpha over this benchmark.
Select benchmark to be another instrument
Select the date from which you want to compute monthly returns
Show/hide benchmark and alpha
Choose colors for gradient for gain/loss values
Use it with any type of strategy
Use it with replay
Thanks to @MUQWISHI to help me coding it.
It's not about the strategy itself but the way you display returns on your chart. So pls don't critique my choice of the strategy and its performance 🙂
Disclaimer
Please remember that past performance may not be indicative of future results.
Due to various factors, including changing market conditions, the strategy may no longer perform as well as in historical backtesting.
This post and the script don’t provide any financial advice.
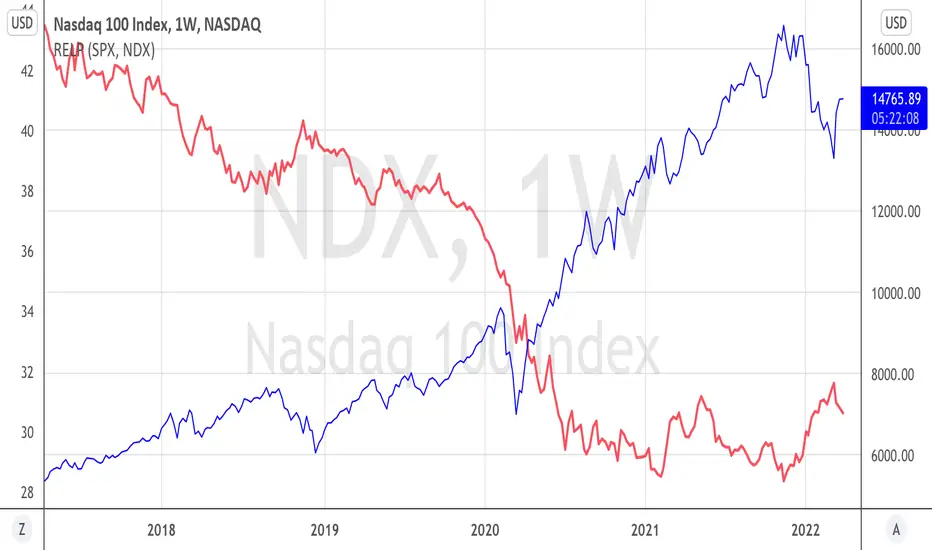
Relative PerformanceThis indicator allows to compare relative performance of two indices or securities. It is the update of the previous version rewritten in Pine Script 5 version.
Performance Table From OpenThis indicator plots the percentage performance from the open of up to 20 different customizable tickers.
Enjoy!

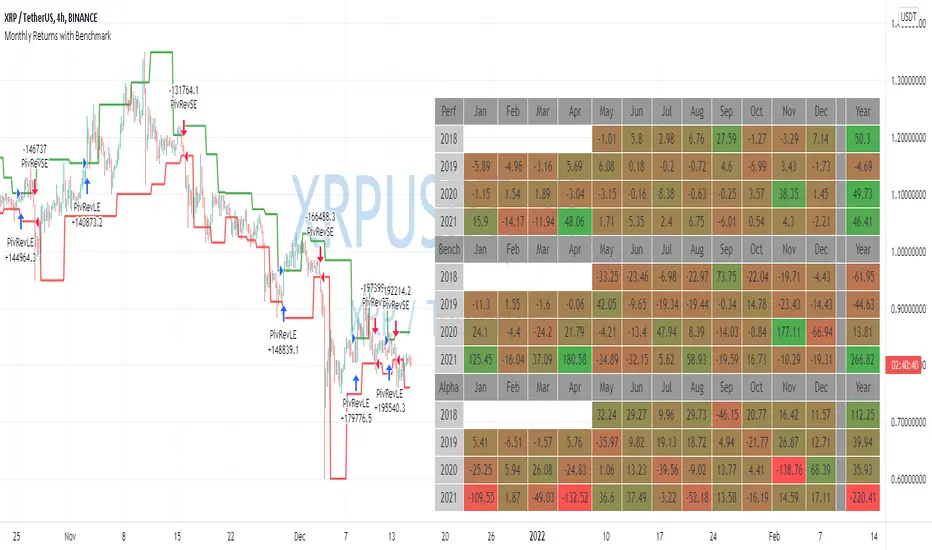
Monthly Returns with BenchmarkI keep working on trying to make TradingView strategies look fancier.
A few months ago I published the first version of the Monthly Returns for Strategies in Pine Script. I received quite a lot of good feedback and quite a lot of requests to update it.
This is a more advanced version of the Monthly Returns, in it, you can:
Display monthly returns of your strategy, benchmark, and alpha over this benchmark.
Select benchmark to be another instrument
Select the date from which you want to compute monthly returns
Show/hide benchmark and alpha
Choose colors for gradient for gain/loss values
Use it with any type of strategy
Use it with replay
I hope it will be useful for you.
It's not about the strategy itself but the way you display returns on your chart. So pls don't critique my choice of the strategy and its performance 🙂
Disclaimer
Please remember that past performance may not be indicative of future results.
Due to various factors, including changing market conditions, the strategy may no longer perform as well as in historical backtesting.
This post and the script don’t provide any financial advice.
WhaleCrew BacktesterBacktesting indicators is easy , just add the following line of code to your script:
plot(longEntry ? 1 : shortEntry ? -1 : longTP ? 0.5 : shortTP ? -0.5 : 0, color=na, editable=false, title='Backtest')
These numbers are defined as constants in the backtester source-code.
After adding this indicator to your chart:
1. Open Settings
2. Select supported indicator to backtest
3. Select if you want to enter Longs and/or Shorts
4. Open the 'Strategy Tester' at the bottom to check the performance
Remember:
past performance is not indicative of future results
repainting indicators will create wrong/unrealistic results

RSI Performance - TradingEDThis case study is based on a previous RSI study, but with three different counts to compare different trends. The use of this indicator is restricted to private use, and it can be used only by invitation. Different functionalities have been added to the original code, such as alerts and signals that seek to make trading much easier to interpret by any type of trading operator of any experience level, from beginner to intermediate and advanced .
Key components of the original indicator:
● The Relative Strength Index ( RSI ) is a popular momentum oscillator developed in 1978.
● The RSI provides technical traders signals about bullish and bearish price momentum, and it is often plotted beneath the graph of an asset's price.
● An asset is usually considered overbought when the RSI is above 70% and oversold when it is below 30%.
It is a momentum indicator used in technical analysis that measures the magnitude of recent price changes to assess overbought or oversold conditions in the price of an asset. The RSI is displayed as an oscillator (a line chart moving between two extremes) and can read from 0 to 100. Overbought does not necessarily mean that the price will reverse lower, just as oversold does not mean that the price will reverse higher. Rather, the overbought and oversold conditions simply alert traders that the RSI is near the extremes of its recent readings.
Main functions of this modified indicator:
1) The SOURCE for the counts can be determined by the trader (close, open, etc).
2) You can select the type of MOVING AVERAGE, among many available options ( SMA , EMA , DEMA , HMA , etc.)
3) The MEASURE can be based on a CANDLES count if you are trading OHLC Charts from 1D onwards, or if your trading is intraday, you can also select counts by MINUTES, HOURS or DAYS, depending on your trading style.
4) LENGTH, by default it will be loaded as in the STRATEGY, but considering the previous point, you can modify it according to your convenience.
5) You have the option to hide or show a LABEL at the top of the chart, with respect to the signals: BULLISH green, BEARISH red.
Main performance functions of this modified indicator:
I) In the case of the PERFORMANCE that appears at the right of the chart, you have the option to adjust the WIDTH of each box.
II) The TEXT of the PERFORMANCE is not modifiable, but you can customize the default color. *
III) The BACKGROUND of the PERFORMANCE, you can customize the default color. *
IV) You have the option to hide or show a PERFORMANCE that appears at the right of the chart.
Main functions to customize the style of this indicator:
a) You can select the color for the ADJUSTED LEVEL and for the MOVING AVERAGE, with the colors that best suit you.
b) The CROSSOVER/CROSSUNDER signal between the MOVING AVERAGE and the ADJUSTED LEVEL can also be customized. *
c) For any type of SIGNAL, it is painted as a VERTICAL LINE in the graph, you can change the color that comes by default. *
d) In the case of the LABEL that appear at the top, the text is not modifiable, but you can customize both the type of label and change the default color. *
e) You can select the color for OVERVALUED and for UNDERVALUED levels, with the colors that best suit you.
f) You can select the colors for the BACKGROUND of the indicator according to the trend, whether it is BEARISH or BULLISH, with the colors that best suit you. *
* By default, they are marked as red for downtrends and green for uptrends.
ADXI + DMI Performance - TradingEDThis case study is based on a previous ADX + DM study, but with three different counts to compare different trends. The use of this indicator is restricted to private use, and it can be used only by invitation. Different functionalities have been added to the original code, such as alerts and signals that seek to make trading much easier to interpret by any type of trading operator of any experience level, from beginner to intermediate and advanced .
Key components of the original indicator:
• The DIRECTIONAL MOVEMENT INDEX (DMI) is a technical indicator that measures both the strength and direction of a price movement and is intended to reduce false signals.
• The DMI uses two standard indicators, one negative ( -DI ) and one positive ( +DI ), in conjunction with a third, the AVERAGE DIRECTIONAL INDEX ( ADX ), which is non-directional but shows momentum.
• The larger the spread between the two primary lines, the stronger the price trend. If +DI is way above -DI the price trend is strongly up. If -DI is way above +DI then the price trend is strongly down.
• ADX measures the strength of the trend, either up or down; a reading above 20 indicates a strong trend.
ADX is plotted as a single line with values ranging from a low of zero to a high of 100. ADX is non-directional; it registers trend strength whether price is trending up or down. The indicator is usually plotted in the same window as the two DMI lines, from which ADX is derived. When +DI is above -DI, there is more upward pressure than downward pressure in the price. Conversely, if -DI is above +DI, then there is more downward pressure on the price. This indicator may help traders assess the trend direction. Crossovers between the lines are also sometimes used as trade signals to buy or sell, theay are the main trade signals. A long trade is taken when the +DI crosses above the -DI and an uptrend could be underway. Meanwhile, a sell signal occurs when the +DI instead crosses below the -DI.
Main functions of this modified indicator:
1) You can select the type of MOVING AVERAGE, among many available options ( SMA , EMA , DEMA , HMA , etc.)
2) The SOURCE for the counts can be determined by the trader (close, open, etc).
3) The MEASURE can be based on a CANDLES count if you are trading OHLC Charts from 1D onwards, or if your trading is intraday, you can also select counts by MINUTES, HOURS or DAYS, depending on your trading style.
4) LENGTH, by default it will be loaded as in the STRATEGY, but considering the previous point, you can modify it according to your convenience.
5) You have the option to hide or show a LABEL at the top of the chart, with respect to the signals: BULLISH green, BEARISH red.
Main performance functions of this modified indicator:
I) In the case of the PERFORMANCE that appears at the right of the chart, you have the option to adjust the WIDTH of each box.
II) The TEXT of the PERFORMANCE is not modifiable, but you can customize the default color. *
III) The BACKGROUND of the PERFORMANCE, you can customize the default color. *
IV) You have the option to hide or show a PERFORMANCE that appears at the right of the chart.
Main functions to customize the style of this indicator:
a) You can select the color for ADX and for DMI, with the colors that best suit you.
b) The CROSSOVER/CROSSUNDER signal between DI+ and DI- can also be customized. *
c) For any type of SIGNAL, it is painted as a VERTICAL LINE in the graph, you can change the color that comes by default. *
d) In the case of the LABELS that appear at the top, the text is not modifiable, but you can customize both the type of label and change the default color. *
e) You can select the colors for the BACKGROUND of the indicator according to the trend, whether it is BEARISH or BULLISH, with the colors that best suit you. *
* By default, they are marked as red for downtrends and green for uptrends.

benchLibrary "bench"
A simple banchmark library to analyse script performance and bottlenecks.
Very useful if you are developing an overly complex application in Pine Script, or trying to optimise a library / function / algorithm...
Supports artificial looping benchmarks (of fast functions)
Supports integrated linear benchmarks (of expensive scripts)
One important thing to note is that the Pine Script compiler will completely ignore any calculations that do not eventually produce chart output. Therefore, if you are performing an artificial benchmark you will need to use the bench.reference(value) function to ensure the calculations are executed.
Please check the examples towards the bottom of the script.
Quick Reference
(Be warned this uses non-standard space characters to get the line indentation to work in the description!)
```
// Looping benchmark style
benchmark = bench.new(samples = 500, loops = 5000)
data = array.new_int()
if bench.start(benchmark)
while bench.loop(benchmark)
array.unshift(data, timenow)
bench.mark(benchmark)
while bench.loop(benchmark)
array.unshift(data, timenow)
bench.mark(benchmark)
while bench.loop(benchmark)
array.unshift(data, timenow)
bench.stop(benchmark)
bench.reference(array.get(data, 0))
bench.report(benchmark, '1x array.unshift()')
// Linear benchmark style
benchmark = bench.new()
data = array.new_int()
bench.start(benchmark)
for i = 0 to 1000
array.unshift(data, timenow)
bench.mark(benchmark)
for i = 0 to 1000
array.unshift(data, timenow)
bench.stop(benchmark)
bench.reference(array.get(data, 0))
bench.report(benchmark,'1000x array.unshift()')
```
Detailed Interface
new(samples, loops) Initialises a new benchmark array
Parameters:
samples : int, the number of bars in which to collect samples
loops : int, the number of loops to execute within each sample
Returns: int , the benchmark array
active(benchmark) Determing if the benchmarks state is active
Parameters:
benchmark : int , the benchmark array
Returns: bool, true only if the state is active
start(benchmark) Start recording a benchmark from this point
Parameters:
benchmark : int , the benchmark array
Returns: bool, true only if the benchmark is unfinished
loop(benchmark) Returns true until call count exceeds bench.new(loop) variable
Parameters:
benchmark : int , the benchmark array
Returns: bool, true while looping
reference(number, string) Add a compiler reference to the chart so the calculations don't get optimised away
Parameters:
number : float, a numeric value to reference
string : string, a string value to reference
mark(benchmark, number, string) Marks the end of one recorded interval and the start of the next
Parameters:
benchmark : int , the benchmark array
number : float, a numeric value to reference
string : string, a string value to reference
stop(benchmark, number, string) Stop the benchmark, ending the final interval
Parameters:
benchmark : int , the benchmark array
number : float, a numeric value to reference
string : string, a string value to reference
report(Prints, benchmark, title, text_size, position)
Parameters:
Prints : the benchmarks results to the screen
benchmark : int , the benchmark array
title : string, add a custom title to the report
text_size : string, the text size of the log console (global size vars)
position : string, the position of the log console (global position vars)
unittest_bench(case) Cache module unit tests, for inclusion in parent script test suite. Usage: bench.unittest_bench(__ASSERTS)
Parameters:
case : string , the current test case and array of previous unit tests (__ASSERTS)
unittest(verbose) Run the bench module unit tests as a stand alone. Usage: bench.unittest()
Parameters:
verbose : bool, optionally disable the full report to only display failures

Jerry Romine TS BAR (PE Ratio, % Change, ATR, TS, Volume, NIM)We are excited to introduce our TradingView Bar which gives you a quick read of the stock, index, or cryptocurrency at a glance. The PE ratio helps you quickly categorize the security. Percentage of change helps you quickly assess if the stock is trending up (lots of green) or down (lots of red). The ATR (Average True Range) expresses the volatility of the stock and is used to determine the recommended trail stop. Volume Percent compares the last 3 trading days to the previous 30. And the Net Income Margin helps you quickly assess the stocks profitability.
The indicator components are:
Price to Earnings Ratio
Price Performance over time( 1 week, 1, month, 2 months 3 months, 6 months, 1 year, 2 years)
ATR (volatility indicator). Shown as a dollar and %
Recommended Trail Stop (Based on ATR multiple)
Volume Percent
Dividend Yield (stocks only)
Net Income Margin (stocks only)
* The Trail Stop and Volume indicator can be easily adjusted in the settings.
Please Use the link below for more information or to purchase.

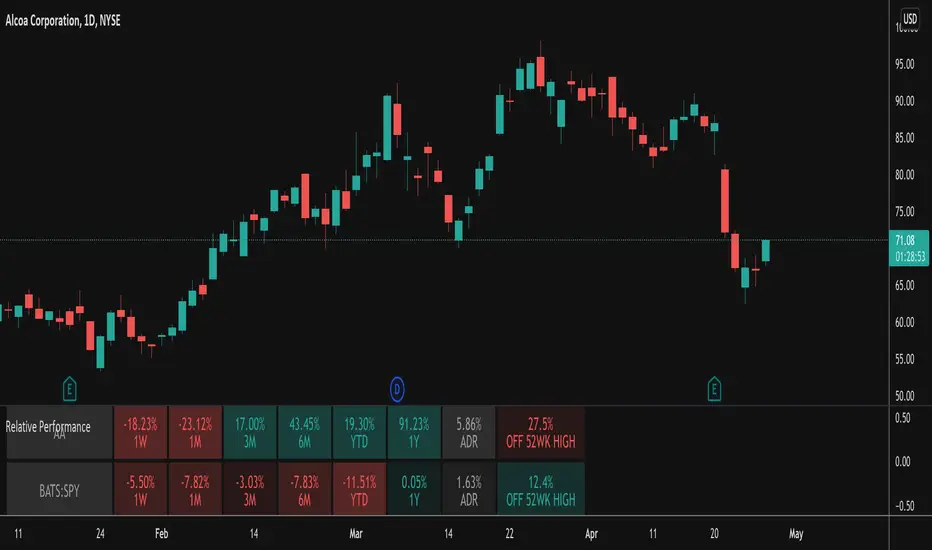
Relative PerformanceThis indicator takes the Performance Table from @BeeHolder and converts it to a Relative Performance table so you can compare the current chart vs. an Index (or whatever other ticker you want) to see the relative performance of one vs. the other. I also added a cell for ADR, which is also the same value as "Monthly Volatility" in the stock screener. This can be useful when screening stocks based on performance and volatility.