PlayBit EMAPlayBit EMA Indicator
Introducing the PlayBit EMA, a highly esteemed technical analysis tool within the PlayBit Community and a personal favorite of Bitcoin Playboy. This indicator has cemented its place as a staple among traders for its simplicity and effectiveness.
Key Features:
PB EMA: Utilizes two Exponential Moving Averages (EMAs) to identify support and resistance zones and help identify potential reversal points.
Dynamic Fill Color:
The fill color will change based on if the closing price is above, below, or in between.
This indicator is not only a reflection of market dynamics but also an essential tool for traders looking to make informed decisions based on the relationship between price action and moving averages. Whether you're a seasoned trader or just starting out, the PlayBit EMA is an invaluable addition to your trading arsenal.
PB

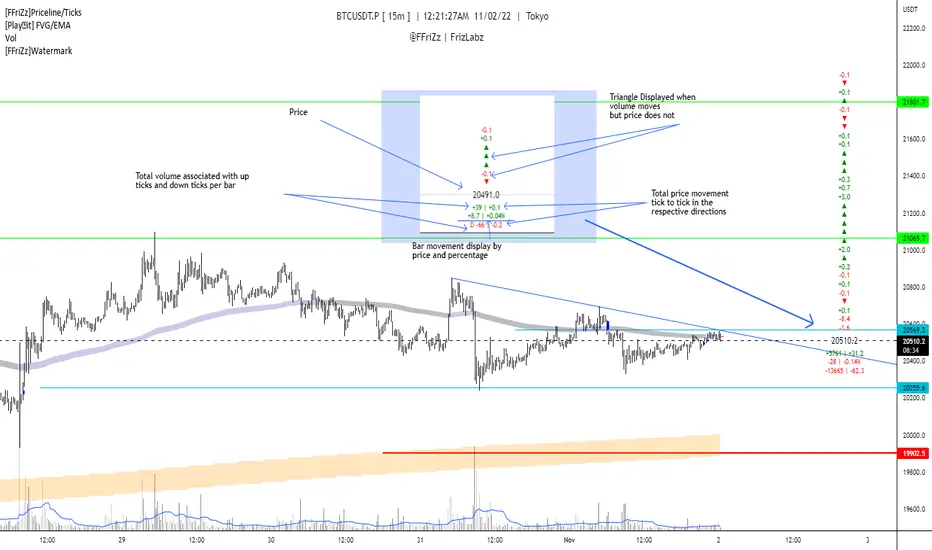
[FFriZz]Priceline/TicksFFriZz | FrizLabz -- Priceline/Ticks
Due to TradingView not allowing us to change the size or style of the Priceline I decided to make this
You can change the style, size, color of the Price line with this Script
There is also an option for the closing price to be plotted on the Priceline
-- Colors --
You can have the Line and/or the Closing price change colors with the price movements
both are adjustable to your preference
-- Ticks --
Will show the difference in price from tick to tick
when Volume moves but price doesn't it will show '▲▼'
-- Adjustments --
The offset of the Close and Ticks can be adjusted from left to right
Can Extend Priceline in all directions
Can change the Line style and Width
Can change all the Text sizes and Colors
Can also Change Colors to change with Price movements
Can Change number of Ticks to show
-- Priceline --
You don't have to but I suggest going to the settings of your Chart and turning off the Priceline
-- Challenge --
There is Some code at the bottom that will move the Label and Ticks to the x% of your screen in from the right once
the last bar is no longer visible. I decided not to use it because even when the feature is turned off any movement of the
chart resets the Ticks. If you find out a way to have it not reset the Ticks Let me know!
If you find any bugs or have any suggestions feel free to DM me or leave a comment!
Hope you Enjoy! -- FFriZz | FrizLabz
[FrizLabz]PB OLvlsDisplay Market Open and/or Premarket Open
Labels are offset to the right of Lines
You can adjust the number of opens back to display
If you want to change the format of the label please read the tool tip
Hope you enjoy
FrizLabz

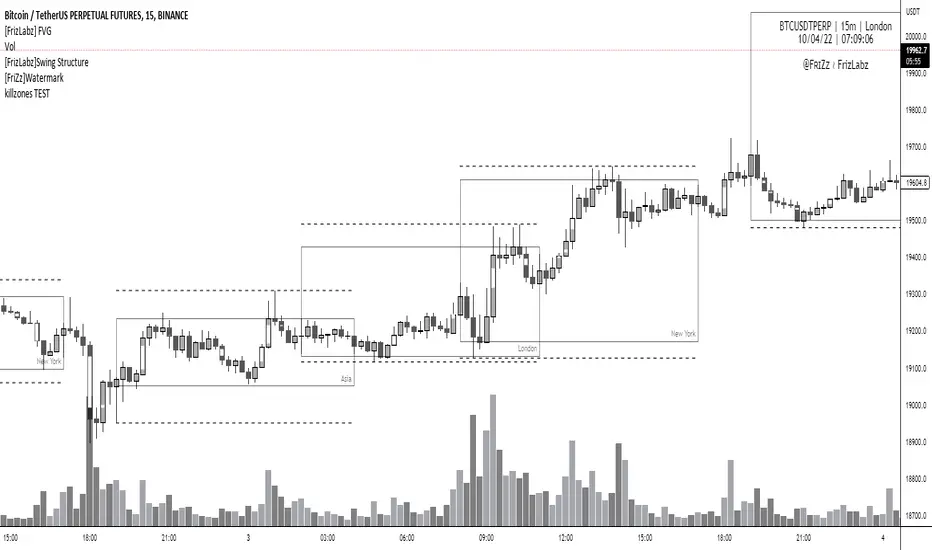
[FrizLabz] FVGFVG indicator --
Allows your Charts to stay CLEAN for your T.A. by plotting the FVGs on top of the Candles inside of its Borders
FVGs can also be turned off and you can Remove the Bar Color only
Each FVG has a tooltip that you can hover your mouse over to get the (Type of FVG, Size, Top, Middle, Bottom, Time)
FVGs Using Plots so that they go all the way back in history you can have more than 500 on the chart
Uses 4 Plots to achieve this 4 are used to prevent the fill() from carrying over to the next bar if there are 2 FVGs
Can remove Bar Color - Theres no option to change Bar Color because it will cover up the FVG
Hope you guys Enjoy,
PB Ratio Indicator FQ,FYP/B Ratio Indicator for FQ and FY plotted on the chart and with a nice neat window overlay next to the current price visualizing both values.
