Buy Sell Entry Filter SYS (SMC IDM LIT)BUY SELL Entry FILTER
An advanced market analysis tool. It provides visual Buy/Sell signals in the form of triangles (▲▼), as well as analytical elements such as Entry/Stop Loss lines, a delta table, overbought and oversold zones, structural market elements with breakouts, displays information from higher time frames, and most importantly, liquidity blocks that trigger reactions. The indicator has a number of built-in filters that help remove unnecessary Buy/Sell signals from the chart. This allows you to create several profitable strategies. You don't need to sit in front of the charts; the alert system (ALERTS) will tell you when to pay attention to the chart and quickly enter a trade.
There are many signals, and the ▲▼ lines themselves are not an entry point. You need to filter them using other tools, such as liquidity blocks (LB and HTF LB), trend, OS/OB, Delta, and Pullback breakout.
If the ▲▼ appears in the right place, for example, in the liquidity block with the correct trend and the correct delta, then you can enter a trade!
Ideally, take short trades of 1/3 – 1/5 RR on a 1-minute timeframe and be sure to set a stop loss.
Remember! You are solely responsible for your deposit!
Buy/Sell, Entry/SL, OS/OB, Filter, EMA, Delta
This main group of settings is responsible for generating buy and sell signals, setting filters, and displaying moving averages.
1. Buy/Sell Main: Enables/disables the display of the main Buy/Sell signal as a ▲▼. This is a specific pattern that identifies potential trend reversals or continuations.
Buy/Sell Simple: Toggles the display of a simplified Buy/Sell signal in the ▲▼ pattern.
This pattern is less powerful than the main one, but works well in certain contexts.
2. Trend Delta Table: Displays a table on the chart showing the cumulative volume delta for the current trend, as well as the percentage. Useful for assessing the strength of a trend.
3. Entry/SL: When enabled, draws horizontal lines on the chart for Entry and Stop Loss.
4. Filters (Delta, Trend, OS/OB, HTF OS/OB):
These filters help filter out false signals. A Buy/Sell signal is displayed only if it passes all enabled filters:
Delta Filter: A signal is generated if the volume percentage delta (set by the user) matches the signal direction (positive for Buy, negative for Sell).
Trend Filter (EMA): A signal is generated if it matches the trend direction.
OS/OB Filter (RSI): A signal is generated if the price where the signal formed is in the desired zone (below Oversold for Buy, above Overbought for Sell).
HTF OS/OB Filter (RSI): Same as OS/OB, but uses the RSI on a higher timeframe (HTF).
EMA 1 & EMA 2: Displays two exponential moving averages on the chart (default 50 and 100). The line color changes (e.g., green if EMA1 is above EMA2).
Overbought/oversold zone
This group configures overbought/oversold levels and zones, both on the current and higher timeframes.
1. OS/OB zone: Enables/disables the display of dynamic overbought (Oversold) and oversold (Overbought) levels. These levels "float," adapting to the current price. 2. Period: Period for calculating zones (default 50)
OS: Level below which the Oversold zone is defined (default 40).
OB: Level above which the Overbought zone is defined (default 60).
Labels: Toggles the display of text labels (--- OB, --- OS) next to the corresponding levels.
Mid: Toggles the display of the center level and its color.
HTF Zones & Labels: Same as for OS/OB, but for levels on a higher timeframe (HTF).
Smooth: Enables smoothing for calculated price levels of zones, making the lines less sharp.
Structure / Breakout line
This setting adds structural analysis elements and breakout lines to the chart. 1. BO Lines (Breakout Lines): Displays horizontal lines on the chart when the price breaks through the external pullback against the trend, thus showing ChoCh.
2. HH/LL: Displays markers (HH - LL - HL - LH) on the chart to indicate key market structural points.________________________________________
Pullbacks EXT/INT
This setting is responsible for the visualization of pullback lines (Pullback) at external (EXT) and internal (INT) levels.
1. Ext (External): Displays lines connecting external extremes (Pullback), showing potential pullback levels.
2. Int (Internal): Displays lines connecting internal extremes (Pullback).
3. Pending Ext/Int: Displays potential pullback lines that may form if the price reaches the next extreme.
Liquidity blocks
Adds visual rectangles (blocks) to the chart, representing potential liquidity zones (where large orders were placed).
1. LB tune: Parameter determining how many candles are used to determine the pattern for a block.
2. High zone: Color of the line inside the block, indicating the strongest part of the block.
3. Show deleted: Shows deleted (broken) blocks in a different color.
4. Volume LB: Enables/disables the display of the volume value in the block.
Quick liquidity blocks
Similar to main blocks, but creates quick blocks. If a quick block is confirmed, it becomes the main LB; if not, it disappears.
1. Quick LB: Enables/disables quick blocks.
2. QLB tune: Pattern length parameter for quick blocks.
HTF liquidity blocks
Displays LB from a higher timeframe (HTF), using the same principles as main blocks. 1. HTF: Enable/disable HTF blocks.
2. Select a timeframe for calculation.
Alerts
A system for alerting you to important indicator actions. Alerts are triggered by certain events.
1. Bull PB Breakout / Bear PB Breakout: Alert when the external pullback is broken and a ChoCh is formed.
2. Trend Change: Alert when a trend changes.
3. New Block: Alert when a new main liquidity block is formed.
4. New HTF Block: Alert when a new HTF liquidity block is formed.
5. Touch Block: Alert when the price of the main liquidity block is touched.
6. Touch HTF Block: Alert when the price of the HTF liquidity block is touched.
7. Touch mode / Touch mode HTF: Select the alert frequency (before or after the bar closes).
This indicator provides a powerful and flexible tool for market analysis, combining several approaches in a single interface.
Orderblocks

Volume Cluster Support and Resistance Levels [QuantAlgo]🟢 Overview
This indicator identifies statistically significant support and resistance levels through volume cluster analysis, isolating price zones characterized by elevated trading activity and institutional participation. By quantifying areas where volume concentration exceeded historical norms, it reveals price levels with demonstrated supply-demand imbalances that exhibit persistent influence on subsequent price action. The methodology is asset-agnostic and timeframe-independent, applicable across equities, cryptocurrencies, forex, and commodities from intraday to weekly intervals.
🟢 Key Features
1. Support and Resistance Levels
The indicator scans historical price data to identify bars where volume exceeds a user-defined threshold multiplier relative to the rolling average. For each qualifying bar, a representative price is calculated using the average of high, low, and close. Proximate price levels within a specified percentage range are then aggregated into discrete clusters using volume-weighted averaging, eliminating redundant signals. Clusters are ranked by cumulative volume to determine statistical significance. Finally, the indicator plots horizontal levels at each cluster price: support levels (green) below current price indicate zones where historical buying pressure exceeded selling pressure, while resistance levels (red) above current price mark zones where sellers historically dominated. These levels represent areas of established liquidity and price discovery, where institutional order flow previously concentrated.
The Touch Count (T) metric quantifies historical price interaction frequency, while Total Volume (TV) measures aggregate trading activity at each level, providing objective criteria for assessing level strength and trade execution decisions.
2. Volume Histogram
A histogram appears below the price chart, displaying relative volume for each bar within the lookback period, with bar height scaled to the maximum volume observed. Green bars represent up-periods (close > open) indicating buying pressure, while red bars show down-periods (close < open) indicating selling pressure. This visualization helps you confirm the validity of support/resistance levels by seeing where volume actually spiked, identify accumulation/distribution patterns, and validate breakouts by checking if they occur on above-average volume.
3. Built-in Alerts
Automated alerts trigger when price crosses below support levels or breaks above resistance levels, allowing you to monitor multiple assets without constant chart-watching.
4. Customizable Color Schemes
The indicator provides four preset color configurations (Classic, Aqua, Cosmic, Custom) optimized for visual clarity across different charting environments. Each scheme maintains consistent color mapping for support and resistance zones across both level lines and volume histogram components. The Custom configuration permits full color specification to accommodate individual charting setups, ensuring optimal visual contrast for extended analysis sessions.
Classic:
Aqua:
Cosmic:
Custom:
🟢 Pro Tips
→ Trade entry optimization: Execute long positions at support levels with high touch counts or upon confirmed resistance breakouts accompanied by above-average volume
→ Risk parameter definition: Position stop-loss orders near identified support/resistance zones with statistical significance to minimize premature exits
→ Breakout validation: Require volume confirmation exceeding historical average when price penetrates resistance to filter false breakouts
→ Level strength assessment: Prioritize levels with higher touch counts and total volume metrics for enhanced probability trade setups
→ Multi-timeframe confluence: Synthesize support/resistance levels across multiple timeframes to identify high-conviction zones where daily support aligns with 4-hour resistance structures

Order Blocks & Market Structure (SMC)# Order Blocks & Market Structure (SMC)
## 📊 Overview
A Smart Money Concepts indicator that identifies institutional order blocks (OB), market structure breaks (MSB), and breaker blocks (BB) with volume-based strength analysis. Designed for traders seeking to identify institutional accumulation/distribution zones and market structure shifts.
## 🎯 Originality Statement
This indicator combines multiple analytical approaches into a unified system:
- **Multi-level OB strength classification** using volume spike detection and body ratio analysis (OB/OB+/OB++)
- **Automatic lifecycle tracking** that converts invalidated Order Blocks to Breaker Blocks with polarity reversal
- **Volume context integration** showing buyer/seller dominance percentage at block formation
- **Dynamic zone extension** that updates OB boundaries until price interaction or invalidation
- **Delayed touch alerts** (5-bar minimum) to filter premature retest signals
Unlike simple order block scripts that only mark zones, this tool provides strength assessment, volume analysis, and intelligent state management throughout the block lifecycle.
## ⚙️ Technical Methodology
**Market Structure Detection:**
Uses pivot-based swing point analysis to identify trend changes. When price closes above a pivot high (bullish MSB) or below a pivot low (bearish MSB), the structure is marked with horizontal reference lines.
**Order Block Identification:**
Searches the specified lookback period for the lowest low (bullish MSB) or highest high (bearish MSB). When a strong directional candle is found (opposite color to trend direction), its range becomes an OB zone.
**Strength Analysis:**
- Compares candle volume against 20-period SMA with configurable multiplier (1.2-3.0x)
- Calculates body-to-range ratio to assess candle strength (0.4-0.8 threshold)
- Assigns strength levels: Standard (no conditions), Strong (one condition), Premium (both conditions)
**Breaker Block Conversion:**
When price closes completely through an OB zone (bullish OB broken downward or bearish OB broken upward), the zone automatically converts to BB with reversed polarity and color.
## 📋 Features
**Market Structure (MSB):**
- Detects bullish and bearish structure breaks
- Configurable swing length (5-50 bars)
- Visual markers with horizontal lines
**Order Blocks (OB):**
- Three strength tiers: OB (standard), OB+ (strong), OB++ (premium)
- Volume percentage display (buyer vs seller dominance)
- Dynamic zone extension until invalidation
**Breaker Blocks (BB):**
- Automatic conversion from failed OBs
- Polarity tracking (bullish ↔ bearish)
- Fixed zones after conversion
## 🔧 Settings Documentation
**Market Structure Group:**
*Show Market Structure* - Enable/disable MSB detection and line drawing
- Default: ON
- When OFF: No structure lines or labels appear
*MSB Labels* - Display text labels at structure break points
- Default: ON
- Labels show "MSB" at the break candle
*Swing Length* - Lookback period for pivot point detection
- Range: 5-50 bars
- Default: 10
- Higher values = longer-term structure, fewer signals
- Lower values = short-term structure, more signals
*Bull Color* - Color for bullish elements (MSB, bullish OB, bullish BB)
- Default: #089981 (green)
*Bear Color* - Color for bearish elements (MSB, bearish OB, bearish BB)
- Default: #f23645 (red)
**Order Block Group:**
*Order Blocks* - Enable/disable OB detection and zone drawing
- Default: ON
- When OFF: No boxes appear (MSB lines still show if enabled)
*OB Strength* - Enable multi-level strength classification
- Default: ON
- When ON: Labels show OB/OB+/OB++ based on analysis
- When OFF: All zones labeled simply as "OB"
*Volume %* - Display buyer/seller volume percentage
- Default: ON
- Shows "X% Buy" or "X% Sell" inside zones
- Calculated over 10 bars from zone formation
*OB Lookback* - How many bars to search for OB candle
- Range: 5-30 bars
- Default: 10
- Searches for lowest low (bullish) or highest high (bearish) within this range
*Vol Threshold* - Minimum volume multiplier for strength upgrade
- Range: 1.2-3.0x
- Default: 1.5x
- Volume must exceed (20-period SMA × threshold) for OB+ or OB++
*Body Ratio* - Minimum body-to-range ratio for strength upgrade
- Range: 0.4-0.8
- Default: 0.6
- Candle body must be at least this proportion of total range for OB+ or OB++
## 📖 How to Use
**For Trend Following:**
1. Wait for MSB in your desired direction
2. OB forms in the breakout area (the institutional entry zone)
3. Price may immediately continue or pull back to retest OB
4. Enter on OB retest with "OB Touch" alert (after 5+ bars from creation)
5. Higher strength OB (OB+, OB++) indicates stronger institutional activity
**For Reversal Trading:**
1. Identify Breaker Blocks (former OBs that failed)
2. BB represents potential reversal zone with opposite polarity
3. Wait for MSB in BB direction for confirmation
4. Enter on pullback to BB zone
**Volume Analysis:**
- 70%+ Buy/Sell dominance = strong institutional bias
- 60-70% = moderate bias
- 50-60% = weak bias, use caution
**Optimal Conditions:**
- Works best on trending markets (4H, Daily, Weekly timeframes)
- Less effective in tight ranges or low-volume periods
- Major pairs/assets with good liquidity recommended
## 🔔 Alert Conditions (8 Types)
The indicator provides the following alerts:
1. **Bullish MSB** - Upward market structure break detected
2. **Bearish MSB** - Downward market structure break detected
3. **Bullish OB Created** - New bullish order block formed
4. **Bearish OB Created** - New bearish order block formed
5. **Bullish BB Created** - Bearish OB converted to bullish BB
6. **Bearish BB Created** - Bullish OB converted to bearish BB
7. **Bullish OB Touch** - Price revisited bullish OB (minimum 5 bars after creation)
8. **Bearish OB Touch** - Price revisited bearish OB (minimum 5 bars after creation)
Touch alerts include a 5-bar delay to avoid alerting on immediate continuation moves.
## ⚠️ Limitations & Risk Disclosure
**Known Limitations:**
- MSB signals can produce whipsaws in ranging or choppy markets
- Not all OB touches result in successful trades
- OB zones may be tested multiple times before activation
- Volume data may be unavailable or unreliable on some instruments/exchanges
- Strength analysis requires sufficient volume history
- Historical repainting: OB zones extend dynamically as price interacts with them
**Risk Considerations:**
This indicator is designed for educational and analytical purposes. It identifies potential institutional zones but does not predict price movement. Past identification of zones does not guarantee future trading success. OB and BB zones represent areas of interest, not guaranteed support/resistance. Always use proper risk management, combine with other analysis methods, and never risk more than you can afford to lose.
## 🎨 Visual Guide
**Colors & Symbols:**
- 🟢 Green boxes = Bullish Order Blocks / Bullish Breaker Blocks
- 🔴 Red boxes = Bearish Order Blocks / Bearish Breaker Blocks
- Horizontal lines = Market Structure Break levels
- "MSB" labels = Structure break points (above/below line)
- "OB" / "OB+" / "OB++" labels = Order Block strength (right side of box)
- "BB" labels = Breaker Block (converted from OB)
- "X% Buy/Sell" labels = Volume analysis (center of box)
**Box Behavior:**
- OB zones extend to the right as long as price interacts with them (not broken)
- When OB is invalidated, it stops extending and converts to BB
- BB zones remain fixed at their invalidation point
## 💡 Best Practices
- Focus on OB+ and OB++ zones for higher probability setups
- Confirm OB touches with price action (rejection wicks, engulfing patterns)
- Use multiple timeframe analysis (Daily OB + 4H entry)
- Avoid trading in the first 1-2 bars after OB creation (wait for touch alert)
- Consider volume % - avoid zones with <60% dominance
- Combine with other confluence factors (Fibonacci, support/resistance)
- Set realistic stop losses beyond the OB/BB zone
---
**Version:** 1.0
**Pine Script:** Version 6
**Category:** Smart Money Concepts, Order Flow, Market Structure
For questions or suggestions, use the TradingView comments section below.
AI MEDEA FORECASTAI MEDEA searches for similar historical patterns and uses them to generate predictions. The longer it runs, the more data it gathers and the better the predictions become.
Important:
The indicator must remain enabled to:
- Collect predictions and check their accuracy
- Have as much data as possible for comparison
- Provide more accurate results
Recommendation:
Let the indicator run for several days on different timeframes (15m, 30m, 1H, 4H). The accuracy table will show the actual accuracy only after gathering enough predictions.

Synapse Dynamics - Market Structure📊 SYNAPSE DYNAMICS - MARKET STRUCTURE INDICATOR
An educational tool for learning and practicing Smart Money Concepts (SMC) methodology through visual representation of institutional price action patterns.
═══════════════════════════════════════════════════
🎯 WHAT THIS INDICATOR DISPLAYS
This indicator visualizes Smart Money Concepts patterns on your chart:
- Order Blocks (OB) - Supply and demand zones based on institutional order flow theory. The indicator identifies these areas using price action criteria including the final opposing candle before a strong directional move.
- Breaker Blocks - Failed order blocks that may act as support/resistance. These occur when an order block is invalidated but price returns to the zone, potentially reversing its role.
- Fair Value Gaps (FVG) - Three-candle imbalance patterns where price gaps create inefficiencies. The indicator marks these zones for reference in analysis.
- Market Structure - Break of Structure (BOS) and Change of Character (CHoCH) patterns based on swing high/low breaks. These help identify potential trend continuation or reversal points.
- Reference Entry Signals - The indicator calculates potential entry zones with accompanying stop loss and take profit reference levels based on order block and FVG locations. These are for educational reference only.
- Higher Timeframe Context - Optional filter that displays the higher timeframe trend direction to provide additional market context.
- Information Panel - On-screen dashboard showing active reference signals, their status, and relevant price levels.
- Swing Point Mapping - Labels recent higher highs (HH), higher lows (HL), lower highs (LH), and lower lows (LL) based on configurable swing detection parameters.
═══════════════════════════════════════════════════
⚙️ HOW IT WORKS
The indicator uses the following methodology:
**Order Block Detection:** Identifies the last opposing candle before a strong directional move that breaks structure. Filters blocks by size to reduce noise.
**Market Structure Analysis:** Tracks swing points and identifies when price breaks previous highs/lows to determine BOS or CHoCH patterns.
**Fair Value Gap Identification:** Detects three-candle patterns where candle 1's high/low doesn't overlap with candle 3's low/high, creating an imbalance zone.
**Reference Signal Generation:** Combines order block proximity, FVG presence, and market structure breaks to suggest potential study areas. Optional HTF trend filter can be enabled.
**Timeframe Adaptation:** Automatically adjusts swing detection sensitivity based on the chart timeframe (using multipliers for intraday vs. higher timeframes).
═══════════════════════════════════════════════════
📚 EDUCATIONAL PURPOSE & IMPORTANT LIMITATIONS
**This indicator is designed as an educational tool for:**
- Learning Smart Money Concepts methodology
- Practicing pattern recognition
- Understanding institutional price action theories
- Analyzing market structure visually
**Critical Understanding:**
- All signals and levels are REFERENCE POINTS for study - not trading recommendations
- The indicator displays patterns based on historical price action - it cannot predict future movements
- Smart Money Concepts is a theoretical framework - market behavior varies
- Backtested or historical results shown do not guarantee future performance
- No indicator can account for all market variables, news events, or changing conditions
**Proper Use:**
This tool is meant to assist in learning technical analysis concepts. Users must develop their own analysis skills, risk management strategies, and trading plans. The displayed patterns require interpretation within broader market context.
═══════════════════════════════════════════════════
⚙️ CUSTOMIZATION OPTIONS
**Adjustable Parameters:**
- Order Block: Minimum size threshold, maximum count displayed
- Fair Value Gaps: Toggle visibility, maximum count
- Market Structure: Swing detection length, BOS/CHoCH display
- Signals: Entry/SL/TP calculation method, HTF filter toggle
- Visual Settings: Colors, line styles, label sizes, panel position
**Timeframe Compatibility:**
Works on all timeframes from 1-minute to monthly charts. The swing detection automatically scales based on timeframe.
═══════════════════════════════════════════════════
⚠️ DISCLAIMER
This indicator is for educational and informational purposes only. It does not constitute financial advice or trading recommendations. Trading involves substantial risk of loss. Past patterns and historical analysis do not indicate future results. Users are responsible for their own trading decisions and risk management. The author assumes no liability for trading losses.
═══════════════════════════════════════════════════
🔧 ALERT FUNCTIONALITY
Built-in alert conditions notify you when:
- New order blocks are detected
- Market structure changes occur (BOS/CHoCH)
- Reference entry signals appear
Configure alerts through TradingView's alert system.

Smart Money Concepts Pro – OB, FVG, Liquidity + Trade SetupsThis script is a complete Smart Money Concepts (SMC) toolkit designed for traders who want clean and actionable charts without clutter.
It combines the most important institutional concepts into one indicator:
Order Blocks (OB): auto-detection of bullish and bearish order blocks with mitigation tracking, merging and TTL (time-to-live).
Fair Value Gaps (FVG): automatic gap recognition with size filters, mitigation tracking and lifetime control.
Liquidity Pools (EQH/EQL): equal highs and equal lows marked with tolerance (ATR-based or fixed).
Break of Structure (BOS): up/down structure shifts plotted directly on the chart.
Multi-Timeframe (HTF): option to use higher timeframe data (e.g. H4, Daily) for stronger zones.
Trend Filter: show zones only in the direction of market structure.
Trade Setups: automatic signals for OB Retest + Trend setups, with entry, stop-loss and take-profit levels (custom R-R).
Flexible Zone Extension: choose between extending zones to the live bar or fixed box width for a cleaner look when scrolling.
Features
Fully customizable (pivot length, ATR filters, box width, TTL, zone colors)
Separate presets for Scalping, Intraday, Swing trading styles
Visual trade planning with entry/SL/TP lines and optional labels
Works across all markets (crypto, forex, indices, stocks)
How to use
Bias: identify overall direction (BOS + HTF zones).
Wait: for price to return to an unmitigated OB or FVG.
Entry: take the setup signal (OB retest + trend filter).
Risk: stop-loss at opposite OB boundary.
Target: TP based on chosen R-R multiple (default 2R).
⚡ Whether you scalp short-term moves or swing trade HTF zones, this indicator gives you a clear institutional edge in spotting supply/demand imbalances and high-probability setups.

SMC by ProfesorSMC by Profesor
Discover market structure mastery with SMC by Profesor – your ultimate Smart Money Concepts toolkit for TradingView. Identify bullish/bearish BOS & CHoCH breaks, plot internal/swing order blocks, detect EQH/EQL levels, highlight FVGs, and zone premium/discount areas. Visualize swing points, PDH/PDL lines, and trend-colored candles. Receive instant alerts for breakouts, gaps, and more. Perfect for ICT traders seeking precision in any timeframe. Historical or real-time mode – elevate your edge today!
Dinkan Price Action Pro | Pure Price Action Toolkit🔸 Overview
Dinkan Price Action Pro is a pure price-action research toolkit that automatically detects and visualizes Order Blocks (OB), Fair Value Gaps (FVG), merged-candle hidden structures, liquidity zones (including HTF bias liquidity), and trendline & chart-pattern liquidity.
This indicator helps traders align with the Higher Time Frame (HTF) bias — the direction of the dominant institutional wave — and uncover hidden candlestick structures that normal timeframe charts never show.
⚙️ Core Features
✅ Automatic Order Block detection (bullish & bearish)
✅ Fair Value Gaps with real-time fill tracking
✅ Merged-Candle Engine — reveals hidden structures between standard timeframes
✅ Liquidity Zones — equal highs/lows, trendline liquidity & HTF liquidity pools
✅ HTF Bias Engine — detect directional bias across multiple timeframes
✅ Auto Trendlines & Chart Pattern Liquidity
🔍 How It Works (Step by Step)
🕯️ A. Merged Candle Engine (Hidden Structure)
1️⃣ Choose how many candles to merge (e.g., 3–5).
2️⃣ The script groups candles backward from the current bar in continuous sets.
3️⃣ Each merged candle forms using:
• Open = first candle’s open • Close = last candle’s close
• High = highest high • Low = lowest low
4️⃣ These new candles expose “hidden” structures between fixed timeframes — revealing true base-impulse patterns missed by normal charts.
🟩 B. Order Block Detection
Detects consolidation (base) followed by strong impulse.
Marks demand (green) and supply (red) zones automatically.
Strength calculated using impulse range (and volume, if available).
Older, mitigated OBs can be hidden for clarity.
🟦 C. Fair Value Gaps (FVG)
Automatically detects imbalances between consecutive candles.
Unfilled FVGs are highlighted; once filled, zones fade or gray out.
Works dynamically across merged and standard candles.
🟧 D. Liquidity Zones
Finds equal highs/lows, wick clusters, and structural liquidity.
Trendline liquidity and chart-pattern liquidity detected in real time.
Projects HTF liquidity zones from higher charts down to current timeframe.
🔺 E. HTF Bias Engine
Analyzes higher and medium timeframes (HTF/MTF) using CISD-style confirmation.
Bias auto-adjusts or can be manually selected.
🧭 Purpose: Identify the dominant institutional flow and trade in its direction.
⏰ Timeframe Alignment
Recommended structure:
HTF: 4H or 1D
MTF: 1H or 30M
LTF: 15M or 5M
Users may let the script auto-adjust or manually configure each timeframe combination.
📘 Inputs & Settings
🔹 OB sensitivity (Low / Medium / High)
🔹 Volume weighting toggle
🔹 HTF & MTF selection (Auto / Manual)
🔹 Multi-symbol mode
🔹 Visual toggles (OB, FVG, trendlines, merged candles, bias labels)
🔹 Alert toggles (zone touch, bias flip, hidden structure detection)
📊 How to Use — Workflow Example
1️⃣ Load the indicator on your chart.
2️⃣ Check the HTF Bias direction — trade only in that direction.
3️⃣ Identify nearby Order Blocks or FVGs inside HTF liquidity areas.
4️⃣ Watch the Merged Candle View to confirm hidden structures (base + impulse).
5️⃣ Wait for LTF confirmation (e.g., small structure break, wick rejection).
6️⃣ Place stop beyond the opposite OB edge; target next liquidity cluster.
🎯 This workflow aligns your lower-timeframe trades with the dominant higher-timeframe flow.
🧱 Repainting & Stability
Completed OBs and FVGs remain static — they do not repaint.
Real-time zones during candle formation can update until candle closes (standard behavior).
Merged candles are recalculated each bar; once a group closes, it remains fixed historically.
⚠️ Limitations
This is not a buy/sell signal generator.
Volume-weighted features require volume data.
Use responsible risk management and independent confirmation methods.
🔒 Invite-Only / Locked Code
The script is published as invite-only to protect proprietary implementations of:
The merged-candle engine
Liquidity and bias-detection heuristics
Invite-only publishing complies with TradingView rules.
All logic, purpose, and usage are fully described here for transparency.
🧩 Originality & Usefulness
This script is an original integrated system, not a simple mashup.
Each module is interconnected to provide a unified analytical process:
The Merged Candle Engine creates hybrid bars that expose hidden base–impulse patterns.
These merged bars feed into the Order Block and Fair Value Gap logic, refining zone accuracy.
The Liquidity Detector references those zones and merged bars to locate valid structural pools.
Finally, the HTF Bias Engine confirms directional context across multiple pairs and timeframes.
Together, these elements form a dynamic framework that interprets institutional footprints and structure flow — something no single indicator can achieve individually.
The combination produces new analytical value: a precise, adaptive HTF bias alignment and structure-based liquidity map in one visual system.
📜 Disclaimer
This tool is for educational and analytical use only.
It does not constitute financial advice.
Trading involves risk — always perform independent analysis and practice sound risk management.
Past performance does not guarantee future results.
HTF Order Blocks [TradeWithRon]HTF Order Blocks is a clean, multi-timeframe order-flow tool that maps bullish/bearish order blocks and optional breaker blocks from higher timeframes onto your current chart. It’s built for clarity and speed: minimal clutter, configurable labels, and optional Fibonacci extensions for quick projection work.
What it does
Identifies Order Blocks (OBs) using swing structure (configurable lookback).
Marks Breaker Blocks when an OB is breached and market structure flips.
Projects HTF zones from up to two higher timeframes (HTF1 & HTF2), with separate color themes.
Clean visuals: open lines, and smart label placement.
Optional Fibonacci extensions from each OB for quick confluence checks.
Alert-ready: receive alerts on creation of Bullish/Bearish OBs and Breakers.
Key Features
Multi-Timeframe Mapping
Enable HTF1 and/or HTF2 and project their OBs on your active chart.
Uses request.security() with lookahead_off to avoid future-bar leakage.
Fibonacci Add-On (optional)
How it works (logic overview)
Swing detection: Finds recent pivots using a lookback window.
OB creation:
Bullish OB: Created after price closes above a prior swing high, then scans the upswing for the most meaningful base candle range (high/low/open/close).
Bearish OB: Created after price closes below a prior swing low, with symmetric logic.
Breaker state:
A bullish OB turns breaker if price later closes below its base;
A bearish OB turns breaker if price closes above its base.
Cleanup: Breakers are removed if price subsequently recovers past the opposing OB boundary.
HTF OBs are detected on their native timeframe and projected to the active chart; confirmation occurs on the HTF bar’s close.
Orderblocks & BreakersThis indicator identifies potential orderblocks and breakers based on recent swing highs and lows. It is built to offer a structured, customizable, and noise-controlled view of how price interacts with supply and demand levels.
The script applies pivot-based swing detection to identify swing highs and lows.
Bullish Orderblocks: The script Identifies and stores the last down candle before a swing high is breached and confirms and plots the orderblock with a market structure break (close above the swing high).
Bearish Orderblocks: The script Identifies and stores the last up candle before a swing low is breached and confirms and plots the orderblock with a market structure break (close below the swing low).
When price later closes through an existing orderblock, it is reclassified as a Breaker and recolored accordingly. (all colors can be changed in the settings)
What Makes It Different
Unlike most orderblock tools that simply mark every swing-based block, this version introduces:
1. Chop Control – automatically hides breakers that price repeatedly closes through (2 closes after the orderblock becomes a breaker), keeping only relevant zones visible.
2. Recent Block Filtering – limits how many of the recent orderblocks or breakers are displayed, preventing chart clutter.
3. Dynamic Updating – orderblocks automatically convert to breakers when price closes beyond them, with clear color changes.
These features make it easier to study cleaner price structure without manually managing old or invalid zones. The optional Chop Control filter can reduce overlapping or repeatedly invalidated zones to keep the chart clearer.
Customizable Parameters
- Swing detection length (shorter means more aggressive pivot detection, longer means less aggressive so less highs/lows detected)
- Number of recent blocks to display
- Visibility toggles for orderblocks or breakers
- Color and transparency controls for each type
Alerts
Alerts can be set to trigger when price tests any defined zone.
Purpose
This indicator is designed as a price structure visualization and study tool.
It may assist in understanding how price interacts with previously active regions, but it does not produce signals or trade recommendations.

OrderBlocks by exp3rts (Non-Repainting)The OrderBlocks by exp3rts indicator automatically identifies and visualizes bullish and bearish order blocks using confirmed, non-repainting fractals combined with Fair Value Gap (FVG) validation for enhanced accuracy.
This tool is designed to help traders spot high-probability institutional price zones — areas where large buy or sell orders previously caused significant moves — allowing you to anticipate potential reversal, continuation, or mitigation levels with precision.
Core Features
✅ Non-Repainting Logic: Uses confirmed 3- or 5-bar fractals only after full pattern completion.
📈 Dynamic Order Block Detection: Marks both bullish and bearish OBs automatically.
⚖️ FVG Filter (Optional): Optionally require a Fair Value Gap within a user-defined distance to confirm valid OBs.
🎯 Customizable OB Lines: Adjust color, style (solid, dashed, dotted), width, and body/wick placement.
🧹 Auto-Cleanup: Option to remove order block lines once price has been mitigated (touched/filled).
🔺🔻 Fractal Display: Toggle fractal highs/lows on or off for extra structure clarity.
⚡ Optimized for Performance: Uses efficient array management to run smoothly within TradingView’s bar processing limits.
How to Use
Add the indicator to your chart.
Adjust settings such as Fractal Filter (3/5), FVG distance, and Line Style to match your trading preference.
Watch for bullish OBs (green lines) near potential demand zones and bearish OBs (red lines) near supply zones.
Use in confluence with market structure and liquidity concepts for best results.
Settings Overview
Fractal Filter: Choose between 3-bar or 5-bar swing fractals.
Order Block Type: Detect OBs based on Close or High/Low break structure.
FVG Filter: Optionally require nearby Fair Value Gaps.
Delete After Fill: Automatically remove mitigated OBs.
Visuals: Customize line color, thickness, and style for clear chart integration.
Made for any timeframe & any market.
First week of the yearA very simple indicator that marks a channel on the candlestick for the first week of the year.
The channel can serve as an entry/exit point with a medium and long term focus.
Note: This indicator should be observed exclusively on the weekly timeframe.
BND Trader (By Vahid.Jz) 🇮🇷🎉 The first Persian indicator on TradingView, released for free to celebrate my daughter's birthday. 🎉
**Trading Assistant (by Vahid.Jz)** is an all-in-one tool designed to simplify analysis and improve accuracy. It acts as an intelligent trading partner.
**Features:**
- Market Structure detection
- Multi-Timeframe “Third Eye” analysis
- Professional Order Blocks recognition
- Fair Value Gaps (FVGs) detection
- Customizable alerts
- Fully Persian interface
- Create Custom Alarm
Developed with love by **Vahid.Jz**, a trader and Pine Script enthusiast.
*“Trading is not a destination; it’s the journey — a path of learning, growth, and experience.”*

Supply & Demand Zones [QuantAlgo]🟢 Overview
The Supply & Demand (Support & Resistance) Zones indicator identifies price levels where significant buying and selling pressure historically emerged, using swing point analysis and pattern recognition to mark high-probability reversal and continuation areas. Unlike conventional support/resistance tools that draw arbitrary horizontal lines, this indicator can automatically detect structural zones, offering traders systematic entry and exit levels where institutional order flow likely congregates across any market or timeframe.
🟢 How to Use
# Zone Types:
Green/Demand Zones: Support areas where buying pressure historically emerged, representing potential long entry opportunities where price may bounce or consolidate before moving higher. These zones mark levels where buyers previously overcame sellers.
Red/Supply Zones: Resistance areas where selling pressure historically dominated, indicating potential short entry opportunities where price may reverse or stall before declining. These zones identify levels where sellers previously overwhelmed buyers.
# Zone Pattern Types:
Wick Rejection Zones: Zones created from candles with exceptionally long wicks showing violent price rejection. A demand rejection occurs when price drops sharply but closes well above the low, forming a long lower wick (relative to the total candle range) that demonstrates buyers aggressively defending that level. A supply rejection shows price spiking higher but closing well below the high, with the long upper wick proving sellers rejected that price aggressively. These zones often represent major institutional orders that absorbed significant market pressure. The rejection wick ratio setting controls how prominent the wick must be (higher ratios require more dramatic rejections and produce fewer but higher-quality zones).
Continuation Demand Zones: Areas where price rallied upward, paused in a brief consolidation base, then rallied again. This pattern confirms strong buying continuation (the consolidation represents profit-taking or minor pullbacks that failed to attract meaningful selling). When price returns to these zones, buyers who missed the initial rally often provide support, making them high-probability long entries within established uptrends. These zones follow the classic Rally-Base-Rally structure, demonstrating that buyers remain in control even during temporary pauses.
Reversal Demand Zones: Zones where price dropped, formed a consolidation base, then reversed into a rally. This structure marks potential trend reversals or major swing lows where buyers finally overwhelmed sellers after a decline. The base period represents accumulation by stronger hands, and these zones frequently appear at market bottoms or as significant pullback support within larger uptrends, signaling shifts in market control. These zones follow the Drop-Base-Rally pattern, showing the moment when selling pressure exhausted and buying interest emerged.
Continuation Supply Zones: Areas where price dropped, consolidated briefly, then dropped again. This pattern demonstrates strong selling continuation (the pause represents temporary buying attempts that failed to generate meaningful recovery). When price returns to these zones, sellers who missed the initial decline often provide resistance, creating short entry opportunities within established downtrends. These zones follow the Drop-Base-Drop structure, confirming that sellers maintain dominance even during temporary consolidations.
Reversal Supply Zones: Zones where price rallied upward, formed a consolidation base, then reversed into a decline. This formation identifies potential trend reversals or major swing highs where sellers overcame buyers after an advance. The base period often represents distribution by institutional participants, and these zones commonly appear at market tops or as key pullback resistance within larger downtrends, marking transfers of market control from buyers to sellers. These zones follow the Rally-Base-Drop pattern, capturing the transition point when buying exhaustion meets aggressive selling.
# Zone Mitigation Methods:
Wick Mitigation: Zones become invalidated immediately upon first contact by any wick. This assumes zones work only on their initial test, reflecting the belief that institutional orders concentrated at these levels get completely filled on first touch. Best for traders seeking only the highest-probability, untested zones and willing to accept that zones invalidate frequently in volatile markets. When price touches a zone boundary with even a single wick, that zone is considered "used up" and becomes mitigated.
Close Mitigation: Zones remain valid through wick penetration but become invalidated only when a candle closes through the zone boundary. This method allows price to briefly probe the zone with wicks while requiring actual commitment (a close) for invalidation. Suitable for traders who recognize that zones can withstand initial tests and prefer filtering out false breakouts caused by temporary volatility or liquidity hunts. A zone stays active as long as candles close within or outside it, regardless of wick penetration, until a close occurs beyond the boundary.
Full Body Mitigation: Zones stay valid until an entire candle body exists completely beyond the zone boundary, meaning both the open and close must be outside the zone. This approach maintains zone validity through partial penetrations, accommodating the reality that institutional zones can absorb considerable price action before exhausting. Ideal for volatile markets or traders who believe zones represent price ranges rather than precise levels, and who want zones to persist through aggressive but ultimately rejected breakout attempts. Only when both the open and close of a candle are beyond the zone does it become mitigated.
🟢 Pro Tips for Trading and Investing
→ Preset Selection: Choose presets matching your preferred timeframe - Scalping (M1-M30) for aggressive detection on minute charts, Intraday (H1-H12) for balanced filtering on hourly timeframes, or Swing Trading (1D+) for strict filtering on daily charts. Each preset automatically optimizes swing length, zone strength, and max zone counts for the selected timeframe.
→ Input Calibration: Adjust Swing Length based on market speed (lower values 3-7 for fast markets, higher values 12-20 for slower markets). Set Minimum Zone Strength according to asset volatility (0.05-0.15% for low-volatility assets, 0.25-0.5% for high-volatility assets). Tune Rejection Wick Ratio higher (0.6-0.8) for strict wick filtering or lower (0.3-0.5) to capture more subtle rejections.
→ Zone Pattern Toggle Strategy: Pattern types are mutually exclusive - enable Continuation OR Reversal patterns for each zone type, not both together. Recommended combinations: For trend trading, enable Rejection + Continuation (2-4 toggles total). For reversal trading, enable Rejection + Reversal (2-4 toggles). For scalping, enable only Rejection zones (1-2 toggles). Maximum 3-4 active toggles provides optimal chart clarity. A simple Wick Rejection toggle can also work on virtually any market and timeframe.
→ Mitigation Method Selection: Use Wick mitigation in clean trending markets for strict zone invalidation on first touch. Use Close mitigation in moderate volatility to filter out temporary spikes. Use Full Body mitigation in highly volatile markets to keep zones active through whipsaws and false breakouts.
→ Alert Configuration: Utilize built-in alerts for new zone creation, zone touches, and zone breaks. New zone alerts notify when fresh supply/demand areas form. Zone touch alerts signal potential entry opportunities as price reaches zones. Zone break alerts indicate when levels fail, signaling possible trend acceleration or structure changes.

ICT Concepts(Liquidity, FVG & Liquidity Sweeps)📄 Description:
A Smart Money Concept (SMC)-based utility that blends ICT-style Liquidity Sweeps, Fair Value Gap (FVG) mapping, and Swing Structure proxies – designed for traders seeking clean precision in price imbalance analysis.
⸻
🔍 1. What This Script Does
T his indicator brings together three core Institutional Concepts:
• Liquidity Sweep Detection : Identifies buy/sell-side liquidity grabs (fakeouts) confirmed by volume spikes – a common precursor to institutional order flow shifts.
• Fair Value Gaps (FVGs) : Highlights inefficiencies between price legs using strict ICT-style 3-candle or gap-based rules. These are areas institutions often revisit.
• Swing Structure Proxy (OB Mapping) : Tracks dynamic swing highs/lows to act as proxy zones for potential order blocks and structural boundaries.
It also includes a cooldown-based signal filtering engine to prevent overfitting and noise, helping traders avoid false positives in choppy markets.
⚙️ 2. How It Works (Core Logic)
✅ A. Liquidity Sweep Engine
• Looks back N bars to find Equal Highs or Equal Lows.
• Triggers a signal only if price sweeps the level and closes on the other side with a volume spike.
• Customizable volume threshold (e.g., 1.5x average volume).
• Includes a signal cooldown period to reduce clutter and boost quality.
Bullish Sweep = Price dips below equal lows but closes higher
Bearish Sweep = Price spikes above equal highs but closes lower
Visuals: Signal arrows with alerts (BUY LQ / SELL LQ)
⸻
✅ B. Fair Value Gap (FVG) Zones
• Detects FVGs using:
• Sequential logic: Low > High (bullish), High < Low (bearish)
• Gap logic: Open gaps at bar open
• Dynamic box drawing:
• Automatically extends FVG zones until price fully closes through them.
• Different color coding for bullish (teal) and bearish (orange) gaps.
• Customizable:
• Opacity control
• Option to include/exclude gap-based FVGs
• Hide filled zones
• Limit total zones rendered (for performance)
⸻
✅ C. Swing High/Low Structure
• Uses a lookback period to find latest swing high/low levels.
• Acts as a proxy for Order Block zones or structural shift reference points.
• Plotted as red (high) and green (low) lines.
⸻
🚀 3. How to Use It
• Scalpers and Intraday Traders can use Liquidity Sweep + FVG Confluence to time reversals or catch early entries into trend continuation moves.
• Swing Traders can observe swing OB proxies and recent FVG zones to frame directional bias and target zones.
• Volume-Aware Traders benefit from the volume filter that confirms sweeps are meaningful – not just random stop hunts.
🔔 Set alerts on:
• Bullish Liquidity Sweeps
• Bearish Liquidity Sweeps
You can use this in combination with your own trend filters, or even confluence it with Order Blocks, VWAP, or EMA trend tools.
⸻
💡 What Makes It Original?
• The script doesn’t merely combine standard tools — it builds a cohesive ICT-style detection system using:
• A custom volume-confirmed liquidity sweep filter
• Dynamic FVG rendering with filled logic + performance optimization
• Visual hierarchy to avoid clutter: clean line plots, contextual boxes, and conditional signals
• Highly customizable yet lightweight, making it suitable for fast-paced decision making.
⸻
✅ Notes
• Invite-only script for serious traders interested in Smart Money and ICT concepts.
• Does not repaint signals.
• All visuals are dynamically managed for clarity and performance.
ICT Venom Trading Model [TradingFinder] SMC NY Session 2025SetupIntroduction
The ICT Venom Model is one of the most advanced strategies in the ICT framework, designed for intraday trading on major US indices such as US100, US30, and US500. This model is rooted in liquidity theory, time and price dynamics, and institutional order flow.
The Venom Model focuses on detecting Liquidity Sweeps, identifying Fair Value Gaps (FVG), and analyzing Market Structure Shifts (MSS). By combining these ICT core concepts, traders can filter false breakouts, capture sharp reversals, and align their entries with the real institutional liquidity flow during the New York Session.
Key Highlights of ICT Venom Model :
Intraday focus : Optimized for US indices (US100, US30, US500).
Time element : Critical window is 08:00–09:30 AM (Venom Box).
Liquidity sweep logic : Price grabs liquidity at 09:30 AM open.
Confirmation tools : MSS, CISD, FVG, and Order Blocks.
Dual setups : Works in both Bullish Venom and Bearish Venom conditions.
At its core, the ICT Venom Strategy is a framework that explains how institutional players manipulate liquidity pools by engineering false breakouts around the initial range of the market. Between 08:00 and 09:30 AM New York time, a range called the “Venom Box” is formed.
This range acts as a trap for retail traders, and once the 09:30 AM market open occurs, price usually sweeps either the high or the low of this box to collect stop-loss liquidity. After this liquidity grab, the market often reverses sharply, giving birth to a classic Bullish Venom Setup or Bearish Venom Setup
The Venom Model (ICT Venom Trading Strategy) is not just a pattern recognition tool but a precise institutional trading model based on time, liquidity, and market structure. By understanding the Initial Balance Range, watching for Liquidity Sweeps, and entering trades from FVG zones or Order Blocks, traders can anticipate market reversals with high accuracy. This strategy is widely respected among ICT followers because it offers both risk management discipline and clear entry/exit conditions. In short, the Venom Model transforms liquidity manipulation into actionable trading opportunities.
Bullish Setup :
Bearish Setup :
🔵 How to Use
The ICT Venom Model is applied by observing price behavior during the early hours of the New York session. The first step is to define the Initial Range, also called the Venom Box, which is formed between 08:00 and 09:30 AM EST. This range marks the high and low points where institutional traders often create traps for retail participants. Once the official market opens at 09:30 AM, price usually sweeps either the top or bottom of this box to collect liquidity.
After this liquidity grab, the market tends to reverse in alignment with the true directional bias. To confirm the setup, traders look for signals such as a Market Structure Shift (MSS), Change in State of Delivery (CISD), or the appearance of a Fair Value Gap (FVG). These elements validate the reversal and provide precise levels for trade execution.
🟣 Bullish Setup
In a Bullish Venom Setup, the market first sweeps the low of the Venom Box after 09:30 AM, triggering sell-side liquidity collection. This downward move is often sharp and deceptive, designed to stop out retail long positions and attract new sellers. Once liquidity is taken, the market typically shifts direction, forming an MSS or CISD that signals a reversal to the upside.
Traders then wait for price to retrace into a Fair Value Gap or a demand-side Order Block created during the reversal leg. This retracement offers the ideal entry point for long positions. Stop-loss placement should be just below the liquidity sweep low, while profit targets are set at the Venom Box high and, if momentum continues, at higher session or daily highs.
🟣 Bearish Setup
In a Bearish Venom Setup, the process is similar but reversed. After the Initial Range is defined, if price breaks above the Venom Box high following the 09:30 AM open, it signals a false breakout designed to collect buy-side liquidity. This move usually traps eager buyers and clears out stop-losses above the high.
After the liquidity sweep, confirmation comes through an MSS or CISD pointing to a reversal downward. At this stage, traders anticipate a retracement into a Fair Value Gap or a supply-side Order Block formed during the reversal. Short entries are taken within this zone, with stop-loss positioned just above the liquidity sweep high. The logical profit targets include the Venom Box low and, in stronger bearish momentum, deeper session or daily lows.
🔵 Settings
Refine Order Block : Enables finer adjustments to Order Block levels for more accurate price responses.
Mitigation Level OB : Allows users to set specific reaction points within an Order Block, including: Proximal: Closest level to the current price. 50% OB: Midpoint of the Order Block. Distal: Farthest level from the current price.
FVG Filter : The Judas Swing indicator includes a filter for Fair Value Gap (FVG), allowing different filtering based on FVG width: FVG Filter Type: Can be set to "Very Aggressive," "Aggressive," "Defensive," or "Very Defensive." Higher defensiveness narrows the FVG width, focusing on narrower gaps.
Mitigation Level FVG : Like the Order Block, you can set price reaction levels for FVG with options such as Proximal, 50% OB, and Distal.
CISD : The Bar Back Check option enables traders to specify the number of past candles checked for identifying the CISD Level, enhancing CISD Level accuracy on the chart.
🔵 Conclusion
The ICT Venom Model is more than just a reversal setup; it is a complete intraday trading framework that blends liquidity theory, time precision, and market structure analysis. By focusing on the Initial Range between 08:00 and 09:30 AM New York time and observing how price reacts at the 09:30 AM open, traders can identify liquidity sweeps that reveal institutional intentions.
Whether in a Bullish Venom Setup or a Bearish Venom Setup, the model allows for precise entries through Fair Value Gaps (FVGs) and Order Blocks, while maintaining clear risk management with well-defined stop-loss and target levels.
Ultimately, the ICT Venom Model provides traders with a structured way to filter false moves and align their trades with institutional order flow. Its strength lies in transforming liquidity manipulation into actionable opportunities, giving intraday traders an edge in timing, accuracy, and consistency. For those who master its logic, the Venom Model becomes not only a strategy for entry and exit, but also a deeper framework for understanding how liquidity truly drives price in the New York session.

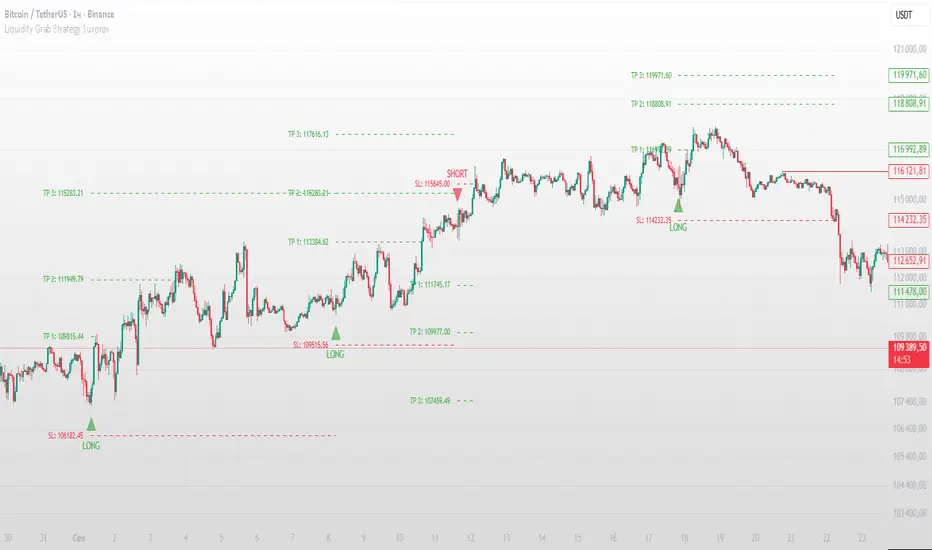
Liquidity Grab Strategy SuvorovLiquidity grab strategy
Description:
This indicator is built around the Liquidity Grab Strategy, which identifies and reacts to stop hunts and false breakouts at key swing highs and lows. It detects where liquidity is likely to be resting (e.g., above highs or below lows) and provides trade signals when that liquidity is taken and price begins to reverse.
Core Features:
Liquidity Detection: Automatically identifies and marks key swing highs and lows where stop-losses are likely to accumulate.
Entry Signals: Generates BUY/SELL signals after a liquidity sweep and a confirmed reversal — based on price action, volume, or structure shifts.
Stop Loss & Take Profit Zones: Visualizes stop-loss just beyond the liquidity wick and take-profit near the next major structure point, with configurable Risk/Reward ratios.
False Signal Filters: Optional filters based on volume spikes, RSI divergence, or market structure confirmation.
Multi-Timeframe Logic: Supports separate timeframes for structure detection and signal confirmation (e.g., structure on 1H, entry on 5m).
Order Block Volumatic FVG StrategyInspired by: Volumatic Fair Value Gaps —
License: CC BY-NC-SA 4.0 (Creative Commons Attribution–NonCommercial–ShareAlike).
This script is a non-commercial derivative work that credits the original author and keeps the same license.
What this strategy does
This turns BigBeluga’s visual FVG concept into an entry/exit strategy. It scans bullish and bearish FVG boxes, measures how deep price has mitigated into a box (as a percentage), and opens a long/short when your mitigation threshold and filters are satisfied. Risk is managed with a fixed Stop Loss % and a Trailing Stop that activates only after a user-defined profit trigger.
Additions vs. the original indicator
✅ Strategy entries based on % mitigation into FVGs (long/short).
✅ Lower-TF volume split using upticks/downticks; fallback if LTF data is missing (distributes prior bar volume by close’s position in its H–L range) to avoid NaN/0.
✅ Per-FVG total volume filter (min/max) so you can skip weak boxes.
✅ Age filter (min bars since the FVG was created) to avoid fresh/immature boxes.
✅ Bull% / Bear% share filter (the 46%/53% numbers you see inside each FVG).
✅ Optional candle confirmation and cooldown between trades.
✅ Risk management: fixed SL % + Trailing Stop with a profit trigger (doesn’t trail until your trigger is reached).
✅ Pine v6 safety: no unsupported args, no indexof/clamp/when, reverse-index deletes, guards against zero/NaN.
How a trade is decided (logic overview)
Detect FVGs (same rules as the original visual logic).
For each FVG currently intersected by the bar, compute:
Mitigation % (how deep price has entered the box).
Bull%/Bear% split (internal volume share).
Total volume (printed on the box) from LTF aggregation or fallback.
Age (bars) since the box was created.
Apply your filters:
Mitigation ≥ Long/Short threshold.
Volume between your min and max (if enabled).
Age ≥ min bars (if enabled).
Bull% / Bear% within your limits (if enabled).
(Optional) the current candle must be in trade direction (confirm).
If multiple FVGs qualify on the same bar, the strategy uses the most recent one.
Enter long/short (no pyramiding).
Exit with:
Fixed Stop Loss %, and
Trailing Stop that only starts after price reaches your profit trigger %.
Input settings (quick guide)
Mitigation source: close or high/low. Use high/low for intrabar touches; close is stricter.
Mitigation % thresholds: minimal mitigation for Long and Short.
TOTAL Volume filter: skip FVGs with too little/too much total volume (per box).
Bull/Bear share filter: require, e.g., Long only if Bull% ≥ 50; avoid Short when Bull% is high (Short Bull% max).
Age filter (bars): e.g., ≥ 20–30 bars to avoid fresh boxes.
Confirm candle: require candle direction to match the trade.
Cooldown (bars): minimum bars between entries.
Risk:
Stop Loss % (fixed from entry price).
Activate trailing at +% profit (the trigger).
Trailing distance % (the trailing gap once active).
Lower-TF aggregation:
Auto: TF/Divisor → picks 1/3/5m automatically.
Fixed: choose 1/3/5/15m explicitly.
If LTF can’t be fetched, fallback allocates prior bar’s volume by its close position in the bar’s H–L.
Suggested starting presets (you should optimize per market)
Mitigation: 60–80% for both Long/Short.
Bull/Bear share:
Long: Bull% ≥ 50–70, Bear% ≤ 100.
Short: Bull% ≤ 60 (avoid shorting into strong support), Bear% ≥ 0–70 as you prefer.
Age: ≥ 20–30 bars.
Volume: pick a min that filters noise for your symbol/timeframe.
Risk: SL 4–6%, trailing trigger 1–2%, distance 1–2% (crypto example).
Set slippage/fees in Strategy Properties.
Notes, limitations & best practices
Data differences: The LTF split uses request.security_lower_tf. If the exchange/data feed has sparse LTF data, the fallback kicks in (it’s deliberate to avoid NaNs but is a heuristic).
Real-time vs backtest: The current bar can update until close; results on historical bars use closed data. Use “Bar Replay” to understand intrabar effects.
No pyramiding: Only one position at a time. Modify pyramiding in the header if you need scaling.
Assets: For spot/crypto, TradingView “volume” is exchange volume; in some markets it may be tick volume—interpret filters accordingly.
Risk disclosure: Past performance ≠ future results. Use appropriate position sizing and risk controls; this is not financial advice.
Credits
Visual FVG concept and original implementation: BigBeluga.
This derivative strategy adds entry/exit logic, volume/age/share filters, robust LTF handling, and risk management while preserving the original spirit.
License remains CC BY-NC-SA 4.0 (non-commercial, attribution required, share-alike).

SMC Structure SuiteSMC Structure Suite — BOS, CHOCH & Order Blocks
This indicator provides automated Smart Money Concepts (SMC) tools to help traders analyze market structure objectively. It is designed for traders who want to quickly identify shifts in price behavior without manually marking charts.
Core Features
Market Structure Recognition
Automatically detects Higher Highs (HH), Lower Lows (LL), Higher Lows (HL), and Lower Highs (LH). Detection uses a pullback validation mechanism to confirm swing structure.
BOS & CHOCH Detection
Identifies Break of Structure (BOS) for potential continuation and Change of Character (CHOCH) for possible reversals.
Order Block Highlighting
Marks bullish and bearish order blocks when confirmed by price action. Options allow choosing mitigation style (wick touch or body close). Blocks are hidden when invalidated.
Multi-Timeframe Analysis
Works on any timeframe. Historical analysis allows reviewing past structure.
Customizable Visuals
Colors, label positions, and background style can be adjusted for a clear chart.
Alert System
Alerts are provided for trend changes to monitor potential shifts in market direction in real time.
Disclaimer
This indicator is a tool to assist with chart analysis. It does not guarantee results and is not financial advice. Use appropriate risk management.

Smarter Money Concepts Dashboard [PhenLabs]📊Smarter Money Concepts Dashboard
Version: PineScript™v6
📌Description
The Smarter Money Concepts Dashboard is a comprehensive institutional trading analysis tool that combines six of our most powerful smarter money concepts indicators into one unified suite. This advanced system automatically detects and visualizes Fair Value Gaps, Inverted FVGs, Order Blocks, Wyckoff Springs/Upthrusts, Wick Rejection patterns, and ICT Market Structure analysis.
Built for serious traders who need institutional-grade market analysis, this dashboard eliminates subjective interpretation by automatically identifying where smart money is likely positioned. The integrated real-time dashboard provides instant status updates on all active patterns, making it easy to monitor market conditions at a glance.
🚀Points of Innovation
● Multi-Module Integration: Six different SMC concepts unified in one comprehensive system
● Real-Time Dashboard Display: Live tracking of all active patterns with customizable positioning
● Advanced Volume Filtering: Institutional volume confirmation across all pattern types
● Automated Pattern Management: Smart memory system prevents chart clutter while maintaining relevant zones
● Probability-Based Wyckoff Detection: Mathematical probability calculations for spring/upthrust patterns
● Dual FVG System: Both standard and inverted Fair Value Gap detection with equilibrium analysis
🔧Core Components
● Fair Value Gap Engine: Detects standard FVGs with volume confirmation and equilibrium line analysis
● Inverted FVG Module: Advanced IFVG detection using RVI momentum filtering for inversion confirmation
● Order Block System: Institutional order block identification with customizable mitigation methods
● Wyckoff Pattern Recognition: Automated spring and upthrust detection with probability scoring
● Wick Rejection Analysis: High-probability reversal patterns based on wick-to-body ratios
● ICT Market Structure: Simplified institutional concepts with commitment tracking
🔥Key Features
● Comprehensive Pattern Detection: All major SMC concepts in one indicator with automatic identification
● Volume-Confirmed Signals: Multiple volume filters ensure only institutional-grade patterns are highlighted
● Interactive Dashboard: Real-time status display with active pattern counts and module status
● Smart Memory Management: Automatic cleanup of old patterns while preserving relevant market zones
● Full Alert System: Complete notification coverage for all pattern types and signal generations
● Customizable Display Options: Adjustable colors, transparency, and positioning for all visual elements
🎨Visualization
● Color-Coded Zones: Distinct color schemes for bullish/bearish patterns across all modules
● Dynamic Box Extensions: Automatically extending zones until mitigation or invalidation
● Equilibrium Lines: Fair Value Gap midpoint analysis with dotted line visualization
● Signal Markers: Clear spring/upthrust signals with directional arrows and probability indicators
● Dashboard Table: Professional-grade status panel with module activation and pattern counts
● Candle Coloring: Wick rejection highlighting with transparency-based visual emphasis
📖Usage Guidelines
Fair Value Gap Settings
● Days to Analyze: Default 15, Range 1-100 - Controls historical FVG detection period
● Volume Filter: Enables institutional volume confirmation for gap validity
● Min Volume Ratio: Default 1.5 - Minimum volume spike required for gap recognition
● Show Equilibrium Lines: Displays FVG midpoint analysis for precise entry targeting
Order Block Configuration
● Scan Range: Default 25 bars - Lookback period for structure break identification
● Volume Filter: Institutional volume confirmation for order block validation
● Mitigation Method: Wick or Close-based invalidation for different trading styles
● Min Volume Ratio: Default 1.5 - Volume threshold for significant order block formation
Wyckoff Analysis Parameters
● S/R Lookback: Default 20 - Support/resistance calculation period for spring/upthrust detection
● Volume Spike Multiplier: Default 1.5 - Required volume increase for pattern confirmation
● Probability Threshold: Default 0.7 - Minimum probability score for signal generation
● ATR Recovery Period: Default 5 - Price recovery calculation for pattern strength assessment
Market Structure Settings
● Auto-Detect Zones: Automatic identification of high-volume thin zones
● Proximity Threshold: Default 0.20% - Price proximity requirements for zone interaction
● Test Window: Default 20 bars - Time period for zone commitment calculation
Display Customization
● Dashboard Position: Four corner options for optimal chart layout
● Text Size: Scalable from Tiny to Large for different screen configurations
● Pattern Colors: Full customization of all bullish and bearish zone colors
✅Best Use Cases
● Swing Trading: Identify major institutional zones for multi-day position entries
● Day Trading: Precise intraday entries at Fair Value Gaps and Order Block boundaries
● Trend Analysis: Market structure confirmation for directional bias establishment
● Risk Management: Clear invalidation levels provided by all pattern boundaries
● Multi-Timeframe Analysis: Works across all timeframes from 1-minute to monthly charts
⚠️Limitations
● Market Condition Dependency: Performance varies between trending and ranging market environments
● Volume Data Requirements: Requires accurate volume data for optimal pattern confirmation
● Lagging Nature: Some patterns confirmed after initial price movement has begun
● Pattern Density: High-volatility markets may generate excessive pattern signals
● Educational Tool: Requires understanding of smart money concepts for effective application
💡What Makes This Unique
● Complete SMC Integration: First indicator to combine all major smart money concepts comprehensively
● Real-Time Dashboard: Instant visual feedback on all active institutional patterns
● Advanced Volume Analysis: Multi-layered volume confirmation across all detection modules
● Probability-Based Signals: Mathematical approach to Wyckoff pattern recognition accuracy
● Professional Memory Management: Sophisticated pattern cleanup without losing market relevance
🔬How It Works
1. Pattern Detection Phase:
● Multi-timeframe scanning for institutional footprints across all enabled modules
● Volume analysis integration confirms patterns meet institutional trading criteria
● Real-time pattern validation ensures only high-probability setups are displayed
2. Signal Generation Process:
● Automated zone creation with precise boundary definitions for each pattern type
● Dynamic extension system maintains relevance until mitigation or invalidation occurs
● Alert system activation provides immediate notification of new pattern formations
3. Dashboard Update Cycle:
● Live status monitoring tracks all active patterns and module states continuously
● Pattern count updates provide instant feedback on current market condition density
● Commitment tracking for market structure analysis shows institutional engagement levels
💡Note:
This indicator represents institutional trading concepts and should be used as part of a comprehensive trading strategy. Pattern recognition accuracy improves with understanding of smart money principles. Combine with proper risk management and multiple confirmation methods for optimal results.

Multi TF - HTF→LTF OrderblocksMulti TF — HTF→LTF Orderblocks
Identify higher-timeframe (HTF) order blocks and project them onto your lower-timeframe (LTF) chart—clean, fast, and publication-ready.
The script automatically detects swing breaks on your chosen HTF, builds the originating order block, and renders that zone on your current chart so you can execute on lower timeframes with higher-timeframe context.
--------------------
How it works
HTF swing structure is tracked via pivot highs/lows and a user-selected break confirmation (Close or Wick).
On a valid break, the script backtracks to the last opposite candle and creates the HTF order block (wick-to-wick or body-only depending on your setting).
The OB is projected to the LTF and extended bar-by-bar until:
Mitigation: price penetrates at least 50% of the zone → the box is marked “old” (dimmed) or optionally auto-deleted.
Close-break: price closes beyond the far edge → zone is optionally removed immediately.
Each zone includes a centerline and an inside label showing the original HTF (e.g., “M15”, “H1”).
Key features
True HTF→LTF overlay: trade M1/M5 with M15/H1/H4 context.
Mitigation logic (≥50%): first meaningful touch turns the zone “old” or deletes it (your choice).
Close-break handling: auto-remove zones broken by close, to keep charts clean.
Overlap control: choose how to handle overlapping zones on the same side:
Keep Latest, Union (merge), or Intersection (refine).
Wicks vs. Bodies: build zones from full candle range or just the body.
Lightweight UI: only the relevant inputs in the panel; sensible defaults.
Alert included: fires on the first 50% mitigation of any fresh zone.
Performance-friendly limits: cap the number of active zones to fit Pine limits.
Inputs (quick overview)
HTF for Order Blocks: timeframe to scan (e.g., 15, 60, 240, D).
Swing Length (Pivot L/R): pivot sensitivity for structure.
Break Confirmation: Close (recommended) or Wick.
Zones use Wicks: on/off for wick-to-wick zones.
OB Lookback before Break: how far to search for the opposite candle.
Max Active Zones: hard cap for chart cleanliness & performance.
Delete on Close-Break: remove zones that are invalidated by a close.
Delete after Mitigation: remove once a 50% touch occurs.
Handle Overlap: None, Keep Latest, Union (merge), Intersection (refine).
Colors & Border: fresh/old zone colors (default ~35% opacity) and optional borders.
Default profile (as shipped):
Break by Close, zones use wicks, Union overlap handling, 250 lookback, 250 max zones, borders off, and HTF label printed inside each zone.
How to use (suggested workflow)
Pick an HTF (e.g., H1 for intraday) and drop to your execution TF (e.g., M5/M1).
Wait for price to tap ≥50% of a fresh OB → look for your LTF trigger (CHOCH, iFVG, PA).
Place SL beyond the zone (or beyond the LTF swing) and manage to your targets (e.g., 2R–3R or to the next HTF OB).
Keep charts clean by enabling Delete on Close-Break and (optionally) Delete after Mitigation.
Alerts
“OB: Zone berührt (Erstkontakt)” — triggers on the first ≥50% mitigation of any fresh zone.
Create additional TradingView alerts with this condition to get notified in real time.
Notes & limitations
Built with request.security(..., lookahead_off) to avoid future-bar peeking; zones only form after a confirmed HTF break.
As with all pattern-based tools, use alongside your risk management and a defined entry model.
Pine has strict limits on drawings; use Max Active Zones to balance coverage and performance.
Credits
Designed for traders who want HTF precision with LTF execution—a clean, opinionated OB overlay that focuses on what matters: fresh zones, first touch, and invalidation.
High Probability Order Blocks [AlgoAlpha]🟠 OVERVIEW
This script detects and visualizes high-probability order blocks by combining a volatility-based z-score trigger with a statistical survival model inspired by Kaplan-Meier estimation. It builds and manages bullish and bearish order blocks dynamically on the chart, displays live survival probabilities per block, and plots optional rejection signals. What makes this tool unique is its use of historical mitigation behavior to estimate and plot how likely each zone is to persist, offering traders a probabilistic perspective on order block strength—something rarely seen in retail indicators.
🟠 CONCEPTS
Order blocks are regions of strong institutional interest, often marked by large imbalances between buying and selling. This script identifies those areas using z-score thresholds on directional distance (up or down candles), detecting statistically significant moves that signal potential smart money footprints. A bullish block is drawn when a strong up-move (zUp > 4) follows a down candle, and vice versa for bearish blocks. Over time, each block is evaluated: if price “mitigates” it (i.e., closes cleanly past the opposite side and confirmed with a 1 bar delay), it’s considered resolved and logged. These resolved blocks then inform a Kaplan-Meier-like survival curve, estimating the likelihood that future blocks of a given age will remain unbroken. The indicator then draws a probability curve for each side (bull/bear), updating it in real time.
🟠 FEATURES
Live label inside each block showing survival probability or “N.E.D.” if insufficient data.
Kaplan-Meier survival curves drawn directly on the chart to show estimated strength decay.
Rejection markers (▲ ▼) if price bounces cleanly off an active order block.
Alerts for zone creation and rejection signals, supporting rule-based trading workflows.
🟠 USAGE
Read the label inside each block for Age | Survival% (or N.E.D. if there aren’t enough samples yet); higher survival % suggests blocks of that age have historically lasted longer.
Use the right-side survival curves to gauge how probability decays with age for bull vs bear blocks, and align entries with the side showing stronger survival at current age.
Treat ▲ (bullish rejection) and ▼ (bearish rejection) as optional confluence when price tests a boundary and fails to break.
Turn on alerts for “Bullish Zone Created,” “Bearish Zone Created,” and rejection signals so you don’t need to watch constantly.
If your chart gets crowded, enable Prevent Overlap ; tune Max Box Age to your timeframe; and adjust KM Training Window / Minimum Samples to trade off responsiveness vs stability.

S&D Elite Pro Timing V4S&D Pro Elite — Pro Timing (PT)
A clean, signal-first Supply & Demand tool that maps institutional-style zones and prints a compact PT (Pro Timing) label only when a timing setup forms inside an active zone. Minimal UI, no clutter—just zones and timing where they matter.
Why
Some zones hold, some don’t. The trader’s job is to reduce noise. This tool is built to elevate signal-to-noise, remove distractions, and focus execution on the most structured areas of price.
What it does
Maps Supply & Demand zones across multiple timeframes with optional Quality Score (0–100) and opacity tinting.
Pro structures (Rally-Base-Rally / Drop-Base-Drop) via ATR-based impulse/continuation and a tight-base check.
PT labels (buy/sell) appear only when a Pro Timing setup forms in the zone (you choose what “inside” means: close inside / any overlap / wick only / full-body inside).
Mitigation-aware: optionally stop reacting to a zone after any touch, body touch, or a minimum penetration %.
One-switch control: Show Pro Zones master toggle, plus per-TF switches (3m…Weekly).
Alerts: PT Buy / PT Sell.
PT = Pro Timing
A compact price-timing confirmation detected when specific price-action conditions align within an S&D zone. Presented as a single, clean label—no counts or numerals.
How it works (brief)
Zone detection: impulse → base → continuation using ATR thresholds and base compactness; optional rule that the base sits inside the impulse range. Zones project right; broken zones auto-remove.
Quality Score: weighted blend of impulse strength, base tightness, and continuation body, with an inside-base bonus. You can filter out low-score zones and/or tint opacity by quality.
PT inside the zone: the PT label prints only when price meets your chosen zone-touch mode and the internal timing criteria.
Repainting
Forming Zones ON: boxes may change while the higher-TF candle is open (early heads-up by design).
Forming Zones OFF: zones and PT labels use confirmed data for the selected timeframes.
Settings (at a glance)
Pro Zone Options: Show Pro Zones (master), Forming Zones, per-TF toggles (3m…Weekly), Force Lower-TF Aggregation (1m base).
RBR/DBD Filter: Impulse min body × ATR(14), Base max body % of impulse, Base inside prior impulse (on/off), Continuation min body × ATR(14).
Quality Score: toggle, min score filter, opacity tint, adjustable weights (Impulse / Base / Continuation) + inside-base bonus.
PT × Zone Filter: Only show inside zones; trigger mode (Close inside / Overlap / Wick only / Body inside); stop after mitigation (Any touch / Body / Penetration ≥ %).
Visuals: Buy/Sell label colors + text colors; optional text inside zones (TF label, quality).
Recommended starting values
Zone Difference Scale: 1.6–2.0
Impulse min body × ATR: 1.6
Base max body %: 0.40–0.60
Continuation min body × ATR: 1.0–1.2
Min Quality Score: 60
Touch mode: Overlap (any part) for discovery; then tighten to Body inside or Wick only.
Usage tips
Start with 15m / 1h / 4h to build the backbone, add LTFs once structure is clear, and treat PT as timing confirmation inside structure—combine with trend/session/context and manage risk.
Script by Loganscottfx.
Educational tool; not financial advice. Markets involve risk.
Published as an indicator (not a strategy).