Compression Patterns (w/ Trend + Proximity Filter)🧠 Description:
This indicator identifies high-probability price compression patterns within trending environments — a setup prized by experienced swing and day traders alike. It combines the classic NR4, NR7, 2-Bar NR, 3-Bar NR, and Inside Day formations with a powerful trend filter and proximity logic to deliver clear, focused signals.
🔍 What's Inside:
▪️ Compression Patterns
The core of this tool lies in the logic of price compression. These patterns signal the market taking a breath — volatility contracts, volume dries up, and price coils like a spring.
When this happens in the right context, the next move is often explosive.
NR4 / NR7: Narrowest range in 4 or 7 bars — excellent for spotting the quiet before the storm.
2-Bar NR / 3-Bar NR: These identify the tightest consecutive 2 or 3-day ranges over the past 20 days — contextually rare and powerful.
Inside Day: A simple but highly effective consolidation pattern, especially when it clusters around key moving averages.
▪️ Trend Filter (EMA Stack)
You could say this is where most indicators fall apart — no context.
This one doesn’t make that mistake.
Signals only fire when the 10 EMA > 20 EMA > 50 EMA, and price is above the 20 EMA. That’s a strong, established uptrend — the only environment where breakouts are statistically favourable.
Why?
Because trend following works.
It may not give you fixed daily returns, but it’s the only strategy with theoretically infinite profit potential. You risk little, trade less, and position yourself for rare but massive moves. That’s the edge.
▪️ Proximity Filter (1 ATR to EMA)
We’ve added another layer of discipline. Signals only fire when price is:
Within 1 ATR of the 10 EMA (if price is above it), or
Within 1 ATR of the 20 EMA (if price is below the 10 EMA)
This ensures you’re not chasing. You’re waiting for tight, controlled pullbacks into dynamic support — exactly where institutions add size, not exit.
⚙️ Fully Customisable:
Toggle visibility of each pattern
Custom colours and transparency for label & background
Adjustable ATR length and multiplier
Change label text if needed (useful for translations or tweaks)
🎯 Ideal Use Case:
Swing trading off the daily chart
Day trading with VWAP/MACD filters (in alternate versions)
Supplementing price action strategies
🔚 Final Word:
This isn’t an “everything scanner.”
It’s a discerning sniper scope for traders who wait patiently for clean trends, tight consolidations, and perfect proximity — then strike.
Narrow

Custom Candle Body WidthOver the specified bar range, plots a vertical line from open to close using the specified colors and line width (in pixels).
In effect, these look like thinner/thicker candle bodies.
The default candle bodies are made transparent over this range to make them appear hidden.
The indicator is capable of referencing the bar colors from another plot, using a technique of encapsulating the RGBT color value in a float value (plot to data window only recommended).
Refer to example code (which is commented out) in the source code.

Narrow Range (NR) IndicatorNarrow Range (NR) trading strategy is a breakout-based method that assumes that the price of security trends up or down after a brief consolidation in a narrow range. This indicator can plot:
1. Narrow Range (NR) 4, 7, and 21
2. Narrow Range (NR) 4, 7, and 21 + Inside Bars (IB)
NR 4/NR 7/NR 21 day acts as a confirming factor on where the price will move further. Breakout of NR 4/NR 7/NR 21 candle with high volumes indicates bullishness, while the breakdown candle indicates bearishness.

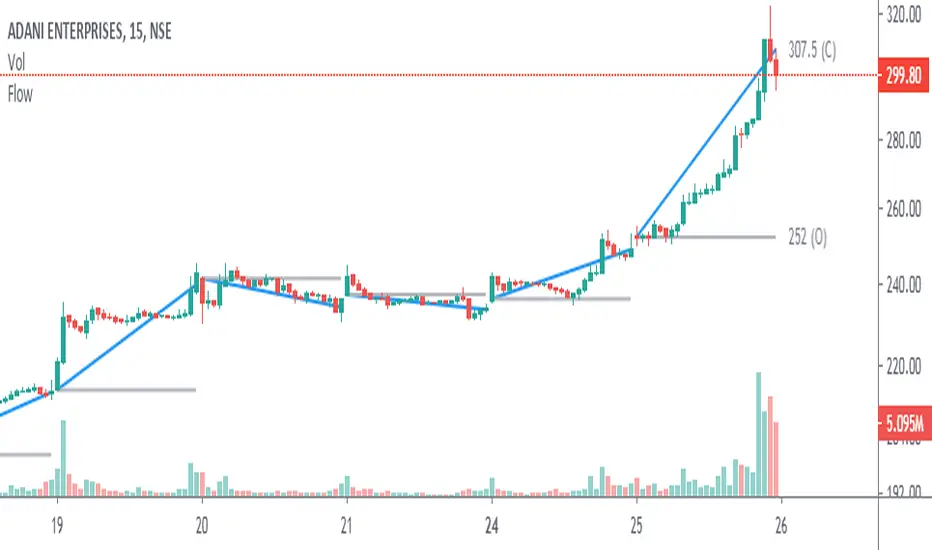
Angle & Price FlowThis is a simple end of the day indicator based on open and close values.
Angles:
Identifying narrow angles helps to find breakouts
Maximum angle = High chance of reversal
Minimum angle = Chance of breakouts on the next day or upcoming days.
Price Flow:
I personally use price flow to simplify the flow of candlestick chart and to identify breakouts using rounding bottoms and rounding top patterns, sharp corners for reversals.
Features:
Multi time frame
Labels
Hide previous period
Combine it with other indicators for better result.

NR(X) IndicatorNarrow Range Indicator can help determine when a possible Break Out can occur through narrowing price action.
The diamonds above the bar shows the bar to completed the Narrowest Range (high - low) of your selected time period. The default period is 7 but can be changed through the inputs. The next bar will indicate with a label weather it is a predicted Break UP (Green label) or Break Down (Red label).
The original creator of this style of indicator (thepatternsite.com) even admits the accuracy is only around 50%. To help increase those odds I combined his original work with an ATR(x) to help guesstimate the direction of breakout based on overall trend direction.
