TFMTFM Strategy Explanation
Overview
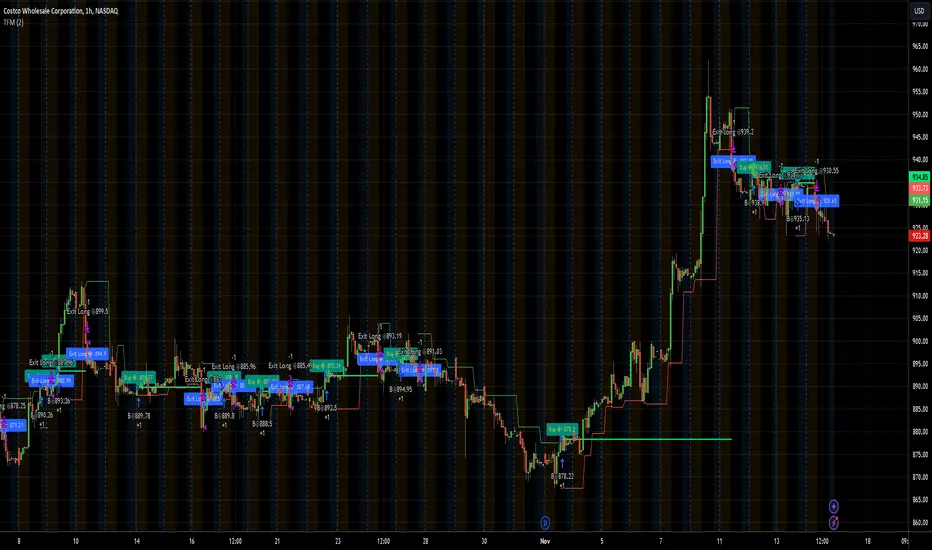
The TFM (Timeframe Multiplier) strategy is a PineScript trading bot that utilizes multiple timeframes to identify entry and exit points.
Inputs
1. tfm (Timeframe Multiplier): Multiplies the chart's timeframe to create a higher timeframe for analysis.
2. lns (Long and Short): Enables or disables short positions.
Logic
Calculations
1. chartTf: Gets the chart's timeframe in seconds.
2. tfTimes: Calculates the higher timeframe by multiplying chartTf with tfm.
3. MintickerClose and MaxtickerClose: Retrieve the minimum and maximum closing prices from the higher timeframe using request.security.
- MintickerClose: Finds the lowest low when the higher timeframe's close is below its open.
- MaxtickerClose: Finds the highest high when the higher timeframe's close is above its open.
Entries and Exits
1. Long Entry: When the current close price crosses above MaxtickerClose.
2. Short Entry (if lns is true): When the current close price crosses below MintickerClose.
3. Exit Long: When the short condition is met (if lns is false) or when the trade is manually closed.
Strategy
1. Attach the script to a chart.
2. Adjust tfm and lns inputs.
3. Monitor entries and exits.
Example Use Cases
1. Intraday trading with tfm = 2-5.
2. Swing trading with tfm = 10-30.
Tips
1. Experiment with different tfm values.
2. Use lns to control short positions.
3. Combine with other indicators for confirmation.
Multitimeframe
Supertrend StrategyThe Supertrend Strategy was created based on the Supertrend and Relative Strength Index (RSI) indicators, widely respected tools in technical analysis. This strategy combines these two indicators to capture market trends with precision and reliability, looking for optimizing exit levels at oversold or overbought price levels.
The Supertrend indicator identifies trend direction based on price and volatility by using the Average True Range (ATR). The ATR measures market volatility by calculating the average range between an asset’s high and low prices over a set period. It provides insight into price fluctuations, with higher ATR values indicating increased volatility and lower values suggesting stability. The Supertrend Indicator plots a line above or below the price, signaling potential buy or sell opportunities: when the price closes above the Supertrend line, an uptrend is indicated, while a close below the line suggests a downtrend. This line shifts as price movements and volatility levels change, acting as both a trailing stop loss and trend confirmation.
To enhance the Supertrend strategy, the Relative Strength Index (RSI) has been added as an exit criterion. As a momentum oscillator, the RSI indicates overbought (usually above 70) or oversold (usually below 30) conditions. This integration allows trades to close when the asset is overbought or oversold, capturing gains before a possible reversal, even if the percentage take profit level has not been reached. This mechanism aims to prevent losses due to market reversals before the Supertrend signal changes.
### Key Features
1. **Entry criteria**:
- The strategy uses the Supertrend indicator calculated by adding or subtracting a multiple of the ATR from the closing price, depending on the trend direction.
- When the price crosses above the Supertrend line, the strategy signals a long (buy) entry. Conversely, when the price crosses below, it signals a short (sell) entry.
- The strategy performs a reversal if there is an open position and a change in the direction of the supertrend occurs
2. **Exit criteria**:
- Take profit of 30% (default) on the average position price.
- Oversold (≤ 5) or overbought (≥ 95) RSI
- Reversal when there is a change in direction of the Supertrend
3. **No Repainting**:
- This strategy is not subject to repainting, as long as the timeframe configured on your chart is the same as the supertrend timeframe .
4. **Position Sizing by Equity and risk management**:
- This strategy has a default configuration to operate with 35% of the equity. At the time of opening the position, the supertrend line is typically positioned at about 12 to 16% of the entry price. This way, the strategy is putting at risk about 16% of 35% of equity, that is, around 5.6% of equity for each trade. The percentage of equity can be adjusted by the user according to their risk management.
5. **Backtest results**:
- This strategy was subjected to deep backtesting and operations in replay mode, including transaction fees of 0.12%, and slippage of 5 ticks.
- The past results in deep backtest and replay mode were compatible and profitable (Variable results depending on the take profit used, supertrend and RSI parameters). However, it should be noted that few operations were evaluated, since the currency in question has been created for a short time and the frequency of operations is relatively small.
- Past results are no guarantee of future results. The strategy's backtest results may even be due to overfitting with past data.
Default Settings
Chart timeframe: 2h
Supertrend Factor: 3.42
ATR period: 14
Supertrend timeframe: 2 h
RSI timeframe: 15 min
RSI Lenght: 5 min
RSI Upper limit: 95
RSI Lower Limit: 5
Take Profit: 30%
BYBIT:1000000MOGUSDT.P

Parent Session Sweeps + Alert Killzone Ranges with Parent Session Sweep
Key Features:
1. Multiple Session Support: The script tracks three major trading sessions - Asia, London, and New York. Users can customize the timing of these sessions.
2. Killzone Visualization: The strategy visually represents each session's range, either as filled boxes or lines, allowing traders to easily identify key price levels.
3. Parent Session Logic: The core of the strategy revolves around identifying a "parent" session - a session that encompasses the range of the following session. This parent session becomes the basis for potential trade setups.
4. Sweep and Reclaim Setups: The strategy looks for price movements that sweep (break above or below) the parent session's high or low, followed by a reclaim of that level. This price action often indicates a potential reversal.
5. Risk-Reward Filtering: Each potential setup is evaluated based on a user-defined minimum risk-reward ratio, ensuring that only high-quality trade opportunities are considered.
6. Candle Close Filter: An optional filter that checks the characteristics of the candle that reclaims the parent session level, adding an extra layer of confirmation to the setup.
7. Performance Tracking: The strategy keeps track of bullish and bearish setup success rates, providing valuable feedback on its performance over time.
8. Visual Aids: The script draws lines to mark the parent session's high and low, making it easy for traders to identify key levels.
How It Works:
1. The script continuously monitors price action across the defined sessions.
2. When a session fully contains the range of the next session, it's identified as a potential parent session.
3. The strategy then waits for price to sweep either the high or low of this parent session.
4. If a sweep occurs, it looks for a reclaim of the swept level within the parameters set by the user.
5. If a valid setup is identified, the script generates an alert and places a trade (if backtesting or running live).
6. The strategy continues to monitor the trade for either reaching the target (opposite level of the parent session) or hitting the stop loss.
Considerations for Signals:
- Sweep: A break of the parent session's high or low.
- Reclaim: A close back inside the parent session range after a sweep.
- Candle Characteristics: Optional filter for the reclaim candle (e.g., bullish candle for long setups).
- Risk-Reward: Each setup must meet or exceed the user-defined minimum risk-reward ratio.
- Session Timing: The strategy is sensitive to the defined session times, which should be set according to the trader's preferred time zone.
This strategy aims to capitalize on institutional order flow and liquidity patterns in the forex market, providing traders with a systematic approach to identifying potential reversal points with favorable risk-reward profiles.

Overnight Positioning w EMA - Strategy [presentTrading]I've recently started researching Market Timing strategies, and it’s proving to be quite an interesting area of study. The idea of predicting optimal times to enter and exit the market, based on historical data and various indicators, brings a dynamic edge to trading. Additionally, it is integrated with the 3commas bot for automated trade execution.
I'm still working on it. Welcome to share your point of view.
█ Introduction and How it is Different
The "Overnight Positioning with EMA " is designed to capitalize on market inefficiencies during the overnight trading period. This strategy takes a position shortly before the market closes and exits shortly after it opens the following day. What sets this strategy apart is the integration of an optional Exponential Moving Average (EMA) filter, which ensures that trades are aligned with the underlying trend. The strategy provides flexibility by allowing users to select between different global market sessions, such as the US, Asia, and Europe.
It is integrated with the 3commas bot for automated trade execution and has a built-in mechanism to avoid holding positions over the weekend by force-closing positions on Fridays before the market closes.
BTCUSD 20 mins Performance
█ Strategy, How it Works: Detailed Explanation
The core logic of this strategy is simple: enter trades before market close and exit them after market open, taking advantage of potential price movements during the overnight period. Here’s how it works in more detail:
🔶 Market Timing
The strategy determines the local market open and close times based on the selected market (US, Asia, Europe) and adjusts entry and exit points accordingly. The entry is triggered a specific number of minutes before market close, and the exit is triggered a specific number of minutes after market open.
🔶 EMA Filter
The strategy includes an optional EMA filter to help ensure that trades are taken in the direction of the prevailing trend. The EMA is calculated over a user-defined timeframe and length. The entry is only allowed if the closing price is above the EMA (for long positions), which helps to filter out trades that might go against the trend.
The EMA formula:
```
EMA(t) = +
```
Where:
- EMA(t) is the current EMA value
- Close(t) is the current closing price
- n is the length of the EMA
- EMA(t-1) is the previous period's EMA value
🔶 Entry Logic
The strategy monitors the market time in the selected timezone. Once the current time reaches the defined entry period (e.g., 20 minutes before market close), and the EMA condition is satisfied, a long position is entered.
- Entry time calculation:
```
entryTime = marketCloseTime - entryMinutesBeforeClose * 60 * 1000
```
🔶 Exit Logic
Exits are triggered based on a specified time after the market opens. The strategy checks if the current time is within the defined exit period (e.g., 20 minutes after market open) and closes any open long positions.
- Exit time calculation:
exitTime = marketOpenTime + exitMinutesAfterOpen * 60 * 1000
🔶 Force Close on Fridays
To avoid the risk of holding positions over the weekend, the strategy force-closes any open positions 5 minutes before the market close on Fridays.
- Force close logic:
isFriday = (dayofweek(currentTime, marketTimezone) == dayofweek.friday)
█ Trade Direction
This strategy is designed exclusively for long trades. It enters a long position before market close and exits the position after market open. There is no shorting involved in this strategy, and it focuses on capturing upward momentum during the overnight session.
█ Usage
This strategy is suitable for traders who want to take advantage of price movements that occur during the overnight period without holding positions for extended periods. It automates entry and exit times, ensuring that trades are placed at the appropriate times based on the market session selected by the user. The 3commas bot integration also allows for automated execution, making it ideal for traders who wish to set it and forget it. The strategy is flexible enough to work across various global markets, depending on the trader's preference.
█ Default Settings
1. entryMinutesBeforeClose (Default = 20 minutes):
This setting determines how many minutes before the market close the strategy will enter a long position. A shorter duration could mean missing out on potential movements, while a longer duration could expose the position to greater price fluctuations before the market closes.
2. exitMinutesAfterOpen (Default = 20 minutes):
This setting controls how many minutes after the market opens the position will be exited. A shorter exit time minimizes exposure to market volatility at the open, while a longer exit time could capture more of the overnight price movement.
3. emaLength (Default = 100):
The length of the EMA affects how the strategy filters trades. A shorter EMA (e.g., 50) reacts more quickly to price changes, allowing more frequent entries, while a longer EMA (e.g., 200) smooths out price action and only allows entries when there is a stronger underlying trend.
The effect of using a longer EMA (e.g., 200) would be:
```
EMA(t) = +
```
4. emaTimeframe (Default = 240):
This is the timeframe used for calculating the EMA. A higher timeframe (e.g., 360) would base entries on longer-term trends, while a shorter timeframe (e.g., 60) would respond more quickly to price movements, potentially allowing more frequent trades.
5. useEMA (Default = true):
This toggle enables or disables the EMA filter. When enabled, trades are only taken when the price is above the EMA. Disabling the EMA allows the strategy to enter trades without any trend validation, which could increase the number of trades but also increase risk.
6. Market Selection (Default = US):
This setting determines which global market's open and close times the strategy will use. The selection of the market affects the timing of entries and exits and should be chosen based on the user's preference or geographic focus.

Fibonacci Swing Trading BotStrategy Overview for "Fibonacci Swing Trading Bot"
Strategy Name: Fibonacci Swing Trading Bot
Version: Pine Script v5
Purpose: This strategy is designed for swing traders who want to leverage Fibonacci retracement levels and candlestick patterns to enter and exit trades on higher time frames.
Key Components:
1. Multiple Timeframe Analysis:
The strategy uses a customizable timeframe for analysis. You can choose between 4hour, daily, weekly, or monthly time frames to fit your preferred trading horizon. The high and low-price data is retrieved from the selected timeframe to identify swing points.
2. Fibonacci Retracement Levels:
The script calculates two key Fibonacci retracement levels:
0.618: A common level where price often retraces before resuming its trend.
0.786: A deeper retracement level, often used to identify stronger support/resistance areas.
These levels are dynamically plotted on the chart based on the highest high and lowest low over the last 50 bars of the selected timeframe.
3. Candlestick Based Entry Signals:
The strategy uses candlestick patterns as the only indicator for trade entries:
Bullish Candle: A green candle (close > open) that forms between the 0.618 retracement level and the swing high.
Bearish Candle: A red candle (close < open) that forms between the 0.786 retracement level and the swing low.
When these candlestick patterns align with the Fibonacci levels, the script triggers buy or sell signals.
4. Risk Management:
Stop Loss: The stop loss is set at 1% below the entry price for long trades and 1% above the entry price for short trades. This tight risk management ensures controlled losses.
Take Profit: The strategy uses a 2:1 risk-to-reward ratio. The take profit is automatically calculated based on this ratio relative to the stop loss.
5. Buy/Sell Logic:
Buy Signal: Triggered when a bullish candle forms above the 0.618 retracement level and below the swing high. The bot then places a long position.
Sell Signal: Triggered when a bearish candle forms below the 0.786 retracement level and above the swing low. The bot then places a short position.
The stop loss and take profit levels are automatically managed once the trade is placed.
Strengths of This Strategy:
Swing Trading Focus: The strategy is ideal for swing traders, targeting longer-term price moves that can take days or weeks to play out.
Simple Yet Effective Indicators: By only relying on Fibonacci retracement levels and basic candlestick patterns, the strategy avoids complexity while capitalizing on well-known support and resistance zones.
Automated Risk Management: The built-in stop loss and take profit mechanism ensures trades are protected, adhering to a strict 2:1 risk/reward ratio.
Multiple Timeframe Analysis: The script adapts to various market conditions by allowing users to switch between different timeframes (4hour, daily, weekly, monthly), giving traders flexibility.
Strategy Use Cases:
Retracement Traders: Traders who focus on entering the market at key retracement levels (0.618 and 0.786) will find this strategy especially useful.
Trend Reversal Traders: The strategy’s reliance on candlestick formations at Fibonacci levels helps traders spot potential reversals in price trends.
Risk Conscious Traders: With its 1% risk per trade and 2:1 risk/reward ratio, the strategy is ideal for traders who prioritize risk management in their trades.

Dual Chain StrategyDual Chain Strategy - Technical Overview
How It Works:
The Dual Chain Strategy is a unique approach to trading that utilizes Exponential Moving Averages (EMAs) across different timeframes, creating two distinct "chains" of trading signals. These chains can work independently or together, capturing both long-term trends and short-term price movements.
Chain 1 (Longer-Term Focus):
Entry Signal: The entry signal for Chain 1 is generated when the closing price crosses above the EMA calculated on a weekly timeframe. This suggests the start of a bullish trend and prompts a long position.
bullishChain1 = enableChain1 and ta.crossover(src1, entryEMA1)
Exit Signal: The exit signal is triggered when the closing price crosses below the EMA on a daily timeframe, indicating a potential bearish reversal.
exitLongChain1 = enableChain1 and ta.crossunder(src1, exitEMA1)
Parameters: Chain 1's EMA length is set to 10 periods by default, with the flexibility for user adjustment to match various trading scenarios.
Chain 2 (Shorter-Term Focus):
Entry Signal: Chain 2 generates an entry signal when the closing price crosses above the EMA on a 12-hour timeframe. This setup is designed to capture quicker, shorter-term movements.
bullishChain2 = enableChain2 and ta.crossover(src2, entryEMA2)
Exit Signal: The exit signal occurs when the closing price falls below the EMA on a 9-hour timeframe, indicating the end of the shorter-term trend.
exitLongChain2 = enableChain2 and ta.crossunder(src2, exitEMA2)
Parameters: Chain 2's EMA length is set to 9 periods by default, and can be customized to better align with specific market conditions or trading strategies.
Key Features:
Dual EMA Chains: The strategy's originality shines through its dual-chain configuration, allowing traders to monitor and react to both long-term and short-term market trends. This approach is particularly powerful as it combines the strengths of trend-following with the agility of momentum trading.
Timeframe Flexibility: Users can modify the timeframes for both chains, ensuring the strategy can be tailored to different market conditions and individual trading styles. This flexibility makes it versatile for various assets and trading environments.
Independent Trade Logic: Each chain operates independently, with its own set of entry and exit rules. This allows for simultaneous or separate execution of trades based on the signals from either or both chains, providing a robust trading system that can handle different market phases.
Backtesting Period: The strategy includes a configurable backtesting period, enabling thorough performance assessment over a historical range. This feature is crucial for understanding how the strategy would have performed under different market conditions.
time_cond = time >= startDate and time <= finishDate
What It Does:
The Dual Chain Strategy offers traders a distinctive trading tool that merges two separate EMA-based systems into one cohesive framework. By integrating both long-term and short-term perspectives, the strategy enhances the ability to adapt to changing market conditions. The originality of this script lies in its innovative dual-chain design, providing traders with a unique edge by allowing them to capitalize on both significant trends and smaller, faster price movements.
Whether you aim to capture extended market trends or take advantage of more immediate price action, the Dual Chain Strategy provides a comprehensive solution with a high degree of customization and strategic depth. Its flexibility and originality make it a valuable tool for traders seeking to refine their approach to market analysis and execution.
How to Use the Dual Chain Strategy
Step 1: Access the Strategy
Add the Script: Start by adding the Dual Chain Strategy to your TradingView chart. You can do this by searching for the script by name or using the link provided.
Select the Asset: Apply the strategy to your preferred trading pair or asset, such as #BTCUSD, to see how it performs.
Step 2: Configure the Settings
Enable/Disable Chains:
The strategy is designed with two independent chains. You can choose to enable or disable each chain depending on your trading style and the market conditions.
enableChain1 = input.bool(true, title='Enable Chain 1')
enableChain2 = input.bool(true, title='Enable Chain 2')
By default, both chains are enabled. If you prefer to focus only on longer-term trends, you might disable Chain 2, or vice versa if you prefer shorter-term trades.
Set EMA Lengths:
Adjust the EMA lengths for each chain to match your trading preferences.
Chain 1: The default EMA length is 10 periods. This chain uses a weekly timeframe for entry signals and a daily timeframe for exits.
len1 = input.int(10, minval=1, title='Length Chain 1 EMA', group="Chain 1")
Chain 2: The default EMA length is 9 periods. This chain uses a 12-hour timeframe for entries and a 9-hour timeframe for exits.
len2 = input.int(9, minval=1, title='Length Chain 2 EMA', group="Chain 2")
Customize Timeframes:
You can customize the timeframes used for entry and exit signals for both chains.
Chain 1:
Entry Timeframe: Weekly
Exit Timeframe: Daily
tf1_entry = input.timeframe("W", title='Chain 1 Entry Timeframe', group="Chain 1")
tf1_exit = input.timeframe("D", title='Chain 1 Exit Timeframe', group="Chain 1")
Chain 2:
Entry Timeframe: 12 Hours
Exit Timeframe: 9 Hours
tf2_entry = input.timeframe("720", title='Chain 2 Entry Timeframe (12H)', group="Chain 2")
tf2_exit = input.timeframe("540", title='Chain 2 Exit Timeframe (9H)', group="Chain 2")
Set the Backtesting Period:
Define the period over which you want to backtest the strategy. This allows you to see how the strategy would have performed historically.
startDate = input.time(timestamp('2015-07-27'), title="StartDate")
finishDate = input.time(timestamp('2026-01-01'), title="FinishDate")
Step 3: Analyze the Signals
Understand the Entry and Exit Signals:
Buy Signals: When the price crosses above the entry EMA, the strategy generates a buy signal.
bullishChain1 = enableChain1 and ta.crossover(src1, entryEMA1)
Sell Signals: When the price crosses below the exit EMA, the strategy generates a sell signal.
bearishChain2 = enableChain2 and ta.crossunder(src2, entryEMA2)
Review the Visual Indicators:
The strategy plots buy and sell signals on the chart with labels for easy identification:
BUY C1/C2 for buy signals from Chain 1 and Chain 2.
SELL C1/C2 for sell signals from Chain 1 and Chain 2.
This visual aid helps you quickly understand when and why trades are being executed.
Step 4: Optimize the Strategy
Backtest Results:
Review the strategy’s performance over the backtesting period. Look at key metrics like net profit, drawdown, and trade statistics to evaluate its effectiveness.
Adjust the EMA lengths, timeframes, and other settings to see how changes affect the strategy’s performance.
Customize for Live Trading:
Once satisfied with the backtest results, you can apply the strategy settings to live trading. Remember to continuously monitor and adjust as needed based on market conditions.
Step 5: Implement Risk Management
Use Realistic Position Sizing:
Keep your risk exposure per trade within a comfortable range, typically between 1-2% of your trading capital.
Set Alerts:
Set up alerts for buy and sell signals, so you don’t miss trading opportunities.
Paper Trade First:
Consider running the strategy in a paper trading account to understand its behavior in real market conditions before committing real capital.
This dual-layered approach offers a distinct advantage: it enables the strategy to adapt to varying market conditions by capturing both broad trends and immediate price action without one chain's activity impacting the other's decision-making process. The independence of these chains in executing transactions adds a level of sophistication and flexibility that is rarely seen in more conventional trading systems, making the Dual Chain Strategy not just unique, but a powerful tool for traders seeking to navigate complex market environments.

WODIsMA Strategy 3 MA Crossover & Bull-Bear Trend ConfirmationWODIsMA Strategy is a versatile trading strategy designed to leverage the strength of moving averages and volatility indicators to provide clear trading signals for both long and short positions. This strategy is suitable for traders looking for a systematic approach to trading with adjustable parameters to fit various market conditions and personal trading styles.
Key Features
Customizable Moving Averages:
The strategy allows users to select different types of moving averages (SMA, EMA, SMMA, WMA, VWMA) for short-term, mid-term, long-term, and bull-bear trend identification.
Each moving average can be customized with different lengths, sources (e.g., close, high, low), timeframes, and colors.
Position Management:
Users can specify the percentage of capital to use per trade and the percentage to close per partial exit.
The strategy supports both long and short positions with the ability to enable or disable each direction.
Volatility Filter:
Incorporates a volatility filter to ensure trades are only taken when market volatility is above a user-defined threshold, enhancing the strategy's effectiveness in dynamic market conditions.
Bull-Bear Trend Line:
Option to enable a bull-bear trend line that helps identify the overall market trend. Trades are taken based on the relationship between the long-term moving average and the bull-bear trend line.
Partial Exits and Full Close Logic:
The strategy includes logic for partial exits based on the crossing of mid-term and long-term moving averages.
Ensures that positions are fully closed when adverse conditions are detected, such as the price crossing below the bull-bear trend line.
Stop Loss Management:
Implements user-defined stop loss levels to manage risk effectively. The stop loss is dynamically adjusted based on the entry price and user input.
Detailed Description
Moving Average Calculation: The strategy calculates up to six different moving averages, each with customizable parameters. These moving averages help identify the short-term, mid-term, long-term trends, and overall market direction.
Trading Signals:
Long Signal: A long position is opened when the short-term moving average is above the long-term moving average, and the mid-term moving average crosses above the long-term moving average.
Short Signal: A short position is opened when the short-term moving average is below the long-term moving average, and the mid-term moving average crosses below the long-term moving average.
Volatility Condition: The strategy includes a volatility filter that activates trades only when volatility exceeds a specified threshold, ensuring trades are made in favorable market conditions.
Bull-Bear Trend Confirmation: When enabled, trades are filtered based on the relationship between the long-term moving average and the bull-bear trend line, adding another layer of confirmation.
Stop Loss and Exits:
The strategy manages risk by placing stop loss orders based on user-defined percentages.
Positions are partially or fully closed based on the crossing of moving averages and the relationship with the bull-bear trend line.
Originality and Usefulness
This strategy is original as it combines multiple moving averages and volatility indicators in a structured manner to provide reliable trading signals. Its versatility allows traders to adjust the parameters to match their trading preferences and market conditions. The inclusion of a volatility filter and bull-bear trend line adds significant value by reducing false signals and ensuring trades are taken in the direction of the overall market trend. The detailed descriptions and customizable settings make this strategy accessible and understandable for traders, even those unfamiliar with the underlying Pine Script code.
By providing clear entry, exit, and risk management rules, the WODIsMA Strategy enhances the trader's ability to navigate different market environments, making it a valuable addition to the TradingView community scripts.

Power Hour Money StrategyDescription of the Pine Script Code: "Power Hour Money Strategy"
This Pine Script strategy, "Power Hour Money Strategy," is designed to trade based on the alignment of multiple time frames (month, week, day, and hour). The strategy aims to enter long or short positions depending on whether all selected time frames are in sync (all green for long positions, all red for short positions). Additionally, the script includes configurations for trading during specific sessions and automatically closing positions at the end of the trading day.
Core Features:
1. Time Frame Sync Check:
- The strategy evaluates whether the current price is higher than the opening price for the month, week, day, and hour to determine if each time frame is "green" (bullish) or "red" (bearish).
2. Session Control:
- The user can select between different trading sessions:
- "NY Session 9:30-11:30"
- "Extended NY Session 8-4"
- "All Sessions"
- Trades are only executed if the current time falls within the selected session.
3. Trailing Stop Mechanism:
- The strategy includes an optional trailing stop mechanism for both long and short positions.
- The trailing stop is configured with a percentage loss from the current price to protect gains.
4. End-of-Day Position Management:
- An option is provided to automatically close all positions at the end of the trading day (5:45 PM Eastern Time).
Detailed Code Breakdown:
1. Input Settings:
- **Session Selection**: Allows the user to choose the trading session.
- **End-of-Day Close**: Option to automatically close positions at the end of the day.
- **Trailing Stop Loss**: Enables or disables the trailing stop loss feature and sets the percentage for long and short positions.
2. Time Frame Calculations:
- The script uses `request.security` to get the opening prices for higher time frames (monthly, weekly, daily, and hourly).
- It compares the current close price to these opening prices to determine if each time frame is green or red.
3. Session Time Definitions:
- Defines the start and end times for the NY session (9:30-11:30 AM) and the extended session (8:00 AM - 4:00 PM).
4. Trade Execution:
- The strategy checks if all selected time frames are in sync and if the current time falls within the trading session.
- If all conditions are met, it enters a long or short position.
5. Trailing Stop Loss Implementation:
- Adjusts the stop price based on the trailing percentage and the current position's size.
- Automatically exits positions if the trailing stop condition is met.
6. End-of-Day Close Implementation:
- Uses a timestamp to check if the current time is 5:45 PM Eastern Time.
- Closes all positions if the end-of-day condition is met.
7. Plotting and Logging:
- Plots indicators to visualize the green/red status of each time frame.
- Logs information about the status of each time frame for debugging and analysis.
Example Usage:
Entering a Long Position: If the month, week, day, and hour are all green and the current time is within the selected session, a long position is entered.
Entering a Short Position: If the month, week, day, and hour are all red and the current time is within the selected session, a short position is entered.
Trailing Stop: Protects gains by exiting the position if the price moves against the set trailing stop percentage.
End-of-Day Close: Automatically closes all open positions at 5:45 PM Eastern Time if enabled.
This strategy is particularly useful for traders who want to ensure that multiple time frames are in alignment before entering a trade and who wish to manage positions effectively throughout the trading day with specific session controls and trailing stops.

Multi Timeframe RSI Buy Sell Strategy [TradeDots]The "Multi Timeframe RSI Buy/Sell Strategy" is a trading strategy that utilizes Relative Strength Index (RSI) indicators from multiple timeframes to provide buy and sell signals.
This strategy allows for extensive customization, supporting up to three distinct RSIs, each configurable with its own timeframe, length, and data source.
HOW DOES IT WORK
This strategy integrates up to three RSIs, each selectable from different timeframes and customizable in terms of length and source. Users have the flexibility to define the number of active RSIs. These selections visualize as plotted lines on the chart, enhancing interpretability.
Users can also manage the moving average of the selected RSI lines. When multiple RSIs are active, the moving average is calculated based on these active lines' average value.
The color intensity of the moving average line changes as it approaches predefined buying or selling thresholds, alerting users to potential signal generation.
A buy or sell signal is generated when all active RSI lines simultaneously cross their respective threshold lines. Concurrently, a label will appear on the chart to signify the order placement.
For those preferring not to display order information or activate the strategy, an "Enable backtest" option is provided in the settings for toggling activation.
APPLICATION
The strategy leverages multiple RSIs to detect extreme market conditions across various timeframes without the need for manual timeframe switching.
This feature is invaluable for identifying divergences across timeframes, such as detecting potential short-term reversals within broader trends, thereby aiding traders in making better trading decisions and potentially avoiding losses.
DEFAULT SETUP
Commission: 0.01%
Initial Capital: $10,000
Equity per Trade: 60%
RISK DISCLAIMER
Trading entails substantial risk, and most day traders incur losses. All content, tools, scripts, articles, and education provided by TradeDots serve purely informational and educational purposes. Past performances are not definitive predictors of future results.
TradeDots Stochastic Z-Score

Kyrie Crossover ( @zaytradellc )Unlocking Market Dynamics: Kyrie Crossover Script by @zaytradellc
personalized trading success with the "Kyrie Crossover" script, meticulously crafted by @zaytrade. This innovative Pine Script, tailored to the birthdays of Kyrie and the script creator, combines the power of technical analysis with a touch of personalization to revolutionize your trading experience.
**Exponential Moving Average (EMA) Crossover Strategy:**
At the heart of the "Kyrie Crossover" script lies a sophisticated EMA crossover strategy. By utilizing a 10-period EMA and a 323-period EMA (symbolizing long term price action ), the strategy effectively captures market trends with precision and insight.
- **Short-Term EMA (10-period):** This EMA reacts swiftly to recent price changes, offering heightened sensitivity to short-term fluctuations. It excels in identifying immediate shifts in market sentiment, making it invaluable for pinpointing short-lived trends and potential reversal points.
- **Long-Term EMA (323-period):** In contrast, the long-term EMA provides a broader perspective by smoothing out short-term noise and focusing on longer-term trend direction. Its extended length filters out market noise effectively, providing a clear representation of the underlying trend's momentum and sustainability.
**Directional Movement Index (DMI) Metrics:**
The "Kyrie Crossover" script goes beyond traditional indicators by incorporating DMI metrics across multiple timeframes. By assessing trend strength and direction, traders gain valuable insights into market dynamics, allowing for informed decision-making.
**Simple Instructions to Profit:**
1. **Identify EMA Crossovers:** Look for instances where the short-term EMA (10-period) crosses above the long-term EMA (323-period) for a bullish signal, indicating a potential buying opportunity. Conversely, a crossover where the short-term EMA crosses below the long-term EMA signals a bearish trend and a potential selling opportunity.
2. **Confirm with DMI Metrics:** Validate EMA crossovers by checking DMI metrics across different timeframes (5 minutes, 15 minutes, 30 minutes, and 1 hour). Pay attention to color-coded indicators, with green indicating a bullish trend, red indicating a bearish trend, and white indicating no clear trend.
3. **Manage Risk:** Implement proper risk management techniques, such as setting stop-loss orders and position sizing based on your risk tolerance and trading objectives.
4. **Stay Informed:** Regularly monitor market conditions and adjust your trading strategy accordingly based on new signals and emerging trends.
Bitcoin Momentum StrategyThis is a very simple long-only strategy I've used since December 2022 to manage my Bitcoin position.
I'm sharing it as an open-source script for other traders to learn from the code and adapt it to their liking if they find the system concept interesting.
General Overview
Always do your own research and backtesting - this script is not intended to be traded blindly (no script should be) and I've done limited testing on other markets beyond Ethereum and BTC, it's just a template to tweak and play with and make into one's own.
The results shown in the strategy tester are from Bitcoin's inception so as to get a large sample size of trades, and potential returns have diminished significantly as BTC has grown to become a mega cap asset, but the script includes a date filter for backtesting and it has still performed solidly in recent years (speaking from personal experience using it myself - DYOR with the date filter).
The main advantage of this system in my opinion is in limiting the max drawdown significantly versus buy & hodl. Theoretically much better returns can be made by just holding, but that's also a good way to lose 70%+ of your capital in the inevitable bear markets (also speaking from experience).
In saying all of that, the future is fundamentally unknowable and past results in no way guarantee future performance.
System Concept:
Capture as much Bitcoin upside volatility as possible while side-stepping downside volatility as quickly as possible.
The system uses a simple but clever momentum-style trailing stop technique I learned from one of my trading mentors who uses this approach on momentum/trend-following stock market systems.
Basically, the system "ratchets" up the stop-loss to be much tighter during high bearish volatility to protect open profits from downside moves, but loosens the stop loss during sustained bullish momentum to let the position ride.
It is invested most of the time, unless BTC is trading below its 20-week EMA in which case it stays in cash/USDT to avoid holding through bear markets. It only trades one position (no pyramiding) and does not trade short, but can easily be tweaked to do whatever you like if you know what you're doing in Pine.
Default parameters:
HTF: Weekly Chart
EMA: 20-Period
ATR: 5-period
Bar Lookback: 7
Entry Rule #1:
Bitcoin's current price must be trading above its higher-timeframe EMA (Weekly 20 EMA).
Entry Rule #2:
Bitcoin must not be in 'caution' condition (no large bearish volatility swings recently).
Enter at next bar's open if conditions are met and we are not already involved in a trade.
"Caution" Condition:
Defined as true if BTC's recent 7-bar swing high minus current bar's low is > 1.5x ATR, or Daily close < Daily 20-EMA.
Trailing Stop:
Stop is trailed 1 ATR from recent swing high, or 20% of ATR if in caution condition (ie. 0.2 ATR).
Exit on next bar open upon a close below stop loss.
I typically use a limit order to open & exit trades as close to the open price as possible to reduce slippage, but the strategy script uses market orders.
I've never had any issues getting filled on limit orders close to the market price with BTC on the Daily timeframe, but if the exchange has relatively low slippage I've found market orders work fine too without much impact on the results particularly since BTC has consistently remained above $20k and highly liquid.
Cost of Trading:
The script uses no leverage and a default total round-trip commission of 0.3% which is what I pay on my exchange based on their tier structure, but this can vary widely from exchange to exchange and higher commission fees will have a significantly negative impact on realized gains so make sure to always input the correct theoretical commission cost when backtesting any script.
Static slippage is difficult to estimate in the strategy tester given the wide range of prices & liquidity BTC has experienced over the years and it largely depends on position size, I set it to 150 points per buy or sell as BTC is currently very liquid on the exchange I trade and I use limit orders where possible to enter/exit positions as close as possible to the market's open price as it significantly limits my slippage.
But again, this can vary a lot from exchange to exchange (for better or worse) and if BTC volatility is high at the time of execution this can have a negative impact on slippage and therefore real performance, so make sure to adjust it according to your exchange's tendencies.
Tax considerations should also be made based on short-term trade frequency if crypto profits are treated as a CGT event in your region.
Summary:
A simple, but effective and fairly robust system that achieves the goals I set for it.
From my preliminary testing it appears it may also work on altcoins but it might need a bit of tweaking/loosening with the trailing stop distance as the default parameters are designed to work with Bitcoin which obviously behaves very differently to smaller cap assets.
Good luck out there!

Inside Candle StrategyIntroduction
The Inside Candle Breakout Strategy leverages the concept of inside candles as a primary signal for potential breakouts. Unlike common trend-following or scalping strategies, this method focuses on the volatility squeeze indicated by inside candles and aims to capture the momentum that follows these periods of consolidation. The strategy's originality lies in its specific integration of timeframes for signal detection and its application across diverse market conditions without relying on conventional trend indicators.
Strategy Description and Mechanics
Inside Candle Identification: At the heart of this strategy is the detection of inside candles, defined as candles fully contained within the range of the preceding candle. This pattern signifies a temporary balance between buyers and sellers, often preceding significant price movements. The strategy scans for these candles within a user-specified timeframe in the input section of the settings of the strategy, allowing for tailored signal generation based on individual trading preferences.
Entry Points and Market Entries: Upon identifying an inside candle and only once this candle closes, the strategy prepares to enter a trade in the direction of the breakout. Trades are executed in the timeframe selected on the chart, ensuring that entry points are aligned with real-time market movements. This process highlights the strategy's adaptability, making it suitable for various trading styles, from day trading to swing trading.
Overlay Indicator for Enhanced Market Analysis: Accompanying the breakout signals is an overlay indicator comprising two moving averages and a volatility cloud. This feature serves as a secondary tool for market analysis, offering insights into the prevailing market trend and volatility levels. While it doesn't influence the entry or exit signals directly, it provides traders with additional context for refining their decisions, enhancing the strategy's utility. This assistance tool is composed by one moving average and a second line which is calculated adding or subtracting the historical volatility of the asset on the moving average, depending on his momentum.
Strategy Results and Commitment to Realism
Backtesting Protocol: In our commitment to transparency and realism, backtesting results are derived from a dataset that ensures a sufficient number of trades (over 100) to validate the strategy's effectiveness. This approach underscores our dedication to providing traders with reliable and actionable insights.
Risk Management and Trade Sizing: Recognizing the importance of sustainable trading practices, the strategy incorporates strict risk management guidelines. Trades are sized to ensure that only a small percentage of equity is risked on a single trade, adhering to widely accepted risk tolerance levels. The initial account size for this script is set to 10000$.
Strategy Defaults and Justification: The default properties of the strategy, including the risk-reward ratio, average length for moving averages, and other parameters, are carefully chosen based on extensive testing and analysis. These settings represent a balanced approach, aiming to optimize the strategy's performance across a variety of market conditions.
Strategy Components:
- Inside Candles: An inside candle occurs when a candle's high and low are completely contained within the high and low of the previous candle. This pattern indicates a period of consolidation or indecision in the market, often preceding a significant price movement. The strategy detects inside candles based on the user-selected timeframe, allowing traders to capture potential breakouts.
Indicator Overlays:
- Moving Average: A simple moving average (SMA) is calculated over a user-defined length (`Average Length`), providing a dynamic baseline to gauge the market's direction. The strategy offers an option (`Show Moving Average`) to display or hide this moving average on the chart, giving traders control over the visual complexity.
- Volatility Measurement: Alongside the moving average, the strategy assesses market volatility using the standard deviation of the closing prices over the same period defined by the `Average Length`. The moving average is adjusted upwards or downwards by this volatility measure, creating a dynamic channel that reflects the current market conditions.
- Color Gradients for Volatility: The strategy uses a color gradient to fill the area between the moving average and its volatility-adjusted counterpart. This gradient visually represents the volatility level, transitioning from gray (low volatility) to a lighter shade (higher volatility), aiding in the assessment of market sentiment and volatility.
Trading Entries:
- Long Entry: A long position is triggered when the closing price exceeds the high of an inside candle, indicating potential bullish momentum. The strategy places a stop-loss at the low of the inside candle and sets a take-profit level based on the predefined risk-reward ratio (`RR Ratio`).
- Short Entry: Conversely, a short position is initiated when the closing price falls below the low of an inside candle, suggesting bearish pressure. A stop-loss is set at the high of the inside candle, with the take-profit level adjusted according to the risk-reward ratio.
Customization Settings:
- Timeframe: Traders can select the desired timeframe for inside candle detection, tailoring the strategy to fit various trading styles and time horizons.
- RR Ratio: The risk-reward ratio is adjustable, allowing traders to manage the potential risk and return of each trade according to their risk tolerance.
- Average Length: This setting determines the period over which the moving average and volatility are calculated, affecting the sensitivity of the strategy to price movements.
- Visual Settings: Users can customize the appearance of the strategy on their charts, including the colors of the moving average and volatility lines, as well as the line width, enhancing chart readability and personal preference adherence.
Disclaimer
Trading involves significant risk, and it is crucial for traders to conduct their own due diligence before engaging with any strategy. The Inside Candle Breakout Strategy is presented for informational purposes only and does not constitute financial advice.

Triple MA HTF strategy - Dynamic SmoothingThe triple MA strategy is a simple but effective method to trade the trend. The advantage of this script over the existing triple MA strategies is that the user can open a lower time frame chart and select higher time frame inputs for different MA types mainting the visibility on the chart. The dynamic smoothing code makes sure the HTF trendlines are not jagged, but a fluid line visiable on the lower time frame chart. The script comes with a MA crossover and crossunder strategy explained below.
Moving Averages (MA) Crossover for Entry:
Long Entry: A long entry signal is triggered when the moving average line 1 crosses above the moving average line 2. This crossover indicates a potential shift in market sentiment towards the upside. However, to validate this signal, the strategy checks if the moving average 3 on a higher time frame (eg. 4 hour) is in an upward trend. This additional filter ensures that the trade aligns with the prevailing trend on a broader time scale, increasing the probability of success.
Short Entry: Conversely, a short entry signal occurs when the moving average line 1 crosses below the moving average line 2. This crossover suggests a possible downturn in market momentum. However, for a short trade to be confirmed, the strategy verifies that the moving average 3 on the higher time frame is in a downward trend. This confirmation ensures that the trade is in harmony with the overarching market direction.
Exit from Long Position: The strategy triggers an exit signal from a long position when the moving average line 1 crosses below the moving average line 2. This crossover indicates a potential reversal in the market trend, prompting the trader to close their long position and take profits or minimize losses.
Exit from Short Position: Similarly, an exit signal from a short position occurs when the moving average line 1 crosses above the moving average line 2. This crossover suggests a potential shift in market sentiment towards the upside, prompting the trader to exit their short position and manage their risk accordingly.
Features of the script
This Triple MA Strategy is basically the HTF Trend Filter displayed 3 times on the chart. For more infomation on how the MA with dynamic smoothing is calculated I recommend reading the following script:
For risk management I included a simple script to opt for % of eauity or # of contracts of in the instrument. For explanation on how the risk management settings work I refer to my ealier published script:
The strategy is a simplified example for setting up an entry and exit logic based on multiple moving avarages. Hence the script is meant for educational purposes only.

Heatmap MACD Strategy - Pineconnector (Dynamic Alerts)Hello traders
This script is an upgrade of this template script.
Heatmap MACD Strategy
Pineconnector
Pineconnector is a trading bot software that forwards TradingView alerts to your Metatrader 4/5 for automating trading.
Many traders don't know how to dynamically create Pineconnector-compatible alerts using the data from their TradingView scripts.
Traders using trading bots want their alerts to reflect the stop-loss/take-profit/trailing-stop/stop-loss to breakeven options from your script and then create the orders accordingly.
This script showcases how to create Pineconnector alerts dynamically.
Pineconnector doesn't support alerts with multiple Take Profits.
As a workaround, for 2 TPs, I had to open two trades.
It's not optimal, as we end up paying more spreads for that extra trade - however, depending on your trading strategy, it may not be a big deal.
TradingView Alerts
1) You'll have to create one alert per asset X timeframe = 1 chart.
Example : 1 alert for EUR/USD on the 5 minutes chart, 1 alert for EUR/USD on the 15-minute chart (assuming you want your bot to trade the EUR/USD on the 5 and 15-minute timeframes)
2) For each alert, the alert message is pre-configured with the text below
{{strategy.order.alert_message}}
Please leave it as it is.
It's a TradingView native variable that will fetch the alert text messages built by the script.
3) Don't forget to set the webhook URL in the Notifications tab of the TradingView alerts UI.
EA configuration
The Pyramiding in the EA on Metatrader must be set to 2 if you want to trade with 2 TPs => as it's opening 2 trades.
If you only want 1 TP, set the EA Pyramiding to 1.
Regarding the other EA settings, please refer to the Pineconnector documentation on their website.
Logger
The Pineconnector commands are logged in the TradingView logger.
You'll find more information about it from this TradingView blog post
Important Notes
1) This multiple MACDs strategy doesn't matter much.
I could have selected any other indicator or concept for this script post.
I wanted to share an example of how you can quickly upgrade your strategy, making it compatible with Pineconnector.
2) The backtest results aren't relevant for this educational script publication.
I used realistic backtesting data but didn't look too much into optimizing the results, as this isn't the point of why I'm publishing this script.
3) This template is made to take 1 trade per direction at any given time.
Pyramiding is set to 1 on TradingView.
The strategy default settings are:
Initial Capital: 100000 USD
Position Size: 1 contract
Commission Percent: 0.075%
Slippage: 1 tick
No margin/leverage used
For example, those are realistic settings for trading CFD indices with low timeframes but not the best possible settings for all assets/timeframes.
Concept
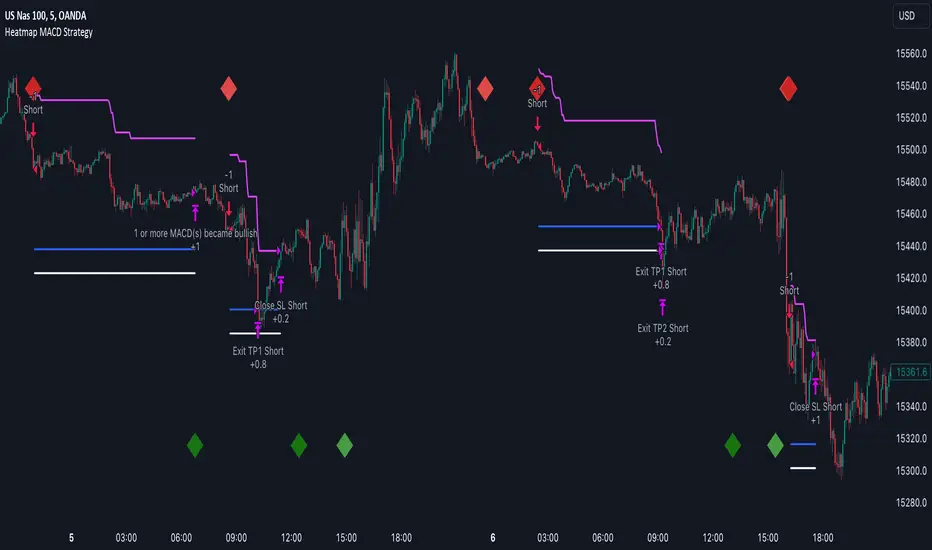
The Heatmap MACD Strategy allows selecting one MACD in five different timeframes.
You'll get an exit signal whenever one of the 5 MACDs changes direction.
Then, the strategy re-enters whenever all the MACDs are in the same direction again.
It takes:
long trades when all the 5 MACD histograms are bullish
short trades when all the 5 MACD histograms are bearish
You can select the same timeframe multiple times if you don't need five timeframes.
For example, if you only need the 30min, the 1H, and 2H, you can set your timeframes as follow:
30m
30m
30m
1H
2H
Risk Management Features
All the features below are pips-based.
Stop-Loss
Trailing Stop-Loss
Stop-Loss to Breakeven after a certain amount of pips has been reached
Take Profit 1st level and closing X% of the trade
Take Profit 2nd level and close the remaining of the trade
Custom Exit
I added the option ON/OFF to close the opened trade whenever one of the MACD diverges with the others.
Help me help the community
If you see any issue when adding your strategy logic to that template regarding the orders fills on your Metatrader, please let me know in the comments.
I'll use your feedback to make this template more robust. :)
What's next?
I'll publish a more generic template built as a connector so you can connect any indicator to that Pineconnector template.
Then, I'll publish a template for Capitalise AI, ProfitView, AutoView, and Alertatron.
Thank you
Dave

Heatmap MACD StrategyHello traders
A customer gave me the idea indirectly after I made an update to that script:
Supertrend MTF Heatmap
Important Notes
The backtest results aren't relevant for this educational script publication.
I used realistic backtesting data but didn't look too much into optimizing the results, as this isn't the point of why I'm publishing this script.
I wanted to showcase that any Heatmap script can be converted into a strategy.
The strategy default settings are:
Initial Capital: 100000 USD
Position Size: 1 contract
Commission Percent: 0.075%
Slippage: 1 tick
No margin/leverage used
For example, those are realistic settings for trading CFD indices with low timeframes, but not the best possible settings for all assets/timeframes.
Concept
The Heatmap MACD Strategy allows selecting one MACD in five different timeframes.
You'll get an exit signal whenever one of the 5 MACDs changes direction.
Then, the strategy re-enters whenever all the MACDs are in the same direction again.
It takes:
long trades when all the 5 MACD histograms are bullish
short trades when all the 5 MACD histograms are bearish
You can select the same timeframe multiple times if you don't need five timeframes.
For example, if you only need the 30min, the 1H, and 2H, you can set your timeframes as follow:
30m
30m
30m
1H
2H
Risk Management Features
Nothing too fancy
All the features below are pips-based
Stop-Loss
Trailing Stop-Loss
Stop-Loss to Breakeven after a certain amount of pips has been reached
Take Profit 1st level and closing X% of the trade
Take Profit 2nd level and close the remaining of the trade
What's next?
I'll publish this script's open-source Pineconnector, ProfitView, and AutoView versions for educational purposes.
Thank you
Dave
Risk Management and Positionsize - MACD exampleMastering Risk Management
Risk management is the cornerstone of successful trading, and it's often the difference between turning a profit and suffering a loss. In light of its importance, I share a risk management tool which you can use for your trading strategies. The script not only assists in position sizing but also comes with built-in technical features that help in market timing. Let's delve into the nitty-gritty details.
Input Parameter: MarginFactor
One of the key features of the script is the MarginFactor input parameter. This element lets you control the portion of your equity used for placing each trade. A MarginFactor of -0.5 means 50% of your total equity will be deployed in placing the position size. Although Tradingview has a built-in option to adjust position sizing in a same way, I personally prefer to have the logic in my pinecode script. The main reason is userexperience in managing and testing different settings for different charts, timeframes and instruments (with the same strategy).
Stoploss and MarginFactor
If your strategy has a 4% stop-loss, you can choose to use only 50% of your equity by setting the MarginFactor to -0.5. In this case, you are effectively risking only 2% of your total capital per trade, which aligns well with the widely-accepted rule of thumb suggesting a 1-2% risk per trade. Similar if your stoploss is only 1% you can choose to change the MarginFactor to 1, resulting in a positionsize of 200% of your equity. The total risk would be again 2% per trade if your stoploss is set to 1%.
Max Drawdown and MarginFactor
Your MarginFactor setting can also be aligned with the maximum drawdown of your strategy, seen during a backtested period of 2-3 years. For example, if the max drawdown is 15%, you could calibrate your MarginFactor accordingly to limit your risk exposure.
Option to Toggle Number of Contracts
The script offers the option to toggle between using a percentage of equity for position sizing or specifying a fixed number of contracts. Utilizing a percentage of equity might yield unrealistic backtest results, especially over longer periods. This occurs because as the capital grows, the absolute position size also increases, potentially inflating the accumulated returns generated by the backtester. On the other hand, setting a fixed number of contracts as your position size offers a more stable and realistic ROI over the backtested period, as it removes the compounding effect on position sizes.
Key Features Strategy
MACD High Time Frame Entry and Exit Logic
The strategy employs a high time frame MACD (Moving Average Convergence Divergence) to make entry and exit decisions. You can easily adjust the timeframe settings and MACD settings in the inputsection to trade on lower timeframes. For more information on the HTF MACD with dynamic smoothing see:
Moving Average High Time Frame Filter
To reduce market 'noise', the strategy incorporates a high time frame moving average filter. This ensures that the trades are aligned with the dominant market trend (trading the trend). In the inputsection traders can easily switch between different type of moving averages. For more information about this HTF filter see:
Dynamic Smoothing
The script includes a feature for dynamic smoothing. The script contains The timeframeToMinutes(tf) function to convert any given time frame into its equivalent in minutes. For example, a daily (D) time frame is converted into 1440 minutes, a weekly (W) into 10,080 minutes, and so forth. Next the smoothing factor is calculated by dividing the minutes of the higher time frame by those of the current time frame. Finally, the script applies a Simple Moving Average (SMA) over the MACD, SIGNAL, and HIST values, MA filter using the dynamically calculated smoothing factor.
User Convenience: One of the major benefits is that traders don't need to manually adjust the smoothing factor when switching between different time frames. The script does this dynamically.
Visual Consistency: Dynamic smoothing helps traders to more accurately visualize and interpret HTF indicators when trading on lower time frames.
Time Frame Restriction: It's crucial to note that the operational time frame should always be lower than the time frame selected in the input sections for dynamic smoothing to function as intended.
By incorporating this dynamic smoothing logic, the script offers traders a nuanced yet straightforward way to adapt High Time Frame indicators for lower time frame trading, enhancing both adaptability and user experience.
Limitations: Exit Strategy
It's crucial to note that the script comes with a simplified exit strategy, devoid of features like a stop-loss, trailing stop-loss or multiple take profits. This means that while the script focuses on entries and risk management, it might result in higher losses if market conditions unexpectedly turn unfavorable.
Conclusion
Effective risk management is pivotal for trading success, and this TradingView script is designed to give you a better idea how to implement positions sizing with your preferred strategy. However, it's essential to note that this tool should not be considered financial advice. Always perform your due diligence and consult with financial advisors before making any trading decisions.
Feel free to use this risk management tool as building block in your trading scripts, Happy Trading!

TASC 2023.09 The Weekly Factor█ OVERVIEW
TASC's September 2023 edition of Traders' Tips features an article written by Andrea Unger titled “The Weekly Factor", discussing the application of price patterns as filters for trade entries. This script implements a sample trading strategy presented in the article for demonstration purposes only. It explores how the strategy's equity curve might benefit from filtering trade entries using a specific price pattern.
█ CONCEPTS
Pattern filters represent valuable tools that assess current market conditions based on price movements and determine when those conditions become more favorable for trade entries.
The filter used and tested in this article is a metric called the "weekly factor", which measures the price range over the last five trading days and compares it to the open of the session five days ago and the close of the session one day ago (i.e., the "body" of the five-day period). When the five-day body is small compared to the five-day range, this could indicate "indecision" or "compression", potentially followed by a price expansion. Thus, the weekly factor metric can help identify areas in the market where a period of compression might signal a potential breakout.
This script demonstrates the use of the weekly factor for a sample intraday trading strategy (intended for educational and exploratory purposes only). In this strategy, the entry signal is triggered when a 15-minute bar breaks out of the previous day's high-low range, and the position is closed at the end of the day.
█ CALCULATIONS
The script uses two timeframes:
• The strategy entries are processed on the 15-minute timeframe.
• The weekly factor is obtained from the daily timeframe using the request.security function and the following formula:
math.abs(open - close ) < RangeFilter * (ta.highest(5) - ta.lowest(5) )
Here, RangeFilter is an input that can be optimized to find the favorable ratio between the five-day body and the five-day range. Smaller RangeFilter values will lead to fewer trade entries. A RangeFilter value of 1 is equivalent to turning off the filtering altogether.

Volume ValueWhen VelocityTitle: Volume ValueWhen Velocity Trading Strategy
▶ Introduction:
The " Volume ValueWhen Velocity " trading strategy is designed to generate long position signals based on various technical conditions, including volume thresholds, RSI (Relative Strength Index), and price action relative to the Simple Moving Average (SMA). The strategy aims to identify potential buy opportunities when specific criteria are met, helping traders capitalize on potential bullish movements.
▶ How to use and conditions
★ Important : Only on Spot Binance BINANCE:BTCUSDT
Name: Volume ValueWhen Velocity
Operating mode: Long on Spot BINANCE BINANCE:BTCUSDT
Timeframe: Only one hour
Market: Crypto
currency: Bitcoin only
Signal type: Medium or short term
Entry: All sections in the Technical Indicators and Conditions section must be saved to enter (This is explained below)
Exit: Based on loss limit and profit limit It is removed in the settings section
Backtesting:
⁃ Exchange: BINANCE BINANCE:BTCUSDT
⁃ Pair: BTCUSDT
⁃ Timeframe:1h
⁃ Fee: 0.1%
- Initial Capital: 1,000 USDT
- Position sizing: 500 usdt
-Trading Range: 2022-07-01 11:30 ___ 2023-07-21 14:30
▶ Strategy Settings and Parameters:
1. `strategy(title='Volume ValueWhen Velocity', ...`: Sets the strategy title, initial capital, default quantity type, default quantity value, commission value, and trading currency.
↬ Stop-Loss and Take-Profit Settings:
1. long_stoploss_value and long_stoploss_percentage : Define the stop-loss percentage for long positions.
2. long_takeprofit_value and long_takeprofit_percentage : Define the take-profit percentage for long positions.
↬ ValueWhen Occurrence Parameters:
1. occurrence_ValueWhen_1 and occurrence_ValueWhen_2 : Control the occurrences of value events.
2. `distance_value`: Specifies the minimum distance between occurrences of ValueWhen 1 and ValueWhen 2.
↬ RSI Settings:
1. rsi_over_sold and rsi_length : Define the oversold level and RSI length for RSI calculations.
↬ Volume Thresholds:
1. volume_threshold1 , volume_threshold2 , and volume_threshold3 : Set the volume thresholds for multiple volume conditions.
↬ ATR (Average True Range) Settings:
1. atr_small and atr_big : Specify the periods used to calculate the Average True Range.
▶ Date Range for Back-Testing:
1. start_date, end_date, start_month, end_month, start_year, and end_year : Define the date range for back-testing the strategy.
▶ Technical Indicators and Conditions:
1. rsi: Calculates the Relative Strength Index (RSI) based on the defined RSI length and the closing prices.
2. was_over_sold: Checks if the RSI was oversold in the last 10 bars.
3. getVolume and getVolume2 : Custom functions to retrieve volume data for specific bars.
4. firstCandleColor : Evaluates the color of the first candle based on different timeframes.
5. sma : Calculates the Simple Moving Average (SMA) of the closing price over 13 periods.
6. numCandles : Counts the number of candles since the close price crossed above the SMA.
7. atr1 : Checks if the ATR_small is less than ATR_big for the specified security and timeframe.
8. prevClose, prevCloseBarsAgo, and prevCloseChange : ValueWhen functions to calculate the change in the close price between specific occurrences.
9. atrval: A condition based on the ATR_value3.
▶ Buy Signal Condition:
Condition: A combination of multiple volume conditions.
buy_signal: The final buy signal condition that considers various technical conditions and their interactions.
▶ Long Strategy Execution:
1. The strategy will enter a long position (buy) when the buy_signal condition is met and within the specified date range.
2. A stop-loss and take-profit will be set for the long position to manage risk and potential profits.
▶ Conclusion:
The " Volume ValueWhen Velocity " trading strategy is designed to identify long position opportunities based on a combination of volume conditions, RSI, and price action. The strategy aims to capitalize on potential bullish movements and utilizes a stop-loss and take-profit mechanism to manage risk and optimize potential returns. Traders can use this strategy as a starting point for their own trading systems or further customize it to suit their preferences and risk appetite. It is crucial to thoroughly back-test and validate any trading strategy before deploying it in live markets.
↯ Disclaimer:
Risk Management is crucial, so adjust stop loss to your comfort level. A tight stop loss can help minimise potential losses. Use at your own risk.
How you or we can improve? Source code is open so share your ideas!
Leave a comment and smash the boost button!

Yesterday's High v.17.07Yesterday’s High Breakout it is a trading system based on the analysis of yesterday's highs, it works in trend-following mode therefore it opens a long position at the breakout of yesterday's highs even if they occur several times in one day.
There are several methods for exiting a trade, each with its own unique strategy. The first method involves setting Take-Profit and Stop-Loss percentages, while the second utilizes a trailing-stop with a specified offset value. The third method calls for a conditional exit when the candle closes below a reference EMA.
Additionally, operational filters can be applied based on the volatility of the currency pair, such as calculating the percentage change from the opening or incorporating a gap to the previous day's high levels. These filters help to anticipate or delay entry into the market, mitigating the risk of false breakouts.
In the specific case of INJ, a 12% Take-Profit and a 1.5% Stop-Loss were set, with an activated trailing-stop percentage, TRL 1 and OFF 0.5.
To postpone entry and avoid false breakouts, a 1% gap was added to the price of yesterday's highs.
Name: Yesterday's High Breakout - Trend Follower Strategy
Author: @tumiza999
Category: Trend Follower, Breakout of Yesterday's High.
Operating mode: Spot or Futures (only long).
Trade duration: Intraday.
Timeframe: 30M, 1H, 2H, 4H
Market: Crypto
Suggested usage: Short-term trading, when the market is in trend and it is showing high volatility.
Entry: When there is a breakout of Yesterday's High.
Exit: Profit target or Trailing stop, Stop loss or Crossunder EMA.
Configuration:
- Gap to anticipate or postpone the entry before or after the identified level
- Rate of Change for Entry Condition
- Take Profit, Stop Loss and Trailing Stop
- EMA length
Backtesting:
⁃ Exchange: BINANCE
⁃ Pair: INJUSDT
⁃ Timeframe: 4H
- Treshold: 1
- Gap%: 1
- SL: 1.5
- TP:12
- TRL: 1
- OFF-TRL: 0.5
⁃ Fee: 0.075%
⁃ Slippage: 1
- Initial Capital: 10000 USDT
- Position sizing: 10% of Equity
- Start : 2018-07-26 (Out Of Sample from 2022-12-23)
- Bar magnifier: on
Credits: LucF for Pine Coders (f_security function to avoid repainting using security)
Disclaimer: Risk Management is crucial, so adjust stop loss to your comfort level. A tight stop loss can help minimise potential losses. Use at your own risk.
How you or we can improve? Source code is open so share your ideas!
Leave a comment and smash the boost button!
Thanks for your attention, happy to support the TradingView community.

MTF Diagonally Layered RSI - 1 minute Bitcoin Bot [wbburgin]This is a NON-REPAINTING multi-timeframe RSI strategy (long-only) that enters a trade only when two higher timeframes are oversold. I wrote it on BTC/USD for 1min, but the logic should work on other assets as well. It is diagonally layered to be profitable for when the asset is in a downtrend.
Diagonal layering refers to entry and exit conditions spread across different timeframes. Normally, indicators can become unprofitable because in downtrends, the overbought zones of the current timeframe are not reached. Rather, the overbought zones of the faster timeframes are reached first, and then a selloff occurs. Diagonally-layered strategies mitigate this by selling diagonally, that is, selling once the faster timeframe reaches overbought and buying once the slower timeframe reaches oversold.
Thus this strategy is diagonally layered down . I may create a separate script that alternates between diagonal-up and diagonal-down based off of overall trend, as in extended trend periods up this indicator may not flash as frequently. This can be visualized in a time series x timeframe chart as an "X" shape. Something to consider...
Let me know if you like this strategy. Feel free to alter the pyramiding entries, initial capital, and entry size, as well as commission regime. My strategies are designed to maximize average profit instead of flashing super frequently, as the fees will eat you up. Additionally, at the time of publication, all of my strategy scripts are intended to have profitable Sharpe and Sortino ratios.
Timeframes, RSI period, and oversold/overbought bounds are configurable.

Strategy for UT Bot Alerts indicator Using the UT Bot alerts indicator by @QuantNomad, this strategy was designed for showing an example of how this indicator could be used, also, it has the goal to help some people from a group that use to use this indicator for their trading. Under any circumstance I recommend to use it without testing it before in real time.
Backtesting context: 2020-02-05 to 2023-02-25 of BTCUSD 4H by Tvc. Commissions: 0.03% for each entry, 0.03% for each exit. Risk per trade: 2.5% of the total account
For this strategy, 3 indicators are used:
UT Bot Alerts indicator by Quantnomad
One Ema of 200 periods for indicate the trend
Atr stop loss from Gatherio
Trade conditions:
For longs:
Close price is higher than Atr from UT Bot
Ema from UT Bot cross over Atr from UT Bot.
This gives us our long signal. Stop loss will be determined by atr stop loss (white point), break even(blue point) by a risk/reward ratio of 0.75:1 and take profit of 3:1 where half position will be closed. This will be showed as buy (open long position)
The other half will be closed when close price is lower than Atr and Ema from UT Bot cross under Atr. This will be showed as cl buy (close long position)
For shorts:
Close price is lower than Atr from UT Bot
Ema from UT Bot cross over Atr from UT Bot.
This gives us our short signal. Stop loss will be determined by atr stop loss (white point), break even(blue point) by a risk/reward ratio of 0.75:1 and take profit of 3:1 where half position will be closed. This will be showed as sell (open short position)
The other half will be closed when close price is higher than Atr and Ema from UT Bot cross over Atr. This will be showed as cl sell (close short position)
Risk management
For calculate the amount of the position you will use just a small percent of your initial capital for the strategy and you will use the atr stop loss for this.
Example: You have 1000 usd and you just want to risk 2,5% of your account, there is a long signal at price of 20,000 usd. The stop loss price from atr stop loss is 19,000. You calculate the distance in percent between 20,000 and 19,000. In this case, that distance would be of 5,0%. Then, you calculate your position by this way: (initial or current capital * risk per trade of your account) / (stop loss distance).
Using these values on the formula: (1000*2,5%)/(5,0%) = 500usd. It means, you have to use 500 usd for risking 2.5% of your account.
We will use this risk management for apply compound interest.
In settings, with position amount calculator, you can enter the amount in usd of your account and the amount in percentage for risking per trade of the account. You will see this value in green color in the upper left corner that shows the amount in usd to use for risking the specific percentage of your account.
Script functions
Inside of settings, you will find some utilities for display atr stop loss, break evens, positions, signals, indicators, etc.
You will find the settings for risk management at the end of the script if you want to change something. But rebember, do not change values from indicators, the idea is to not over optimize the strategy.
If you want to change the initial capital for backtest the strategy, go to properties, and also enter the commisions of your exchange and slippage for more realistic results.
In risk managment you can find an option called "Use leverage ?", activate this if you want to backtest using leverage, which means that in case of not having enough money for risking the % determined by you of your account using your initial capital, you will use leverage for using the enough amount for risking that % of your acount in a buy position. Otherwise, the amount will be limited by your initial/current capital
---> Do not forget to deactivate Trades on chart option in style settings for a cleaner look of the chart <---
Some things to consider
USE UNDER YOUR OWN RISK. PAST RESULTS DO NOT REPRESENT THE FUTURE.
DEPENDING OF % ACCOUNT RISK PER TRADE, YOU COULD REQUIRE LEVERAGE FOR OPEN SOME POSITIONS, SO PLEASE, BE CAREFULL AND USE CORRECTLY THE RISK MANAGEMENT
Do not forget to change commissions and other parameters related with back testing results!
Strategies for trending markets use to have more looses than wins and it takes a long time to get profits, so do not forget to be patient and consistent !
---> The strategy can still be improved, you can change some parameters depending of the asset and timeframe like risk/reward for taking profits, for break even, also the main parameters of the UT Bot Alerts <----

Bollinger Band BreakoutThis strategy buys when price crosses above an upper Bollinger Band and sells when the lower band is breached. What makes this strategy different than others:
Long only with filtering for only showing strong tickers
Filter out trades below a moving average on both the current timeframe and a longer period timeframe to keep you out of bear markets
Optional ability to set a tighter initial stop level to increase exposure and decrease downside risk on freshly opened trades while you wait for the lower Bollinger Band trailing stop to catch up
Take entries/exits on wicks/stops or wait for candle closes before entry
Select which dates to backtest
Customize Bollinger Band parameters including the ability to have different values for the upper and lower band standard deviation
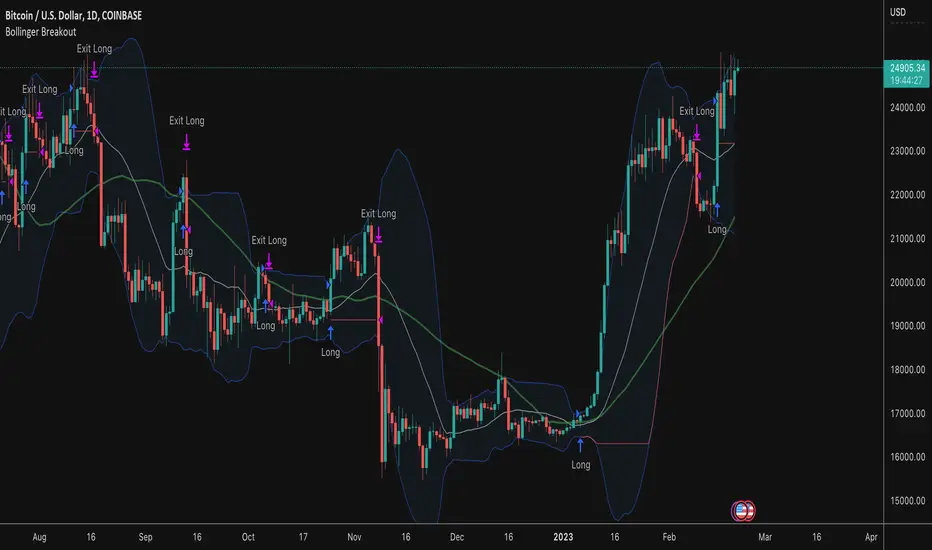
BankNifty_Bullish_Intraday
The script uses following mechanism to give a signal of BUY if multiple parameters evaluated are all passed.
ENTRY-
1. 5 min MACD should be more than its previous tick
2. 15 min MACD should be more than its previous tick
3. 60 min MACD should be more than its previous tick
4. ADX should be more than 12
5. RSI should be more than 60
6. Stochastic %k should have cross over with %d
7. Bollinger band upper band value should be more than previous tick
EXIT
If the 5 min bar price closes below 5 min EMA , it gives an exit signal.