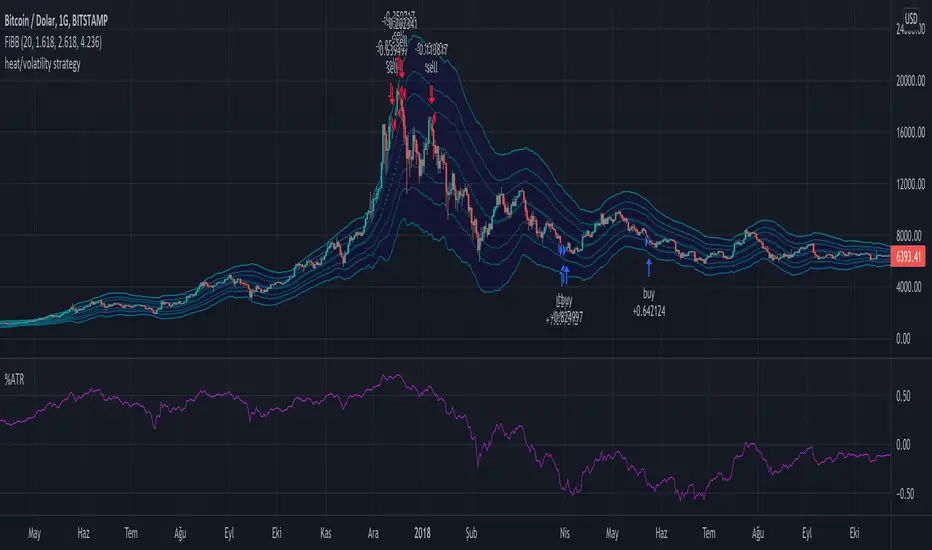
Long Term Heat/Volatility - Accumulation/Distribution v1This is a strategy specifically made for 1D BTC/USD with the aim of capturing cycle tops and bottoms. It's mainly based on two indicators: 21d average of ATR (volatility) and (BTC.price - 180d sma)/BTC.price (heat). The strategy only signals buys or sells after occurrences of high volatility, followed by extremely high or low heat values. It's optimized for utilizing accumulation and distribution at lower and higher prices respectively with respect to last 14 days. 2nd version will include dynamic dollar cost averaging during the accumulation and distribution periods.
Médias Móveis
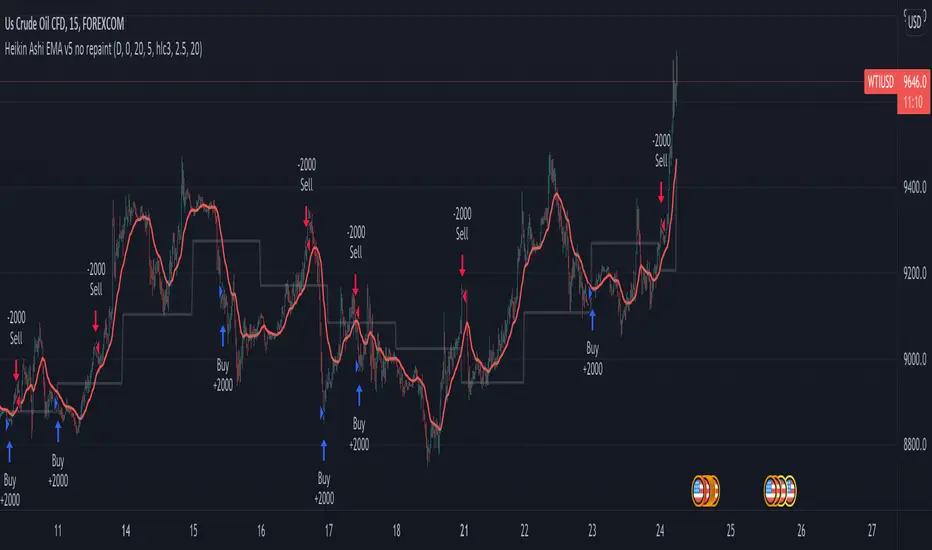
Heikin Ashi EMA v5 no repaint This script was inspired by the "Heikin/Kaufman Strategy" from marco valente built on v2.
The script was rebuilt on the v5 and most importantly removed the repaint function that was driving surrealistic backtesting inflated numbers.
This script is now fully functional and not repainting - At the time of testing worked efficiently 90% WR and 2x profit factor on CFD WTI OIL with a 15m time frame indexed on forex.com price.
You should utilize this script with caution, especially on high volatility cycles you can try plotting against a volatility relative index or stop.
I also strongly recommend understanding the fundamentals of WTI OIL to balance the indications of the strategy with fundamentals.
Thanks to Clovis Warlop and Nilesh Sharma for their contribution.
Cheers,
Gustavo Bramao
STR:EMA Oscilator [Azzrael]Strategy based on EMA and EMA Oscilator
(EMA - close) + Std Dev + Factor = detecting oversell/overbuy
Long only!
Pyramiding - sometimes, depends on ...
There're 2 enter strategies in one script:
1 - Classic, buy on entering to OverSell zone (more profitable ~> 70%)
2 - Crazy, buy on entering to OverBuy zone (catching trend and pyramiding, more net profit)
Exit - crossing zero of (EMA - close)

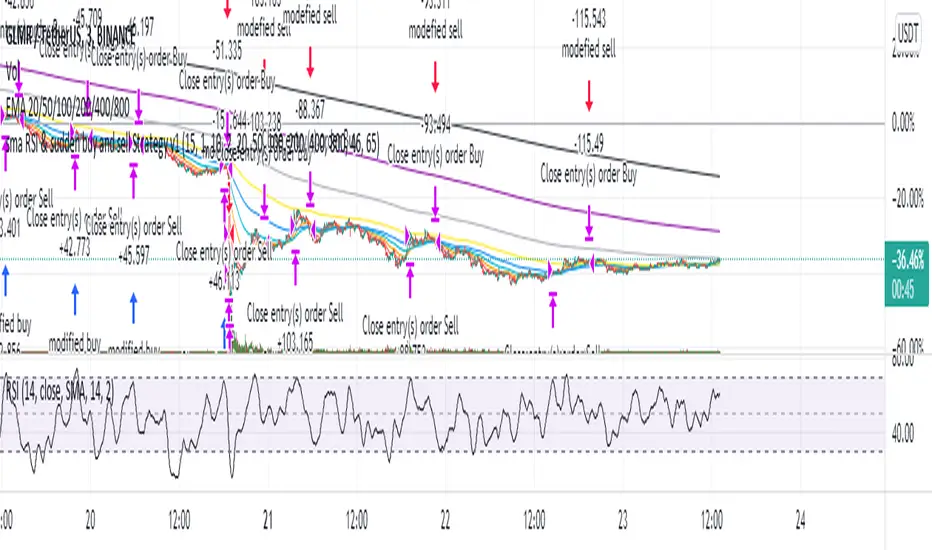
sma RSI & sudden buy and sell Strategy v1This strategy uses mostly three things:-
1. average RSI (sma rsi over a period)
2. sudden buy and sudden sell (usually to infer the change in trend or direction)
3. various EMAs ( used as a filter)
I mostly build it to work on a 3min crypto chart but it should work on any timeframe or any symbol.
Settings - Length -RSI length (hardly needed to be changed but sometimes it doubles the net profit)(+/-2)
instant length - a sudden increase or decrease in the price calculated by the length of RSI (+/-10)
Bars - No of candles to verify before starting /closing the strategy (+/-20)
Lookbackno2 - another variable to verify ema opening/closing (hardly needed to change)
emas - values of different EMAs (you can change if you want but I don't recommend it though)
over40 and over60 - the value of overbuying and overselling(+/-10)
In future, I will probably add ADX or use machine learning to filter out results
It works well considering 0.05% commission per entry and exit (total of 1% per trade)
you can message me for any query or suggestions.
Jerry J5 Dashboard & Buy Sell Strategy
----- Strategy
The strategy allows you to select from multiple moving averages and uses the concave function and the price being above or below a user defined EMA to provide buy and sell signals. You can select long trades, short trades, or both.
Concavity describes the direction of the curve and how it bends. And, just like a direction the concavity of curves can change and we call these changing points (technically they are inflection points). These changing points are used in conjunction with the stock price relationship to user defined EMAs and provide buy and sell signals when the trend is changing.
Moving Averages available in this strategy are the Exponential Moving Average (EMA), Simple Moving Average (SMA), Weighted Moving Average (WMA), Hull Moving Average (HMA), and Arnaud Legoux Moving Average (ALMA). Best results are typically with HMA and ALMA.
The indicator can be used for every type of market: indices, stocks, cryptocurrencies, currencies and others.
----- 27 Data Point Dashboard
Short Term Trend
Total Trades
Profit Factor
Win Rate %
Net Profit $, % & ROI
Buy & Hold Profit
Max Win $ & %
Max Loss $ & %
Avg Trade $, ROI%, & Bars
Avg Win $, ROI%, & Bars
Avg Loss $, ROI%, & Bars
Max Drawdown $ & %
Open Trade P&L $ & ROI%
For the dashboard you are able to set the target profit factor, win rate, net profit target ROI, winning trade target ROI, Strategy Start Date, and the Buy and Hold Start Date. The inputs are used to color dashboard labels making it easier to identify winning and losing trades based on your criteria.
Option Traders will likely appreciate the ROI% and number of bars being readily available. For example if the Average Winning Trade has a 5% ROI over 5 bars this can help you decide when to enter a trade and how long to stay in the trade.
Some of the label data is available in the TradingView Strategy Tester. However, I wanted a custom dashboard that was always visible on my chart and the J5 dashboard displays a total of 27 data points plus buy and sell signals .
Note: We calculate the ROI for Net Profit, Avg Trade, Avg Win, Avg Loss, and Open Trade based on the capital used for those trade(s). TradingView uses a different method and calculates the return percentage based on initial capital.
Indicators are not a magic pill and should be used to support trading decisions, not to make them for you. Past performance is not a guarantee of future returns. The results of individual stocks with any strategy do not constitute proof they will repeat in the future.
I hope you enjoy the J5.
DISCLAIMER: The information contained in our scripts/indicators/ideas does not constitute financial advice or a solicitation to buy or sell any securities of any type. Trading and investing in the stock market and cryptocurrencies involves substantial risk of loss and is not suitable for every investor. I’m NOT a financial adviser. All trading strategies are used at your own risk.
Please Use the link below for more information.

Mix1 : Ema Cross + Trend Channel [Gu5] - BacktestBacktest of the indicator "Mix1: Ema Cross + Trend Channel "
Trend indicator, by the crossing of moving averages
SMA200 with a channel as a filter confirms the trend.
The crossing of two moving averages, give alert only in trend.

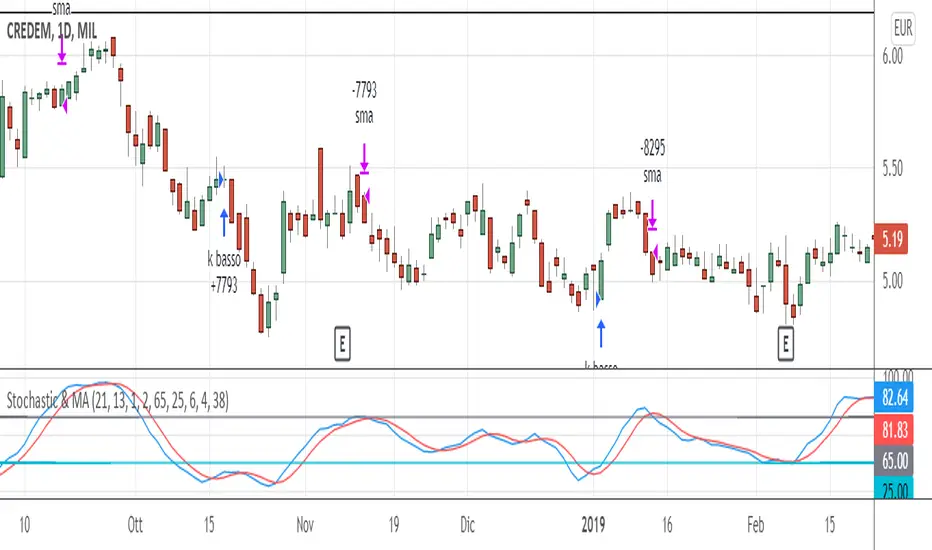
Stochastic & MAThis trading system comes from the experience of having a "fast" signal for entry at low prices (such as the stoscastic) and then "following" the stock with a "slower" indicator such as the exponential moving average. Both the input and output signals are filtered.
The use of the trading system only carries out long operations and has been tested on shares and ETFs, including indices, on daily bases (End Of Day).
ENTRY CONDITION: when stochastic's k is higher than d (on the default value of 21 periods) we enter the lower part of the oversold, to which we apply a filter or the confirmation that the closing of the day of the crossing is higher than that of the n -th previous bar (the 2nd previous bar recommended).
Other default settings are k = 6 and d = 4; the oversold level is also customizable (recommended = 25).
EXIT CONDITIONS: once the entry has "gone well", we follow the upward trend of the stock not with a stochastic oscillator - which tends to exit too soon, especially in case of strong trends - but with a simple moving average exponential (by default at 38 periods). Also in this case a filter is added, that is, k must be> to a filter threshold (recommended = 65) which is used to distinguish the decline between a "physiological" tracking. "(k drops" slowly "together with the approach of prices to the moving average) from a more" violent "tracking (prices are below the moving average and k consequently fall" suddenly ", in a few bars).
MONEY MANAGEMENT: 13% stop loss inserted (the physiological level of tracking of the shares is generally max 8-12% so we also consider a 1% margin due to trading). For more volatile stocks, the level can be extended to 20%.
LEVERAGE: the default value is equal to 1, but it is advisable, for simulations on shares, to use higher levers (x2, x3, ...) if you trade the relative CFD or on the index in case of buying and selling of Leveraged ETFs (e.g. LEVMIB which is 2x leveraged ETFs on Italian index).
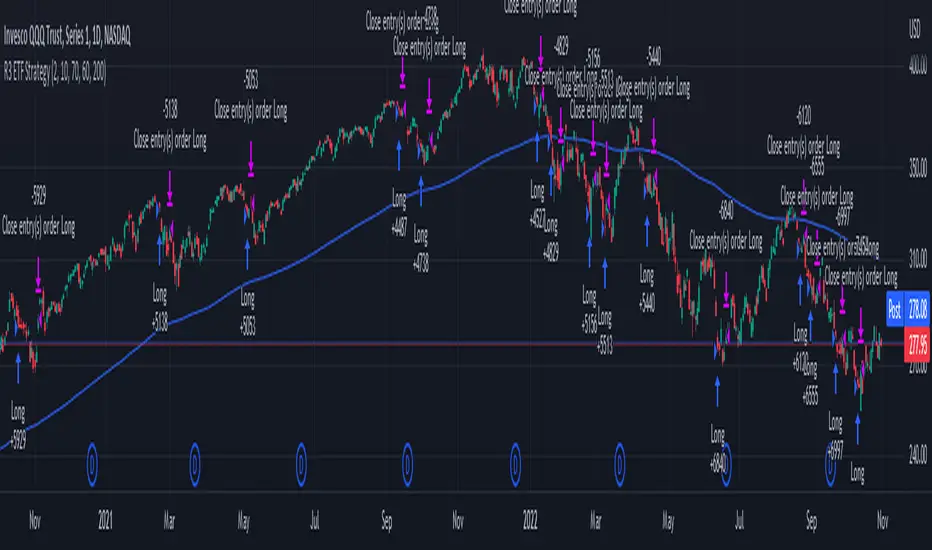
R3 ETF StrategyThis strategy is a modification of the “R3 Strategy” from the book "High Probability ETF Trading" by Larry Connors and Cesar Alvarez. This RSI strategy is for a 1-day time-frame and has these 3 simple rules:
Criteria:
The price must be above the 200 day moving average.
The 2-period (day) RSI drops 3 days in a row.
The 2-period RSI must have been below 60 3 days ago and below 10 today.
Entry and Exit:
If the 3 rules above are true, then buy on the close of the current day.
Exit on the day's close when the RSI crosses above 70.
How it works :
The Strategy will buy when the buy conditions above are true. The strategy will sell when the RSI crosses above 70. The RSI period/length, and RSI entry/exit criteria thresholds have all been coded to be adjustable with inputs.
Plots :
Blue line = 200 Day EMA (Used as Entry Criteria)
Disclaimer: Open-source scripts I publish in the community are largely meant to spark ideas that can be used as building blocks for part of a more robust trade management strategy. If you would like to implement a version of any script, I would recommend making significant additions/modifications to the strategy & risk management functions. If you don’t know how to program in Pine, then hire a Pine-coder. We can help!
Titan EMA Averaging Strategy - (DYOR) By MrCryptoTitan EMA Averaging Strategy (VIP Only) Enable Longs or Shorts only Works With Crypto + Forex with correct back tested settings This is not set and forget. This requires you to back test and have relevant Risk Management in place.
The Strategy: The script uses 3EMA with engulfing candle to enter a trade in either short or long direction.
You will need to test the settings and adjust them so there isn't too many - re-entries and make sure you take profit big enough to not trigger on same candle.
When setting alerts you can use once per bar however this may trigger multiple alerts if the candle is moving very fast so this is not recommended. So doing once per bar close will mean entry is confirmed as bar is closed. You will need to select this in drop down menu.
- Max Trade Limit.
- All in one Alert. - Basically add syntax for example- Long/Take Profit/Re-entry/Emergency Stop. Then add one alert and select "Alert() function calls Only" Change Alert name to custom. That's it.
-Built-in Strategy tester.
- Trade Filter - Multi-MA Filters. - MA", "EMA", "WMA", "HullMA", "VWMA", "RMA", "DEMA", "TEMA", VWAP
- ADX Filter based on Level.
Please note when running this strategy you can only trade longs only or shorts only for this setup to be potentially profitable. Also note that setting unrealistic profit targets will make a loss. So it is very important to back test everything.
This Script does not use any Security functions. All indicators which are used part of the strategy are obtained from Trading View indicator Library and have source code has been changed to make this into Strategy.
Please Do Your Own Research before using this.
Anymore information please DM me directly

3 Candle Strike StretegyMainly developed for AMEX:SPY trading on 1 min chart. But feel free to try on other tickers.
Basic idea of this strategy is to look for 3 candle reversal pattern within trending market structure. The 3 candle reversal pattern consist of 3 consecutive bullish or bearish candles,
followed by an engulfing candle in the opposite direction. This pattern usually signals a reversal of short term trend. This strategy also uses multiple moving averages to filter long or short
entries. ie. if the 21 smoothed moving average is above the 50, only look for long (bullish) entries, and vise versa. There is option change these moving average periods to suit your needs.
I also choose to use Linear Regression to determine whether the market is ranging or trending. It seems the 3 candle pattern is more successful under trending market. Hence I use it as a filter.
There is also an option to combine this strategy with moving average crossovers. The idea is to look for 3 candle pattern right after a fast moving average crosses over a slow moving average.
By default , 21 and 50 smoothed moving averages are used. This gives additional entry opportunities and also provides better results.
This strategy aims for 1:3 risk to reward ratio. Stop losses are calculated using the closest low or high values for long or short entries, respectively, with an offset using a percentage of
the daily ATR value. This allows some price fluctuation without being stopped out prematurely. Price target is calculated by multiplying the difference between the entry price and the stop loss
by a factor of 3. When price target is reach, this strategy will set stop loss at the price target and wait for exit condition to maximize potential profit.
This strategy will exit an order if an opposing 3 candle pattern is detected, this could happen before stop loss or price target is reached, and may also happen after price target is reached.
*Note that this strategy is designed for same day SPY option scalping. I haven't determined an easy way to calculate the # of contracts to represent the equivalent option values. Plus the option
prices varies greatly depending on which strike and expiry that may suits your trading style. Therefore, please be mindful of the net profit shown. By default, each entry is approximately equal
to buying 10 of same day or 1 day expiry call or puts at strike $1 - $2 OTM. This strategy will close all open trades at 3:45pm EST on Mon, Wed, and Fri.
**Note that this strategy also takes into account of extended market data.
***Note pyramiding is set to 2 by default, so it allows for multiple entries on the way towards price target.
Remember that market conditions are always changing. This strategy was only able to be back-tested using 1 month of data. This strategy may not work the next month. Please keep that in mind.
Also, I take no credit for any of the indicators used as part of this strategy.
Enjoy~

Trailing BuyThis script demonstrates how to do trailing buy. With this approach, given an entry signal, instead of buying directly, you just follow the price downwards (for long positions) and you buy when the price increases by a small percentage. The order will be executed when the next bar is closed. This approach may increase the profits (slightly) in some strategies! This script can be used as a template for your own strategy. Be aware that the simulated data may produce unrealistic results.

Acrypto - Weighted StrategyHello traders!
I have been developing a fully customizable algo over the last year. The algorithm is based on a set of different strategies, each with its own weight (weighted strategy). The set of strategies that I currently use are 5:
MACD
Stochastic RSI
RSI
Supertrend
MA crossover
Moreover, the algo includes STOP losses criteria and a taking profit strategy. The algo must be optimized for the desired asset to achieves its full potential. The 1H and 4H dataframe give good results. The algo has been tested for several asset (same dataframe, different optimization values).
Important note:
Backtest the algorithm with different data stamps to avoid overfitting results
Best,
Alberto

Kitti-Playbook HHV LLV Simulation R0 Feb 4 2022
Objective : Visualization the result of price movement cross Higher High - Lower Low to generate Long Short Signal
Study The change of Equity curve when Changes
1) Look back for Higher High - Lower Low
2) Number of Position size
3) Type of Suorce
4) Effected when use EMA 12-26 filter
5) Effected form equity adjustment
6) Effected form margin adjustment
Conditions :
Long Conditions
If EMA 12-26 filter off
1)Source cross over Higher High value of price look back ' x ' bars
2) Addition 1 position when Source cross over Higher High value of price look back ' x ' bars again
3) Maximum Number of Long position not more than set up from input
If EMA 12-26 filter on
1)Source cross over Higher High value of price look back ' x ' bars and EMA 12 > EMA26
2) Addition 1 position when Source cross over Higher High value of price look back ' x ' bars again and EMA 12 > EMA 26
3) Maximum Number of Long position not more than set up from input
Exit long Condition
Exit all positions when Source cross under Lower Low value of price look back ' x ' bars
Short Conditions
If EMA 12-26 filter off
1)Source cross under Lower Low value of price look back ' x ' bars
2) Addition 1 position when Source cross under Lower Lower value of price look back ' x ' bars again
3) Maximum Number of Long position not more than set up from input
If EMA 12-26 filter on
1)Source cross under Lower Lower value of price look back ' x ' bars and EMA 12 < EMA26
2) Addition 1 position when Source cross under lower Low value of price look back ' x ' bars again and EMA 12 < EMA 26
3) Maximum Number of Short position not more than set up from input
Exit Short Condition
Exit all positions when Source cross Over Higher High value of price look back ' x ' bars
Program flow :
1) Initial Strategy Setting
2) Initial Input Setting
3) Data Processing
4) STRATEGY Entry And Exit
5) Information of System selection
6) Dashboard for result

3SmmaCrossUp + Fractal + RSIThis script is a combination of 3 smoothed moving averages, and RSI. When moving averages are aligned upward (downward) and RSI is above (below) 50 and a down (up) William fractal appears, it enters long (short) position. Exiting from long and short entries are defined by StopLoss and TargetProfit.

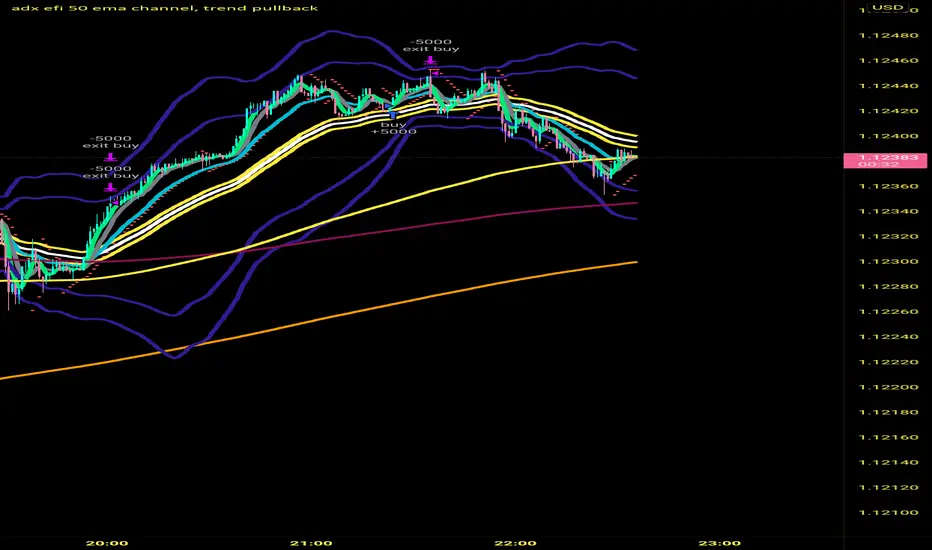
adx efi 50 ema channel, trend pullbackHi so this strategy is based off 50 ema channel and the 15 ma crossing it to generate signals. But with my adjusted strategy it's a 10 rma crossing 50 ema channels and a 5 and 9 wma to help see pullbacks. 50 period bollinger bands to gage volatility a0nd help during range markets. The strategy signals are generated when longer period efi is above 0 and shorter period efi is below zero and price has pulled back near 50 ema to buy long. And the reverse for shorts, I made this to help me trade more mechanically and to trade 1 minute time frame, that's where the strategy seems to Excell the most, I developed it on eur usd but a brief check seems like it still is profitable on gbp usd aud usd usd jpy I only trade the forex market so not sure about stocks and crypto. If you get signals I would place buy stops and sell stops above high and low of respective signal candle and let price take you into trade. Also adx 20 has to be greater than 20 to take trades. Let me know if this is helpful. I've only been coding for a month so it might look sloppy the way it's coded also there are a few other buy and sell conditions left in the source code if you want to switch between different buy and sell triggers, they all produce good results on 1 min timeframe
NSDT HAMA Candles STRATThis is a STRATEGY based on our popular HAMA Candles Indicator.
It is an "Always On" strategy, meaning it will stay in a Long position until the Short criteria shows up, and then it will close the Long position and immediately enter a Short position.
Since this is a strategy, we added a few more components. The most notable one is the grid at the top right that shows the statistics of whatever the current settings are. The user can change the MA lengths and see the potential results update in real time.
Since this is Always On and uses Moving Averages, we added an ADX setting to help filter our trades in a ranging/choppy market.
The settings will need to be adjusted to find the best fit for your instrument, chart time, and risk management plan.

action zone - ATR stop reverse order strategy v0.1 by 9nckACTION ZONE-ATR MOD v0.1 DOCUMENTATION
Overview
This tradingview pine script strategy is mainly created to enrich my coding skill. It is a combination of “CDC-ACTIONZONE” and my personal studies of trading techniques in various sources e.g.book, course or blog. This strategy purposefully built to connect with my automatic trading bot. However, It will be very useful to aid your trading routine by diminishing mental distraction which possibly leads to bad trades.
How does it work?
This strategy will do a basic simple thing that most traders do by creating entry signals on both sides long/short and also set the stop loss. Furthermore, It will also reverse the order (from long to short and vice versa (if long/short conditions are met). Finally, it will recalculate the stop loss/take profit price in every complete bar to increase the chance of winning and limit our loss.
Entry rules(Long/Short)
If you have no open order, an order will be created when a fast EMA crosses(up(long)/down(short) the slow EMA(It’s as simple as that).
If you have an open order, the current order will be (sold if long, covered if short) and the opposite side order will be created.
Exit and Reverse rules(Long/Short)
If fast EMA cross (DOWN(long), UP(short)), the current order will be closed, THE OPPOSITE SIDE ORDER WILL ALSO BE CREATED.
Risk management
FLEX STOP PRICE : initial value will be set at the bar which order created. It is a fast ema (+/-) MIDDLE ATR value.
If MIDDLE ATR value rises, it will be our new stop price.
If MIDDLE ATR value falls, stop price unchanged
If Price OVERBOUGHT(long)/SOLD(short), LOW of that bar will be a new stop price.
Minimum position hold period
In order to eliminate risk of repeatedly open, close orders in sideway trends. Minimum hold period must be passed to start exit our position. However, It always respects stop loss prices. The value refers to the number of bars.
MUST READ!!!
This strategy uses only MARKET ORDER. If you trade with a bot, make sure you choose only enormous market cap tokens.
This strategy is bi-direction strategy. It will work best in the DERIVATIVE market.
It was initially designed to compete in the cryptocurrency market which has very high volume and volatility.
I only use this strategy in 1HR (acceptable change rate, optimum trade frequency)
How (should) we use it?
Choose crypto future pairs (recommend only top 10-15 market volume pairs in Binance, let’s say 1000M+ trade value)
Choose your time frame (1H is strongly recommended)
Setup your portfolio profile (Setting->Properties) such as Initial cap, order size, commission. DO NOT USE CAL ON EVERY TICK IT WILL CAUSE REPAINTING AND YOUR CAPITAL IS BLEEDING !!!
BACKTEST FIRST!! Back test is a combination of art, math and statis(and a bit of luck). You can apply to train and test methods or whatever you are familiar with. In my opinion, your test period should include UPTREND, SIDEWAY, DOWNTREND. Fine tune fast, slow ema first(my best ema length of 1H timeframe around 7-10, 17-22). Try to eliminate fault breakout trade and use other options only necessary. Hopefully we can use automatic optimization on Pine Script soon.
Don’t forget to turn off using a specific backtest date option to start your strategy.A
THIS IS NOT A PERFECT (OR EVEN PROFITABLE) STRATEGY. USE AT YOUR OWN RISK AND TRADE RESPONSIBLY. DYOR DUDE.

Pumpkin Soup Modified Indicator[Public]This trading strategy is a multi-divergence trading technique using central oscillators such as MACD, SMI, Stochastic, and RSI and MAs (EMA, SMA, WMA) and channels (Bolinger, Caltner, and Doncian).
Only the parts that can be disclosed based on personal sales strategies can be used.
The usage time is at least 1 hour to 1 day. (I recommend the 8 hour stick starting from 3 o'clock)
The MACD ma part is the sensitivity part of the signal, so please use it if necessary.
Background Color: The image of the upward and downward markets is shown in the background.
-Red, green: Downfall, upfall
-Orange, yellow: Short hit section
-Silver, black: Beware of buying and selling.
Middle value (Support Resistance): It represents the sales base of the stock bar where long and short occur, starting from the peak where diversity occurs.
-Red and green lines represent resistance and support, and yellow and blue lines represent short-term sections used for scalping.
MA was used by integrating the MA series in combination.
-The required length of MA is 5 pieces, and I wrote the length I use.
This strategy was used to raise the invitation-only indicator as a strategic indicator before raising it.
(There's no alarm because it's a strategic indicator.)
------------------------------------------------------------------------------------
이 매매 전략은 MACD, SMI, Stochastic, RSI 등 센터드 오실레이터와 MAs(EMA, SMA, WMA)와 채널(볼린저, 캘트너, 돈치안)을 이용한 다중 다이버전스 매매기법입니다.
개인적인 매매전략을 근본으로 공개할 수 있는 부분만 사용할 수 있게 올립니다.
사용시간대는 최소 1시간봉에서 1일봉입니다. (3시봉부터 8시간봉을 추천드립니다)
MACD ma 부분은 시그널상 민감도부분으로 필요시 사용하시길 바랍니다.
Backbround Color : 상승장과 하락장에 대한 이미지를 배경으로 나타내었습니다.
빨간색, 초록색 : 하락장, 상승장
주황색, 노랑색 : 단타 구간
실버색, 검은색 : 매매 주의 구간
Middle value(Support Resistance) : 다이버전스가 생기는 봉을 기점으로 롱과 숏이 발생하는 주가봉의 매물대를 나타냅니다.
빨간선과 초록선은 저항과 지지를 나타내며, 노란선과 파란선은 스캘핑용으로 사용되는 단기 구간을 나타냅니다.
MA는 MA계열을 복합적으로 통합하여 사용하였습니다.
필요한 MA의 길이는 5개정도로 제가 사용하는 길이로 작성하였습니다.
본 전략은 인바이트 온니 지표 올리기전 전략 지표로 올리는 용도로 사용되었습니다.
(전략 지표라 알람이 없습니다.)
※ 전략지표 매매 포인트에서 매매 물타기 불타기 적용

Setup 9.1 Larry WilliamsThis Strategy was created according to Larry Williams 9.1 Setup. This is based on the Exponential Moving Average of 9 days. Although this might be used in any timeframe, it is most common on the Daily Timeframe.
I have developed this strategy to be used on both Long and Short Position, using the drop down list.
- Setup 9.1 (Lond Position)
It looks for tickers where the close is below EMA9. Once close gets above EMA9 we set this candle as 9.1. The entry point happens one tick above the 9.1 candle. The stop loss is set to be one tick below the lowest of this candle. The exit takes place once close is below EMA9
- Setup 9.1 (Short Position)
It looks for tickers where the close is above EMA9. Once Close gets below EMA9 we set this candle as 9.1. The entry point happens one tick below the 9.1 candle. The stop loss is set to be one tick above the highest of this candle. The exit takes place once close is above EMA9
To cut the noise and have a better trend direction on the EMA9, on both Long and Short, I used the code below for the setup.
setup91B = fastMA >fastMA and fastMA >fastMA and fastMA >fastMA and fastMA >fastMA and fastMA fastMA
setup91S = fastMA fastMA and close > fastMA and close < fastMA
If you have any questions, let me know !

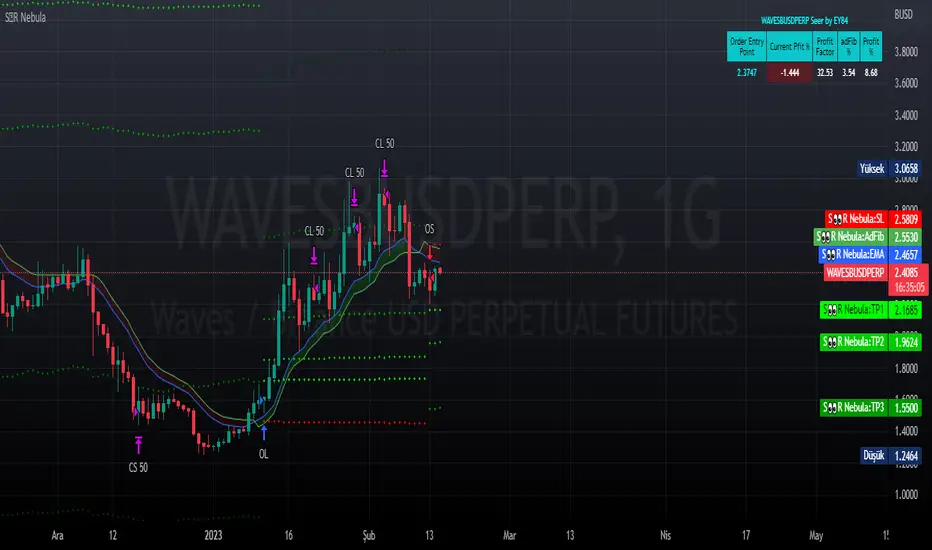
Seer by EY84This is a strategy based on Exponential Moving Averages or Volume Weighted Moving Averages against Adaptive fib resistance / support level and profit percentage which can be definetly defined by user and targeting small profits(profits will be raised by leverages).
In this strategy, there are predefined values which are collected one by one with statistical background and backtests. This gives an advantage to see which ratios are working better for each symbol.
Also this statistics are re-evaluated monthly and if there is a need they are goging to be changed with the help of libraries. Also IT IS RECOMMENDED TO USE IN HOURLY INTERVAL GRAPHICS!!!!
When we deep dive to strategy, it is based on profit percentages. it is similar to the MOST system. MOST only changes the way with default value of %2. But this hardcoded strategy is not working well with each Symbol.
So this is the point where Statistics are involved.
For Ex. while BTC is suits well with %2, it does not do wonders for RSR or RUNE which is 4-5% for each.
Library stores these values as a predefined options. Also it is allowed to change these predefined values within the settings of this strategy.
what is next ? Lets see how are we closing the positions.
Script checks cross of EMA / VWMA and adFib to decide open a position. In reversal / crosses, adFib line had been set to defined Fib. Percentage level. This sets the Full Position close / SL value for current order.
OK! we got the SL but how we get the profit ?
Now this is the place where Profit Percentage (PP) parameter involved. After the position opened it is waiting for PP to be reached. After PP had been reached, close signal had been raised for the HALF of the OPEN ORDER (with the BAR CLOSURE!!).
so tricky part has come here. Remaining position is still open and when "total available profit with remaining amount" had been reached to PP it wil raise the Close Half signal will be raised.
what happens to the SL position ? TWO possible scenarios will be raised here.
Case 1. Reversal on the adFib (short-to-long or long-to-short) will trigger full close signal.
Case 2. If the level drops the previous signal system will generate full close signal again.
Example 1:
Long Order Open : 100$
Half Close Signal : 110$
Case 1: adFib Reversal occurs : 105$ ==> Triggers Full Close Signal with Short Order.
Case 2: Price falls : 100$ ==> Only Triggers Full Close Signal.
Example 2:
Long Order Open : 100$
Half Close Signal : 110$
2. Half Close Signal : 121$
Case 1: adFib Reversal occurs : 115$ ==> Triggers Full Close Signal with Short Order.
Case 2: Price falls : 110$ ==> Only Triggers Full Close Signal.
Beside of these, strategy is also includes editable 4 EMA, 1 WMA, 1 AVWAP and Bollinger Bands Plotting (2.5x Multiplier) who wants to use them as a supportive statistics.
All feedbacks are welcome.
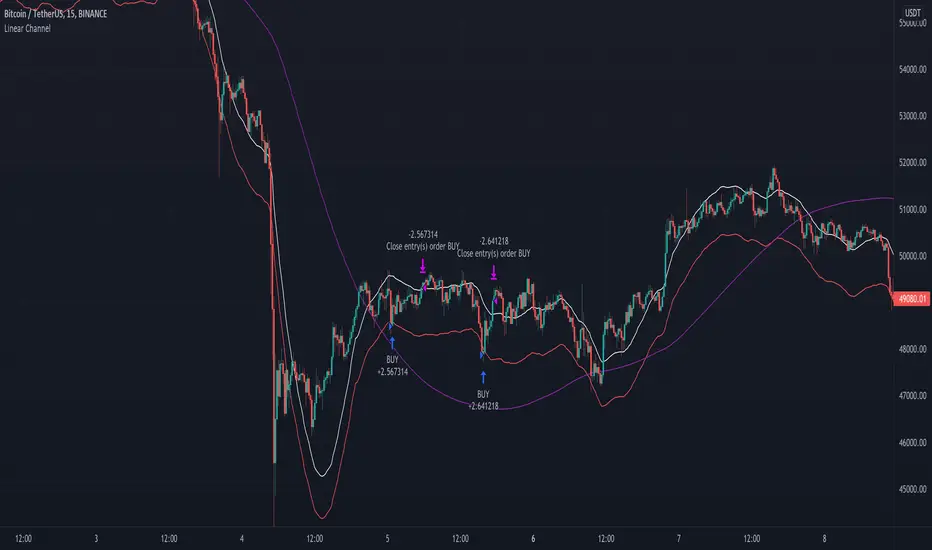
Linear Channel - Scalp Strategy 15MSimple way how to use Linear Regression for trading.
What we use:
• Linear Regression
• HMA as a trend filter
Logic:
Firstly we make simple linear regression moving. It is the white line which appears on the chart.
Then we make second line (named: band2) on the chart by multiplying linreg and value difference.
The third step is to ad HMA as a trend filter.
The trade open when price is below band2, but still upper than Hullma. The trade close when price again upper than linreg.
Automated Bitcoin (BTC) Investment Strategy from Wunderbit Automated Bitcoin (BTC) Investment Strategy from Wunderbit Trading
This strategy is designed for the automated long-term investment in Bitcoin. The BTC investment strategy is primarily suitable for long-term investors who want to increase the percentage of their investments through timely trading long-term transactions. The main feature is the difference from the indicator of long-term investment. Based on their statistics, this figure is 2 times less. That is, if we just bought Bitcoin and held it, we would receive 2 times less than if we applied the BTC Investment strategy.
This strategy uses the intersection of the triple exponential moving average and the least squares moving average. We also control the profit you will make during an uptrend by implementing a trailing stop based on the ATR indicator.
This is a spot market-only strategy and can be used primarily for long-term investors. The strategy is designed to create an automatic version of investing using a webhook.
Automation allows you to safely ignore the state of your portfolio and exclude emotions.
In order to create a cryptocurrency bot for this strategy, you need to:
1. Create alerts and link the URL to the webhook.
2. Connect the TradingView strategy with automated trading service.

ADX+BB %B+AO+EMA Strategy [PineMyths] #2Indicator List
ADX (14,14)
Bollinger Bands %B (20,close,2)
Awesome Oscillator
EMA(5), EMA(21), EMA(50), EMA(200)
Strategy Rules and Conditions
LONG Side
EMA(5) > EMA(21)
EMA(50) > EMA(200)
BB %B > 0.75
ADX > 15
Awesome Oscillator > 2
SHORT Side
EMA(5) < EMA(21)
EMA(50) < EMA(200)
BB %B < 0.25
ADX > 15
Awesome Oscillator < -2
Stop: Fixed %2
Take Profit: Fixed %1
