SuperTrend AI Oscillator StrategySuperTrend AI Oscillator Strategy
Overview
This strategy is a trend-following approach that combines the SuperTrend indicator with oscillator-based filtering.
By identifying market trends while utilizing oscillator-based momentum analysis, it aims to improve entry precision.
Additionally, it incorporates a trailing stop to strengthen risk management while maximizing profits.
This strategy can be applied to various markets, including Forex, Crypto, and Stocks, as well as different timeframes. However, its effectiveness varies depending on market conditions, so thorough testing is required.
Features
1️⃣ Trend Identification Using SuperTrend
The SuperTrend indicator (a volatility-adjusted trend indicator based on ATR) is used to determine trend direction.
A long entry is considered when SuperTrend turns bullish.
A short entry is considered when SuperTrend turns bearish.
The goal is to capture clear trend reversals and avoid unnecessary trades in ranging markets.
2️⃣ Entry Filtering with an Oscillator
The Super Oscillator is used to filter entry signals.
If the oscillator exceeds 50, it strengthens long entries (indicating strong bullish momentum).
If the oscillator drops below 50, it strengthens short entries (indicating strong bearish momentum).
This filter helps reduce trades in uncertain market conditions and improves entry accuracy.
3️⃣ Risk Management with a Trailing Stop
Instead of a fixed stop loss, a SuperTrend-based trailing stop is implemented.
The stop level adjusts automatically based on market volatility.
This allows profits to run while managing downside risk effectively.
4️⃣ Adjustable Risk-Reward Ratio
The default risk-reward ratio is set at 1:2.
Example: A 1% stop loss corresponds to a 2% take profit target.
The ratio can be customized according to the trader’s risk tolerance.
5️⃣ Clear Trade Signals & Visual Support
Green "BUY" labels indicate long entry signals.
Red "SELL" labels indicate short entry signals.
The Super Oscillator is plotted in a separate subwindow to visually assess trend strength.
A real-time trailing stop is displayed to support exit strategies.
These visual aids make it easier to identify entry and exit points.
Trading Parameters & Considerations
Initial Account Balance: Default is $7,000 (adjustable).
Base Currency: USD
Order Size: 10,000 USD
Pyramiding: 1
Trading Fees: $0.94 per trade
Long Position Margin: 50%
Short Position Margin: 50%
Total Trades (M5 Timeframe): 1,032
Visual Aids for Clarity
This strategy includes clear visual trade signals to enhance decision-making:
Green "BUY" labels for long entries
Red "SELL" labels for short entries
Super Oscillator plotted in a subwindow with a 50 midline
Dynamic trailing stop displayed for real-time trend tracking
These visual aids allow traders to quickly identify trade setups and manage positions with greater confidence.
Summary
The SuperTrend AI Oscillator Strategy is developed based on indicators from Black Cat and LuxAlgo.
By integrating high-precision trend analysis with AI-based oscillator filtering, it provides a strong risk-managed trading approach.
Important Notes
This strategy does not guarantee profits—performance varies based on market conditions.
Past performance does not guarantee future results. Markets are constantly changing.
Always test extensively with backtesting and demo trading before using it in live markets.
Risk management, position sizing, and market conditions should always be considered when trading.
Conclusion
This strategy combines trend analysis with momentum filtering, enhancing risk management in trading.
By following market trends carefully, making precise entries, and using trailing stops, it seeks to reduce risk while maximizing potential profits.
Before using this strategy, be sure to test it thoroughly via backtesting and demo trading, and adjust the settings to match your trading style.
Osciladores de Momentum

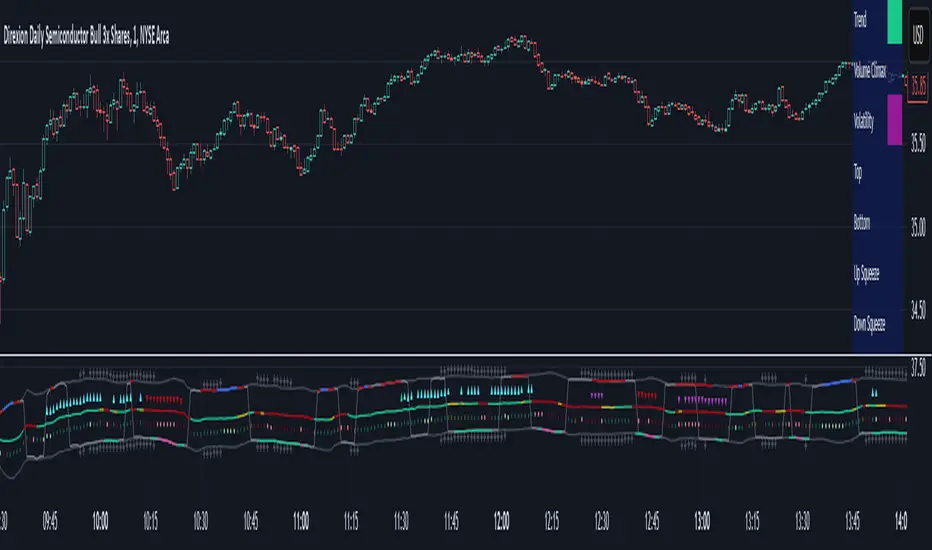
Adaptive Sharp Momentum█ Introduction
The Adaptive Sharp Momentum Study has the following all-in-one features:
• A noise-free, trend-following indicator.
• Automatically detects implied tops and bottoms within fast price cycles.
• It identifies price consolidations and periods of indecision; often challenging to spot.
• Includes a unique feature for detecting directional price squeezes.
• An integrated volatility measure helps avoid false signals and clarifies trend direction.
• Lastly, it alerts traders when a volume climax is likely reached during a move.
This study primarily focuses on capturing momentum while concurrently alerting traders to shifting market dynamics, thereby aiding in the decision to either extend a position’s duration or optimize exit timing. The set of analytical tools, deployed alongside the trend-following indicator, are integrated to reflect the concepts outlined above. Furthermore, this framework utilizes distinctive methods for trend identification, consolidation recognition, directional squeeze assessment, and volume climax analysis—approaches that are not currently documented in publicly available resources.
█ Explanation of Core Components
1. Trend Following Consolidated Adaptive Moving Average:
At the core of the study is the Jurik Adaptive Average Curve, a fast-response adaptive moving average refined with an adaptive Relative Strength Index (RSX) function, known as Jurik RSX. This curve displays three trend modes—bullish, bearish, and indecisive—each customizable in color.
Users can adjust parameters such as the Phase and Consolidation Period:
• Phase: Influences the timing of trend signals, accommodating various trading styles. A lower phase value can produce leading signals, while a higher value may result in lagging signals.
• Consolidation Period: Helps filter out false signals. Optimize this period based on the time frame and instrument.
• Momentum Slope Threshold: As mentioned earlier, the Jurik moving average values are consolidated against the Dynamic Jurik RSX. Crossing the slope threshold of the Jurik RSX will trigger consolidation.
The main curve in the middle represents the overall trend. The issue with moving averages is that they work well in trends but when market is in consolidation, many false signals can be generated. The consolidation period acts as a second fast signal curve that helps eliminate the false signals generated through the standard adaptive moving average. This is basically done by measuring the momentum of the move itself through the Jurik RSX. There are other tools in this study that should also help the trader avoid false signals which will be fully described below.
2. Implied Tops and Bottoms
The study also detects Implied Tops and Bottoms during market cycles using the Composite Momentum and Projections. It offers three detection modes:
• Strong Signals: Indicate significant potential reversal points.
• Medium Signals: Typically displayed near the end of a trend, suggesting traders should prepare to exit.
• Rolling Signals: Alert traders to set tight stop losses to secure profits, as the market may be approaching a turning point.
By default, the colors of Rolling Signals and Medium Signals are the same for simplicity.
Note the following:
• The fast and slow period have the most effect on implied tops and bottoms detection.
• Adjusting the main period will also have an overall effect.
The above chart shows rolling tops, rolling bottoms, strong tops, and strong bottoms. A rolling top of bottom indicate an increase in momentum in that direction and thus a tight stoploss would be recommended, while a strong top/bottom indicates that an exit is warranted.
3. Consolidation and Volatility
If enabled, '+' will appear above the ceiling and floor plots if consolidation is detected. Consolidation is detected by using lookback function that determine if price is below a threshold or not. If below, then consolidation would be confirmed. This is accomplished by adjusting the ' Price Consolidation Threshold ' period
The above chart demonstrates detection of consolidation on a 1-minute chart. Also, note the ceiling and floor plot, it expands when volatility is high.
Consolidation detection helps weed out long and short signals indicated by the main curve.
4. Directional Squeeze
Another unique feature of this indicator is the detection of directional price squeeze. Directional squeeze is defined as a price push in the direction indicated by momentum whether upward or downward. This is different from the common squeeze indicators found on the web since this one is detecting a directional push.
The Directional Squeeze feature, indicated by up and down triangles above the main curve, highlights strong trends in the market's current direction:
• Trend Continuation: Allows traders to stay in profitable trades longer during strong trending markets.
• Multiple Modes: Offers single-bar (short-term) and longer-term squeezes. Single-bar squeezes can signal potential market reversals, while longer-term squeezes are useful in sustained trends.
Be mindful that under certain conditions, the directional squeeze could be directionless(sideways) if consolidation is outlined by the indicator. This is another useful feature the trader could utilize. The chart above mostly demonstrates directional squeeze but directionless can also be observed.
5. Volume Volatility and Volume Climax Detection
An essential feature of the Adaptive Sharp Momentum Study is its ability to measure Volume Volatility and detect Volume Climax moments:
• Volume Volatility Measure: Integrated into the study to help avoid false signals by assessing the strength of market moves. It provides better clarity on trend direction by indicating when the market is experiencing significant volume changes.
• Volume Climax Alerts: The study alerts traders when a volume climax is likely reached during a move, which is helpful for identifying potential reversal points or the culmination of a trend. Brighter confirmation signal dots indicate these climaxes, helping traders make timely entry/exit decisions.
• Adjustable Parameters: Traders can set the Volume Volatility Threshold and adjust the Volume Lookback Period to tailor the sensitivity of volume climax detection according to their trading strategy.
5. The indicator contains other useful features:
• Cycles: Helps determine when to enter long or short trades based on upward or downward market cycles. It also aids in recognizing retracement levels during a trend, allowing traders to capitalize on brief counter-trend movements. Those cycles can be observed as the up and down gray lines on the chart.
• Real-Time Table: The table is another visual aid that summarizes the status of each feature in real-time.
█ How to Use this Study Effectively
The main curve in the middle is your final decision point. Prior to entering a trade look for the following:
• Is the market in consolidation? If yes, then you'd be advised not to enter the trade until the study clearly shows no consolidation
• Is the ceil or floor plots showing a strong top or bottom, or even a volume climax in the direction to intend to enter? If yes, then either ensure you enter at a tight stop or don't enter
• Is there an indication of a directional squeeze with no consolidation or volume climax? Then this would be an ideal place to enter. Be mindful though that entering directional squeeze too late is not recommended.
• Once you are in the trade, look at consolidation, implied tops and bottoms, and volume climax to determine exit point. You will quickly realize if you entered a trade prematurely.
• Utilize the directional squeeze and the prevalent trend to help you stay in the trade longer.
• Adjust your stop losses depending on whether you are seeing a rolling implied top/bottom or a strong top/bottom.
• Also, at volume climaxes, be ready to exit. The approach with volume climax detection should be the same as the implied tops/bottoms.
Below is a chart demonstrating trading on a 1-minute chart. The study could be used for any time frame:
** Important Note **
This study relies on volume readings. Incorrect evaluation will be concluded without proper volume data.
█ How the Adaptive Sharp Momentum Works?
---Main Curve - Jurik Moving Average and RSX---
The Jurik Moving Average (JMA) and the Jurik RSX with Fisher transform (Relative Strength Index Extended) are technical tools designed to enhance data processing efficiency. The JMA uses an adaptive smoothing algorithm to dynamically adjust to market conditions, reducing lag while maintaining high responsiveness to price changes. the JMA incorporates a mechanism that determines smoothness based on input volatility. The RSX, on the other hand, tracks relative strength without introducing the overshoots and noise commonly seen in other momentum indicators. It achieves this by applying a yet another JMA smoothing function that ensures stability and consistency, making it a better candidate for identifying shifts.
This is a unique approach, but can simply be equated to two moving averages crossing over, except in this case, the RSX is crossing over with the JMA.
The process of determining market trends and consolidation for the main curve revolves around evaluating multiple conditions and rankings of indicators such as Jurik RSX, Fisher Transform, and Volume-based metrics (Adaptive On Balance Volume and Price Volatility). Here's how consolidation and trends are identified:
1. Trend Override Logic: The core logic evaluates whether specific conditions override the default trend determined by the JMA.
• Bearish Overrides: A trend is classified as bearish if specific conditions involving negative slopes of the RSX, bearish Fisher Transform readings, and other auxiliary rankings (AOBV trend rank or volatility ranks) are met.
• Bullish Overrides: Similarly, bullish trends are determined by the presence of positive RSX slopes, bullish Fisher readings, and supporting AOBV and volatility ranks.
• Neutral Overrides: If neither bullish nor bearish overrides dominate, and conflicting conditions are detected (e.g., a bearish Fisher with a bullish OBV), the trend can be overridden to neutral.
2. Dynamic Slope and Rank Analysis: RSX and Jurik Slopes: The slopes of the RSX and Jurik indicators play an important role. Increasing slopes suggest bullish momentum, while decreasing slopes imply bearish momentum.
3. Narrow Spread Analysis: Consolidation zones are identified by examining conditions like narrow spreads in price action and mixed indicator signals (e.g., a positive RSX slope alongside a neutral or bearish AOBV).
• When consolidation is detected, the system looks for confirming signals (AOBV or Fisher alignment) to determine whether the next move is likely to be bullish or bearish.
4.Fallback Logic:
If no explicit conditions are met for bullish, bearish, or neutral trends, the system defaults to comparing the current and previous values of the Jurik Moving Average. If the JMA is rising, the trend is set to bullish; otherwise, it defaults to bearish.
The process of consolidating The RSX with JMA, attempts to confirm the trend suggested by the Jurik moving average. As shown above, several factors play into this, but it is mostly motivated by the RSX and its slope
-- Detecting Tops and Bottoms --
• Composite Momentum
The Composite Momentum indicator analyzes the market's directional strength to identify implied tops and bottoms, especially at extreme values. It evaluates momentum by categorizing it into ranges that reflect moderate or strong trends for both bullish and bearish conditions. When momentum exceeds a positive threshold, it indicates a strong top, whereas values below a negative threshold then it's a strong bottom.
• Laguerre Dynamic Projection Bands
The Laguerre Dynamic Projection Bands focuses on price positioning within calculated dynamic boundaries. By applying linear regression, it projects upper and lower price bands, which serve as potential resistance and support levels. The oscillator value ranges from 0 to 100, representing the relative position of the current price. A value above 70 indicates the price is near a projected top, while a value below 30 suggests proximity to a projected bottom. Through custom Laguerre smoothing, the setup ensures that its signals remain stable and actionable.
• How They Work Together
The Composite Momentum and Projection Oscillator complement each other in detecting market tops and bottoms. The Projection Oscillator provides an early indication when price nears a critical level, while the Composite Momentum confirms whether the momentum supports the formation of a significant top or bottom.
-- Consolidation Detection, Volatility, and Volume Climax Detection --
• Summary of Consolidation Detection:
Consolidation is identified through a combination of statistical and smoothing applied to price data. The approach calculates deviations around the main plot using squared price inputs, smoothed averages, and adaptive multipliers. These deviations form dynamic upper and lower boundaries that adapt to changing market conditions. The system further evaluates these boundaries against historical bars to calculate a volume percentage, which indicates how often recent price action remains within these bands. A low percentage suggests consolidation, characterized by reduced volatility and price movement confined within a tighter range.
The bands around the main plot are derived from the calculated maximum deviations, creating adaptive ceilings and floors that expand or contract based on market dynamics. The Ceiling and Floor plots represent the outermost boundaries, while additional retracement plots are drawn based on the Composite Momentum wave rank. For example, during an uptrend, the retrace levels adjust upward in fractional steps relative to the deviation, signaling possible resistance levels. In downtrends, similar logic applies in reverse to determine support levels. These bands visually represent the volatility envelope and help contextualize price movements relative to expected ranges. Whenever, low volatility is detected, a visual "+" indicator is added to the plot to highlight that the market is likely in consolidation mode.
• How the Adaptive OBV Applies the Same Logic:
The Adaptive On-Balance Volume (OBV) uses a similar mechanism to detect volume climaxes by analyzing deviations in volume data. Instead of price, the OBV logic applies the squared input and smoothing methods to volume flows. By comparing these deviations to historical norms, the system identifies periods of high or low volatility in volume, which often coincide with potential breakouts or consolidation zones.
• How They Work Together
The consolidation detection process and the adaptive bands work in tandem to provide traders with a clear visualization of market conditions. When consolidation is detected, the dynamic bands narrow and a "+" sign is visualized, signaling reduced volatility and potential breakout opportunities. Similarly, volume-based analysis through the adaptive OBV helps confirm whether a breakout is accompanied by significant volume, adding confidence to trade decisions. Together, they enable anticipation of market shifts.
-- Directional Squeeze --
A directional price squeeze refers to a market condition where price compresses in a particular direction. This provides traders with an opportunity to stay in trades longer by aligning with the prevailing directional bias. This unique concept generates dynamic limits based on lookback period. Their convergence upward or downward is typically a strong indication of a price push toward the respective direction.
In this approach, the system looks at the highest and lowest values of a smoothed momentum reading over a recent period and measures the distance between them. Instead of relying on a static “overbought” or “oversold” line, it calculates new boundaries as a fraction of that distance, scaling the thresholds to match the price behavior. When these dynamically adjusted limits converge, it suggests a “directional squeeze”—meaning price is moving within a more compressed or focused range. Because these boundaries adapt to the market’s own highs and lows, they provide a more responsive indication of when price may be shifting into or out of a strong directional move.
• Determining the Directional Squeeze
Directional squeeze is identified using dynamic limits derived from two key factors:
Schaff Trend Cycle (STC) for single-bar squeezes. and the Slow RSI (SRSI) for multi-bar or longer-term squeezes. Both are utilizing a custom alpha factor for adaptability and conformance with the JMA and Dynamic RSX studies.
• Directional Trend Confirmation:
If the SRSI or STC approaches the limits, additional conditions such as Fisher RSX (momentum signals) and AOBV (volume signals) and the trend already established by the JMA are aligned. If so, then a squeezed in that trend directional is established.
█ Why These Components All Work Together?
The Adaptive Sharp Momentum Study integrates multiple components to provide a framework for analyzing market dynamics. Each feature addresses specific challenges in trading:
• Core Trend Identification:
The Jurik Adaptive Moving Average (JMA) and Jurik RSX ensure better trend detection by reducing noise and dynamically confirming momentum, thus minimizing lag and false signals.
• Implied Tops and Bottoms:
The combination of Composite Momentum and Laguerre Dynamic Projection Bands highlights critical turning points. This dual-layered approach identifies potential reversals and key support/resistance levels with improved clarity.
• Consolidation and Volatility:
Adaptive ceilings, floors, and consolidation detection filter out indecisive market phases. This helps avoid unreliable signals and provides a better perspective on potential breakouts or continuations.
• Directional Squeeze:
The Directional Squeeze feature identifies directional bias in price compression. Its dynamic thresholds adapt to market conditions, aiding in the assessment of strong directional moves.
• Volume Climax:
Volume volatility and climax detection highlight key moments of market activity, aiding in the evaluation of trend strength and potential turning points.
• Integrated Framework:
The integration of these components creates a system where each element complements the others.
This study offers a methodical approach to analyzing trends, momentum, and volatility while filtering noise. It is a tool designed to assist traders in navigating complex market conditions.
█ Disclaimer
This script is provided for educational and informational purposes only and should not be considered financial advice. Trading financial instruments carries a high level of risk and may not be suitable for all investors. Before using this script, please consult with a qualified financial advisor to ensure it aligns with your individual circumstances. The author does not guarantee the accuracy or completeness of the script and is not responsible for any losses or damages that may occur from its use. Use this script at your own risk.
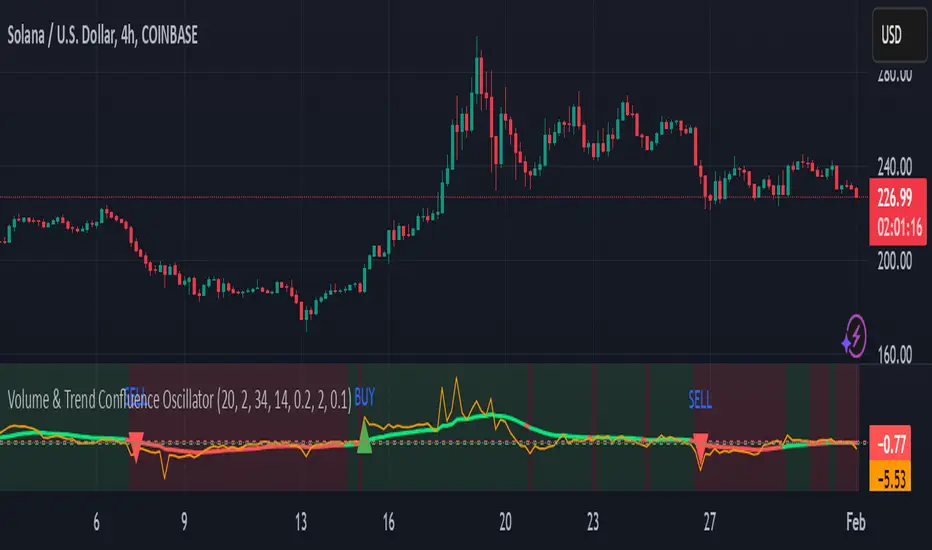
Volume & Trend Confluence OscillatorVolume & Trend Confluence Oscillator (VTCO)
Overview:
The Volume & Trend Confluence Oscillator (VTCO) is a technical analysis tool designed to help traders assess market conditions by integrating volume analysis, momentum, and trend direction into a single oscillator. This indicator provides traders with additional confirmation when evaluating potential trade entries and exits.
Key Features:
Volume Analysis: Calculates a Z-score to detect unusual trading activity.
Momentum Measurement: Evaluates the rate of price change to gauge market velocity.
Trend Confirmation: Utilizes an Exponential Moving Average (EMA) to assess overall market direction.
Signal Filtering: Incorporates minimum movement thresholds and a confirmation period to reduce false signals.
Visual Enhancements: Background shading indicates trend direction, and buy/sell markers highlight key signals.
How It Works:
The VTCO applies a volume multiplier to momentum readings when volume activity significantly deviates from its historical norm. Additionally, it prioritizes momentum moves that align with the prevailing market trend. A smoothing mechanism refines the oscillator’s signal line, ensuring a more stable and actionable output. The indicator generates alerts when key conditions are met, assisting traders in identifying potential trend shifts.
Signal Generation:
Buy Signal: Triggered when the oscillator crosses above zero after an oversold condition, ideally within an uptrend.
Sell Signal: Triggered when the oscillator crosses below zero after an overbought condition, ideally within a downtrend.
Alerts: Configurable alerts notify traders when key market conditions are met.
Usage Considerations:
Works effectively across various timeframes but may provide more reliable signals on higher timeframes.
Best utilized in conjunction with additional technical indicators and risk management strategies.
No indicator guarantees future performance; proper analysis and trade management remain essential.
Disclaimer:
This indicator is provided for educational purposes only and should not be considered financial advice. Trading involves risk, and past performance is not indicative of future results. Always conduct independent analysis before making trading decisions.
GOLDEN RSI by @thejamiulGOLDEN RSI thejamiul is a versatile Relative Strength Index (RSI)-based tool designed to provide enhanced visualization and additional insights into market trends and potential reversal points. This indicator improves upon the traditional RSI by integrating gradient fills for overbought/oversold zones and divergence detection features, making it an excellent choice for traders who seek precise and actionable signals.
Source of this indicator : This indicator is based on @TradingView original RSI indicator with a little bit of customisation to enhance overbought and oversold identification.
Key Features
1. Customizable RSI Settings:
RSI Length: Adjust the RSI calculation period to suit your trading style (default: 14).
Source Selection: Choose the price source (e.g., close, open, high, low) for RSI calculation.
2. Gradient-Filled RSI Zones:
Overbought Zone (80-100): Gradient fill with shades of green to indicate strong bullish conditions.
Oversold Zone (0-20): Gradient fill with shades of red to highlight strong bearish conditions.
3. Support and Resistance Levels:
Upper Band: 80
Middle Bands: 60 (bullish) and 40 (bearish)
Lower Band: 20
These levels help identify overbought, oversold, and neutral zones.
4. Divergence Detection:
Bullish Divergence: Detects lower lows in price with corresponding higher lows in RSI, signaling potential upward reversals.
Bearish Divergence: Detects higher highs in price with corresponding lower highs in RSI, indicating potential downward reversals.
Visual Indicators:
Bullish divergence is marked with green labels and line plots.
Bearish divergence is marked with red labels and line plots.
5. Alert Functionality:
Custom Alerts: Set up alerts for bullish or bearish divergences to stay notified of potential trading opportunities without constant chart monitoring.
6. Enhanced Chart Visualization:
RSI Plot: A smooth and visually appealing RSI curve.
Color Coding: Gradient and fills for better distinction of trading zones.
Pivot Labels: Clear identification of divergence points on the RSI plot.

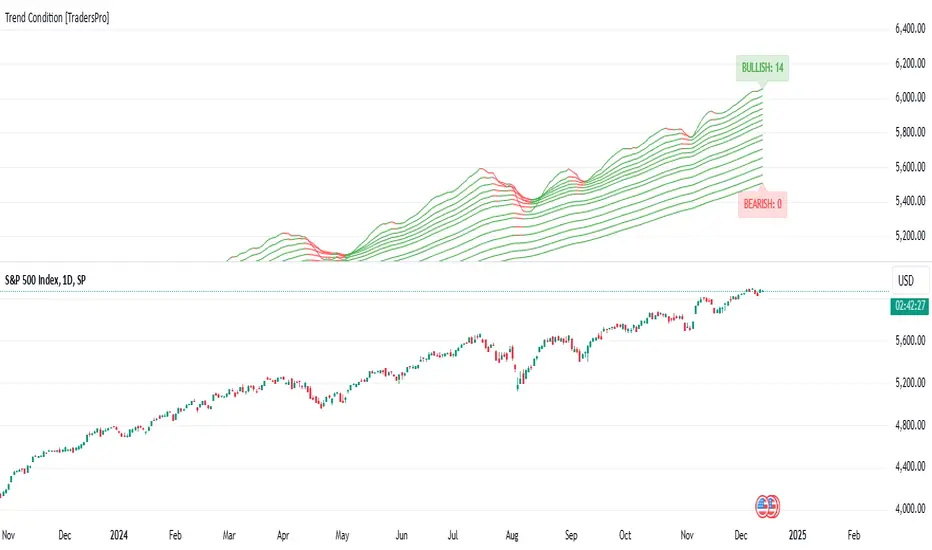
Trend Condition [TradersPro]
OVERVIEW
The Trend Condition Indicator measures the strength of the bullish or bearish trend by using a ribbon pattern of exponential moving averages and scoring system. Trend cycles naturally expand and contract as a normal part of the cycle. It is the rhythm of the market. Perpetual expansion and contraction of trend.
As trend cycles develop the indicator shows a compression of the averages. These compression zones are key locations as trends typically expand from there. The expansion of trend can be up or down.
As the trend advances the ribbon effect of the indicator can be seen as each average expands with the price action. Once they have “fanned” the probability of the current trend slowing is high.
This can be used to recognize a powerful trend may be concluding. Traders can tighten stops, exit positions or utilize other prudent strategies.
CONCEPTS
Each line will display green if it is higher than the prior period and red if it is lower than the prior period. If the average is green it is considered bullish and will score one point in the bullish display. Red lines are considered bearish and will score one point in the bearish display.
The indicator can then be used at a quick glance to see the number of averages that are bullish and the number that are bearish.
A trader may use these on any tradable instrument. They can be helpful in stock portfolio management when used with an index like the S&P 500 to determine the strength of the current market trend. This may affect trade decisions like possession size, stop location and other risk factors.
Trend Speed Analyzer (Zeiierman)█ Overview
The Trend Speed Analyzer by Zeiierman is designed to measure the strength and speed of market trends, providing traders with actionable insights into momentum dynamics. By combining a dynamic moving average with wave and speed analysis, it visually highlights shifts in trend direction, market strength, and potential reversals. This tool is ideal for identifying breakout opportunities, gauging trend consistency, and understanding the dominance of bullish or bearish forces over various timeframes.
█ How It Works
The indicator employs a Dynamic Moving Average (DMA) enhanced with an Accelerator Factor, allowing it to adapt dynamically to market conditions. The DMA is responsive to price changes, making it suitable for both long-term trends and short-term momentum analysis.
Key components include:
Trend Speed Analysis: Measures the speed of market movements, highlighting momentum shifts with visual cues.
Wave Analysis: Tracks bullish and bearish wave sizes to determine market strength and bias.
Normalized Speed Values: Ensures consistency across different market conditions by adjusting for volatility.
⚪ Average Wave and Max Wave
These metrics analyze the size of bullish and bearish waves over a specified Lookback Period:
Average Wave: This represents the mean size of bullish and bearish movements, helping traders gauge overall market strength.
Max Wave: Highlights the largest movements within the period, identifying peak momentum during trend surges.
⚪ Current Wave Ratio
This feature compares the current wave's size against historical data:
Average Wave Ratio: Indicates if the current momentum exceeds historical averages. A value above 1 suggests the trend is gaining strength.
Max Wave Ratio: Shows whether the current wave surpasses previous peak movements, signaling potential breakouts or trend accelerations.
⚪ Dominance
Dominance metrics reveal whether bulls or bears have controlled the market during the Lookback Period:
Average Dominance: Compares the net difference between average bullish and bearish wave sizes.
Max Dominance: Highlights which side had the stronger individual waves, indicating key power shifts in market dynamics.
Positive values suggest bullish dominance, while negative values point to bearish control. This helps traders confirm trend direction or anticipate reversals.
█ How to Use
Identify Trends: Leverage the color-coded candlesticks and dynamic trend line to assess the overall market direction with clarity.
Monitor Momentum: Use the Trend Speed histogram to track changes in momentum, identifying periods of acceleration or deceleration.
Analyze Waves: Compare the sizes of bullish and bearish waves to identify the prevailing market bias and detect potential shifts in sentiment. Additionally, fluctuations in Current Wave ratio values should be monitored as early indicators of possible trend reversals.
Evaluate Dominance: Utilize dominance metrics to confirm the strength and direction of the current trend.
█ Settings
Maximum Length: Sets the smoothing of the trend line.
Accelerator Multiplier: Adjusts sensitivity to price changes.
Lookback Period: Defines the range for wave calculations.
Enable Table: Displays statistical metrics for in-depth analysis.
Enable Candles: Activates color-coded candlesticks.
Collection Period: Normalizes trend speed values for better accuracy.
Start Date: Limits calculations to a specific timeframe.
Timer Option: Choose between using all available data or starting from a custom date.
-----------------
Disclaimer
The information contained in my Scripts/Indicators/Ideas/Algos/Systems does not constitute financial advice or a solicitation to buy or sell any securities of any type. I will not accept liability for any loss or damage, including without limitation any loss of profit, which may arise directly or indirectly from the use of or reliance on such information.
All investments involve risk, and the past performance of a security, industry, sector, market, financial product, trading strategy, backtest, or individual's trading does not guarantee future results or returns. Investors are fully responsible for any investment decisions they make. Such decisions should be based solely on an evaluation of their financial circumstances, investment objectives, risk tolerance, and liquidity needs.
My Scripts/Indicators/Ideas/Algos/Systems are only for educational purposes!

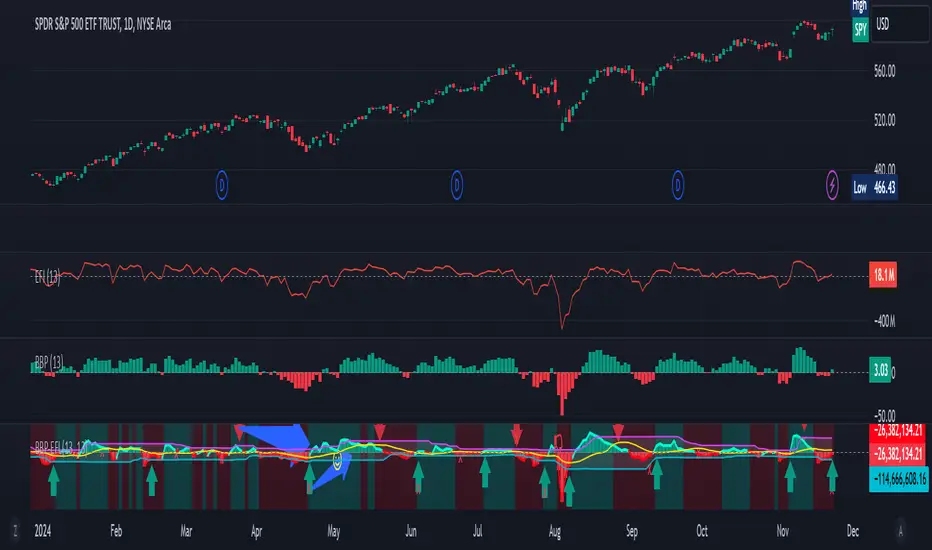
Gabriel's Bull Bear Power Elder's Force IndexGabriel's Bull Bear Power Elder's Force Index (BBP-EFI) Indicator!
The Bull and Bear Power indicators were created by Dr. Alexander Elder, a renowned trader, psychologist, and author. He introduced these indicators in his book, "Trading for a Living" (1993). These tools are part of Elder's broader trading system and are designed to measure the strength of buying (bull) and selling (bear) pressures in the market.
About the Bull and Bear Power Indicators
Bull Power:
Measures the strength of buyers.
Formula:
Bull Power = High Price - Exponential Moving Average (EMA(Close))
Bull Power2 = High Price − Exponential Moving Average (EMA(Close))
Bear Power:
Measures the strength of sellers.
Formula:
Bear Power = Low Price − Exponential Moving Average (EMA)
Bear Power2 = Low Price−Exponential Moving Average (EMA)
Purpose:
These indicators work together to determine the balance of power between bulls and bears.
When combined with a trend indicator (like an EMA), they help identify potential trend reversals or continuations.
Other Indicators/Systems by Dr. Alexander Elder
Elder-Ray Index:
The Bull Power and Bear Power indicators are part of the Elder-Ray Index system.
This system combines Bull Power, Bear Power, and an EMA to analyze market trends and momentum.
Elder's Triple Screen Trading System:
One of Dr. Elder's most famous contributions.
A multi-timeframe trading system that combines trend-following indicators on higher timeframes with oscillators on lower timeframes.
Example:
Screen 1: Identify the trend on a higher timeframe using moving averages or MACD.
Screen 2: Use an oscillator such as Elder's Bull-Bear Power! or (e.g., Stochastic, RSI) to find entry points.
Screen 3: Use price action or breakouts for precise entries.
Elder's Force Index:
Measures the strength of bulls or bears by combining price changes and volume.
Formula:
Force Index = (Close − Close 𝑡 − 1) × Volume
Force Index = (Close t − Close t−1) × Volume
This is useful for identifying trend strength, momentum, and potential reversals.
Legacy of Dr. Alexander Elder
Dr. Elder’s work emphasizes:
Psychology in Trading:
As a trained psychiatrist, he highlights the importance of emotional discipline and understanding market psychology.
Multi-Factor Analysis:
He encourages using multiple indicators and timeframes for comprehensive analysis.
His contributions, particularly the Bull/Bear Power, Elder's Force Index, and the Triple Screen Trading System, remain highly respected and widely used in modern trading. I put the two famous indicators together, and I use the Triple Screen Trading system to trade with it!
Gabriel's Elder's Two-In-One Indicator:
The Bull Bear Power Elder's Force Index (BBP-EFI) is a custom technical indicator designed to analyze market momentum and identify potential trend reversals by combining the concepts of Elder's Force Index with Bull and Bear Power indicators. It offers traders a comprehensive view of buying and selling pressures in the market, helping to make more informed trading decisions.
Key Components:
First is Elder's Force Index (EFI):
Definition: Measures the strength of price movements multiplied by volume, reflecting the force behind price changes.
Calculation:
EFI for Close Prices: eficlose = EMA(change(close) * volume, length)
EFI for High Prices: efihigh = EMA(change(high) * volume, length)
EFI for Low Prices: efilow = EMA(change(low) * volume, length)
Note: length is a user-defined input for the EMA period.
Second is calculating the Bull and Bear Power using EFI as the Source:
Bull Power: Reflects the ability of buyers to push prices above the average consensus (EMA of EFI Close).
Calculation: bullPower = efihigh - EMA(eficlose, lengthInput)
Bear Power: Reflects the ability of sellers to push prices below the average consensus.
Calculation: bearPower = efilow - EMA(eficlose, lengthInput)
Note: lengthInput is a separate user-defined input for the EMA period in Bull and Bear Power calculations.
Bull Bear Power (BBP):
Calculation: bbp = bullPower + bearPower
Interpretation:
Positive BBP: Indicates bullish momentum.
Negative BBP: Indicates bearish momentum.
Features:
Customizable Parameters:
Elder's Force Index Length (length): Adjusts the sensitivity of the EFI calculation.
Bull Bear Power Length (lengthInput): Adjusts the sensitivity of the Bull and Bear Power calculations.
Moving Average Type (maTypeInput): Options include SMA, EMA, SMMA (RMA), WMA, VWMA, or none.
Moving Average Length (maLengthInput): Period for smoothing the BBP.
Bollinger Bands (bbMultInput): Applies Bollinger Bands to the SMA of BBP with customizable standard deviation multiplier.
Overbought and Oversold Bands:
Dynamic Calculation: Based on historical BBP values over a period determined by the average of length and lengthInput.
Levels (leveling): User-defined percentage to determine the overbought and oversold thresholds.
Visualization: Plots upper (ub) and lower (db) bands on the chart with optional fill between them.
Divergence Detection:
Bullish Divergence: Occurs when price makes a lower low while BBP makes a higher low, suggesting a potential upward reversal.
Bearish Divergence: Occurs when price makes a higher high while BBP makes a lower high, suggesting a potential downward reversal.
Customization:
Lookback Periods (lookbackLeft, lookbackRight): Adjusts the sensitivity of pivot detection for divergences.
Range Settings (rangeUpper, rangeLower): Defines the acceptable range of bars between pivot points.
Alerts:
Overbought/Oversold Alerts: Can be set to trigger when BBP crosses the calculated bands.
Divergence Alerts: Notifies when bullish or bearish divergences are detected.
Visualization:
Histogram and Line Plot: BBP is displayed both as a histogram and a line for better visualization.
Color Coding: Positive values in green shades (bullish), negative values in red shades (bearish).
Moving Average Plot: Optional smoothing line plotted over the BBP.
Bollinger Bands: Upper and lower bands plotted when the SMA + Bollinger Bands option is selected.
Background Coloring: Highlights areas where BBP crosses over or under the moving average.
How to Use the Indicator:
Identifying Trends:
Bullish Momentum: When BBP is above zero and rising, it indicates increasing buying pressure.
Bearish Momentum: When BBP is below zero and falling, it indicates increasing selling pressure.
Overbought/Oversold Conditions:
Overbought: When BBP rises above the upper band (ub), the market may be overextended on the buy side.
Oversold: When BBP falls below the lower band (db), the market may be overextended on the sell side.
Divergence Signals:
Bullish Divergence: Consider buying opportunities when a bullish divergence is detected.
Bearish Divergence: Consider selling or shorting opportunities when a bearish divergence is detected.
Smoothing with Moving Averages:
Trend Confirmation: Use the moving average of BBP to confirm trends and filter out noise.
Crossovers: BBP crossing above the moving average may signal a bullish trend, while crossing below may signal a bearish trend.
Bollinger Bands Application:
Volatility Assessment: Bollinger Bands widen during high volatility and narrow during low volatility.
Breakout Signals: A move outside the bands may indicate a strong trend continuation or reversal.
Settings and Inputs:
Bull Bear Power - Elder's Force Index Settings:
Elder's Force Index Length (length): Default is 13.
Bull Bear Power Length (lengthInput): Default is 13.
Calculate Oversold and Overbought Bands (calculateBands): Enables band calculation for alerts.
Calculate Divergence (calculateDivergence): Enables divergence detection and alerts.
BBP-EFI Moving Average:
Type (maTypeInput): Choose from "None", "SMA", "SMA + Bollinger Bands", "EMA", "SMMA (RMA)", "WMA", "VWMA".
Length (maLengthInput): Default is 14.
BB StdDev (bbMultInput): Standard deviation multiplier for Bollinger Bands; default is 2.0.
Important Notes:
Volume Data Requirement: The indicator relies on volume data for the EFI calculation. If volume data is not available from your data provider, the indicator will not function and will display an error.
Customization: Adjust the input parameters to suit different time frames and trading styles. Shorter lengths make the indicator more sensitive but may increase false signals.
Complementary Use: It is recommended to use the BBP-EFI in conjunction with other technical analysis tools and not as a standalone indicator.
Alerts Configuration: Ensure alerts are properly set up in your trading platform to receive notifications based on the indicator's signals.
Example Usage Scenario:
Trend Confirmation: A trader observes that BBP has crossed above zero and the smoothing moving average, with a rising histogram. This suggests a strengthening bullish trend, and the trader considers entering a long position.
Overbought Condition: BBP reaches above the upper overbought band. The trader watches closely for any signs of reversal or divergence to secure profits or tighten stop-loss orders.
Bullish Divergence: Despite price making a lower low, BBP makes a higher low, triggering a bullish divergence alert. The trader anticipates a potential trend reversal and prepares to enter a long position.
By combining momentum, volume, and price action analysis, the Bull Bear Power Elder's Force Index indicator provides a multifaceted view of market dynamics, aiding traders in making more nuanced and timely trading decisions.
Happy Thanksgiving!
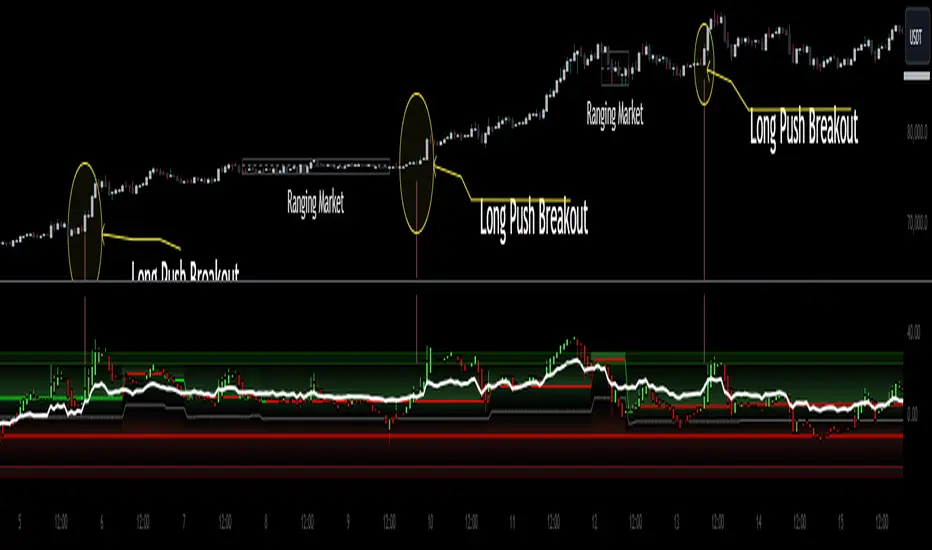
Heiken Ashi Algo Premium KillZoneTraders face daily challenges in navigating the fast-paced market, from waiting for higher timeframe data to delayed confirmation signals. This innovative system changes everything, offering tools that have never before been available in the trading community. With groundbreaking features like
KillZones
High Timeframe RSI (HTF RSI) and
True Midline
this system is seeks to solve major problems that hurt traders every day.
KillZones give traders an edge by pinpointing critical price levels where momentum and liquidity shift.
The Custom High Timeframe RSI brings real-time higher timeframe trend confirmation directly to your chart, eliminating the need to wait for candles to close. A totally new way to calculate HTF RSI without waiting for higher time candles to close.
The True Midline adjusts dynamically, showing exactly when the market is in equilibrium or transitioning between bullish and bearish momentum.
Custom Heiken-Ashi Oscillator Candles:
It uses customized Heiken Ashi candle calculations that allow it present trends more accurately while the candles are limited to an oscillator as opposed to price values. Candle up or candle down doesnt always mean long or short. Ive included a setting called "Secret Sauce Colors" to alter the colors of the Heiken Ashi candles so they will be colored to the actual trend taking place instead of just bullish or bearish closing.
The Liquidity Ribbon:
This indicator contains a built in customized version of a Stochastic Oscillator called "The Liquidity Ribbon" which shows you when liquidity of either side is entering and existing the market. It uses calculations of market and volume pressure to give you a visual representation of who is trying to alter asset pricing. This is NOT the stochastic RSI but I've given you guys an visual approach of something that looks similar.
The ribbon has bullish and bearish sides that flip over eachother. As one grows, the other shrinks so yo u can see in real time the flow of money from either side and whos winning.
Bullish and Bearish Premium and Discount Zones
What Are They?
Bullish and Bearish Premium and Discount Zones are visualized on the indicator as distinct colored sections within the oscillator, providing a quick snapshot of market conditions:
Bearish Premium Zone: Indicates areas of overextension in bearish momentum, often associated with ranging markets.
Bearish Discount Zone: Highlights opportunities where bearish trends are gaining strength and momentum is trending.
Bullish Discount Zone: Marks areas in bullish conditions where the market is consolidating or ranging.
Bullish Premium Zone: Identifies zones where bullish momentum is strong and trends are more pronounced.
How to Use Them?
For long trades, consider the following:
Scalping Opportunities: When the market is trending higher and Heiken-Ashi candles are closing above the high-timeframe RSI, short-term long scalps can be executed in the Discount Bullish Zone, where consolidation occurs.
Trending Trades: Larger, more sustained long trades can be taken when price moves into the Premium Bullish Zone, signaling stronger upward momentum.
Breakout Trading: When price crosses into a trending zone and simultaneously breaks through previous price resistance or support, this confluence solidifies entries for breakout trades across previous highs or lows, providing a higher probability for successful trades.
This structured use of Premium and Discount Zones gives traders a clear edge, offering insights into both market range and trend strength.
True Midline
What Is It?
The True Midline represents the dynamic equilibrium between buyers and sellers, adapting to real-time market activity. Unlike fixed midlines in traditional oscillators, it adjusts based on where buyers and sellers enter and exit the market.
How Does It Work?
The midline accounts for four key activities: buyer entry, buyer exit, seller entry, and seller exit. This holistic approach highlights shifts in momentum and periods of reduced activity, such as when both buyers and sellers exit simultaneously, creating larger ranging zones.
How to Use It?
Consolidation Zones: Narrow midline ranges signal market indecision, often preceding breakouts.
Momentum Shifts: Crossing above or below the midline indicates transitions into bullish or bearish conditions.
Ranging Markets: Identifies reduced interest during simultaneous buyer and seller exits, helping avoid false signals.
The True Midline offers a clearer picture of market balance, helping traders navigate trends and consolidations with confidence.
Dynamic Trending Zones:
What Are They?
Dynamic Trending Zones represent areas of high volatility and breakout potential, reflecting shifts in market momentum and participation. These zones are self-adjusting and directly influence the midline's position.
There are two zones:
Bullish Trending Zone: Signals increased buyer momentum.
Bearish Trending Zone: Signals increased seller momentum.
How Are They Calculated?
The zones are derived using a combination of volume pressure and momentum changes, but these changes need to be sufficient to have moved price over time:
The indicator tracks sudden shifts in momentum relative to volume changes to identify critical thresholds for breakouts.
A "need-to-cross" point is established in each zone, acting as a breakout trigger.
If opposing or additional volume and momentum are insufficient, the zone remains unchanged until market conditions shift.
This ensures the zones dynamically adapt to real-time market activity while maintaining accuracy during periods of indecision or consolidation.
How to Use Them?
Bullish Breakouts: Crossing into the bullish zone and breaking a previous resistance signals strong buyer momentum. Check for contraction in the bearish zone to confirm dominance.
Bearish Breakouts: Similarly, crossing into the bearish zone while breaking a support level confirms seller strength.
Momentum Confirmation: Ensure current momentum is leading the high-timeframe RSI for more reliable trade setups.
Zone Analysis : Expansion of a zone signals increased participation (e.g., more buyers or sellers entering), while contraction indicates reduced activity or that buyers and or sellers are closing their positions.
These zones provide actionable insights into breakout potential and market momentum, helping traders make informed decisions in volatile conditions.
High Timeframe RSI (HTF RSI)
What Is It?
The High Timeframe RSI gives you real-time higher timeframe RSI values directly on your lower timeframe chart. This means you don’t have to wait for the higher timeframe candle to close before seeing the RSI updates—it’s always live.
Why Is It Needed?
Normally, to see the RSI on a higher timeframe, you have to wait for that timeframe to close. This can be slow and lead to missed opportunities. The HTF RSI solves this by showing you the higher timeframe RSI values as soon as each lower timeframe candle closes, giving you faster insights and no delays.
How It works?
Rather than just using the standard RSI, the HTF RSI compares the momentum on your current timeframe with what it would be on the higher timeframe. It takes into account how many candles on your current chart fit into each higher timeframe candle. This makes sure that the higher timeframe RSI is accurate and reflects the real momentum, even when switching between timeframes.
How to Use It?
Trend Confirmation:
When the HTF RSI is above the midline, it shows a bullish trend on the higher timeframe, and if your current momentum is also bullish, it strengthens your trade setup.
When the HTF RSI is below the midline, it shows a bearish trend, and if your current momentum is bearish, it supports short trade setups.
If bearish momentum is above the HTF RSI, it suggests a local downtrend within a larger bullish trend.
Major Benefits
Custom Timeframes: You can use any higher timeframe you choose, not just the typical ones.
Real-Time Updates: Get higher timeframe RSI values with each candle, without delays.
Better Trading Insights: Align your trades with both lower and higher timeframe trends to make more informed decisions.
With HTF RSI, you get a clear view of higher timeframe trends in real time, so you can act faster and smarter on your trades.
Candle Spread
Candle Spread is an indicator that helps traders measure the range of price movement within each candle over a specified time period. It calculates the range of the candle between the High and Low (High - Low) and displays it in a separate window below the chart as columns.
Key Features:
Colored Bars: The bars are colored based on the candle's direction:
Bullish Candle: Bars are Green.
Bearish Candle: Bars are Red.
Moving Average: The indicator includes a 30-period Simple Moving Average (SMA), which represents the overall average range of the candles.
Helps Identify Market Volatility: This indicator helps traders identify wide-range candles (signaling high volatility in the market), which could indicate a surge in momentum or potential trend reversals.

TechniTrendMasterIntroducing "TechniTrendMaster"
The TechniTrendMaster indicator is designed to bring clarity and depth to your trading strategy. This indicator combines robust trend analysis with volume insights, giving you a comprehensive view of the market’s pulse. Let's break down the features.
🔵 Analysis Mode
TechniTrendMaster's Analysis Mode provides various configurations tailored to specific market behaviors. Here are the options you can utilize:
🔹Strong Movements: Focuses on powerful market shifts, ideal for capturing major trend changes and high-momentum moves. Perfect for identifying strong breakout opportunities.
🔹Reversal: Detects potential turning points in the market, signaling when a trend might be about to change direction, allowing for well-timed entries and exits.
🔹Consolidations: Spots periods of low volatility where the market moves sideways, helping you avoid trading traps and anticipate breakout scenarios.
🔹Momentum-Driven: Prioritizes momentum in the market, identifying when the force behind price movement is accelerating or decelerating.
🔹Balanced: Offers a well-rounded view of the market by weighing both trend direction and volume equally, making it suitable for stable market conditions.
🔹Volatility Adapted: Adjusts to periods of increased or decreased volatility, providing accurate signals regardless of market conditions.
🔹Trend Confirmation: Confirms the strength and sustainability of a trend, allowing traders to enter trades with higher confidence.
🔹Short-Term Scalping: Tailored for traders who focus on Short-Term and Scalp trades, offering rapid insights for intraday or short-term trading strategies.
🔵 Trend Analysis Mode
The Trend Analysis Mode allows you to customize how trends are detected and analyzed:
🔹Default: A balanced mode for general use, offering reliable trend identification across different market conditions.
🔹Aggressive: A more sensitive setting that reacts quickly to market changes, ideal for traders looking to capitalize on smaller, quicker movements.
🔹Conservative: Takes a cautious approach, favoring long-term stability over short-term fluctuations, perfect for risk-averse traders.
🔹Volatility Aware: Focuses on adapting to volatility shifts, giving accurate trend signals even in erratic markets.
🔹Range Bound: Targets horizontal price movements and channel trades, helping traders take advantage of well-defined ranges.
🔵 Divergence
Divergence is a powerful tool within TechniTrendMaster, highlighting discrepancies between price movement and underlying volume. These differences can indicate potential reversals or trend continuations before they are visible on price charts alone.
🔵 Hidden Divergence
Hidden divergence is a subtle yet crucial signal that reveals when an existing trend might resume after a temporary correction. This mode provides early detection of trend continuity opportunities, giving traders a significant advantage in timing.
🔵 Divergence Mode
TechniTrendMaster includes different divergence detection settings to suit your analysis style:
🔹Standard: Captures typical divergence patterns for general analysis.
🔹Short-Term Focused: Concentrates on short-lived divergences, offering rapid detection of shifts for active traders.
🔹Long-Term Analysis: Highlights divergence in a broader context, which is better for understanding the overall market direction.
🔹High Sensitivity: Prioritizes capturing even the smallest shifts in the market, making it excellent for high-frequency trading or volatile environments.
🔹Low Sensitivity: Reduces market noise, only reacting to more significant changes in trend or volume. It’s perfect for traders who seek higher accuracy with fewer false signals.
🔵 Dynamic Channel
TechniTrendMaster features a Dynamic Channel, that automatically adapts to market conditions. This channel provides a visual guide to price action, adjusting in real-time based on current trends and volatility. It identifies key support and resistance zones, making it easier to spot breakouts, trend continuations, or potential reversals.
🔵 Volume Integration
Volume is a critical part of TechniTrendMaster, offering deeper insights beyond just price movement. By analyzing volume patterns alongside trends, the indicator highlights the strength and reliability of market shifts. This integration ensures that traders can distinguish between genuine movements backed by solid volume and weak trends that might not hold.
🔵 A Solution for All Trading Styles
TechniTrendMaster’s strength lies in its versatility. No matter your trading approach—be it scalping, swing trading, trend following, or range trading—this indicator adapts to your needs. Here's how it caters to different trader profiles:
🔹Scalpers get precise, quick-response insights through the Short-Term Scalping and High Sensitivity settings, helping them capture minute price movements.
🔹Swing Traders benefit from modes like Reversal, Balanced, and Momentum-Driven, which focus on identifying trends and shifts that occur over several days.
🔹Long-Term Investors will find the Conservative, Low Sensitivity, and Long-Term Analysis modes ideal for filtering noise and sticking to broader market trends.
🔹Volatility Traders can rely on the Volatility Adapted and Volatility Aware options to get accurate signals even during unpredictable periods.
🔓 Unlock Access :
Check out the Author's Instructions or Dm me to Unlock the Access.

NASI +The NASI + indicator is an advanced adaptation of the classic McClellan Oscillator, a tool widely used to gauge market breadth. It calculates the McClellan Oscillator by measuring the difference between the 19-day and 39-day EMAs of net advancing issues, which are optionally adjusted to account for the relative strength of advancing vs. declining stocks.
To enhance this analysis, NASI + applies the Relative Strength Index (RSI) to the cumulative McClellan Oscillator values, generating a unique momentum-based view of market breadth. Additionally, two extra EMAs—a 10-day and a 4-day EMA—are applied to the RSI, providing further refinement to signals for overbought and oversold conditions.
With NASI +, users benefit from:
-A deeper analysis of market momentum through cumulative breadth data.
-Enhanced sensitivity to trend shifts with the applied RSI and dual EMAs.
-Clear visual cues for overbought and oversold conditions, aiding in intuitive signal identification.

CMF and Scaled EFI OverlayCMF and Scaled EFI Overlay Indicator
Overview
The CMF and Scaled EFI Overlay indicator combines the Chaikin Money Flow (CMF) and a scaled version of the Elder Force Index (EFI) into a single chart. This allows traders to analyze both indicators simultaneously, facilitating better insights into market momentum and volume dynamics , specifically focusing on buying/selling pressure and momentum , without compromising the integrity of either indicator.
Purpose
Chaikin Money Flow (CMF): Measures buying and selling pressure by evaluating price and volume over a specified period. It indicates accumulation (buying pressure) when values are positive and distribution (selling pressure) when values are negative.
Elder Force Index (EFI): Combines price changes and volume to assess the momentum behind market moves. Positive values indicate upward momentum (prices rising with strong volume), while negative values indicate downward momentum (prices falling with strong volume).
By scaling the EFI to match the amplitude of the CMF, this indicator enables a direct comparison between pressure and momentum , preserving their shapes and zero crossings. Traders can observe the relationship between price movements, volume, and momentum more effectively, aiding in decision-making.
Understanding Pressure vs. Momentum
Chaikin Money Flow (CMF):
- Indicates the level of demand (buying pressure) or supply (selling pressure) in the market based on volume and price movements.
- Accumulation: When institutional or large investors are buying significant amounts of an asset, leading to an increase in buying pressure.
- Distribution: When these investors are selling off their holdings, increasing selling pressure.
Elder Force Index (EFI):
- Measures the strength and speed of price movements, indicating how forceful the current trend is.
- Positive Momentum: Prices are rising quickly, indicating a strong uptrend.
- Negative Momentum: Prices are falling rapidly, indicating a strong downtrend.
Understanding the difference between pressure and momentum is crucial. For example, a market may exhibit strong buying pressure (positive CMF) but weak momentum (low EFI), suggesting accumulation without significant price movement yet.
Features
Overlay of CMF and Scaled EFI: Both indicators are plotted on the same chart for easy comparison of pressure and momentum dynamics.
Customizable Parameters: Adjust lengths for CMF and EFI calculations and fine-tune the scaling factor for optimal alignment.
Preserved Indicator Integrity: The scaling method preserves the shape and zero crossings of the EFI, ensuring accurate analysis.
How It Works
CMF Calculation:
- Calculates the Money Flow Multiplier (MFM) and Money Flow Volume (MFV) to assess buying and selling pressure.
- CMF is computed by summing the MFV over the specified length and dividing by the sum of volume over the same period:
CMF = (Sum of MFV over n periods) / (Sum of Volume over n periods)
EFI Calculation:
- Calculates the EFI using the Exponential Moving Average (EMA) of the price change multiplied by volume:
EFI = EMA(n, Change in Close * Volume)
Scaling the EFI:
- The EFI is scaled by multiplying it with a user-defined scaling factor to match the CMF's amplitude.
Plotting:
- Both the CMF and the scaled EFI are plotted on the same chart.
- A zero line is included for reference, aiding in identifying crossovers and divergences.
Indicator Settings
Inputs
CMF Length (`cmf_length`):
- Default: 20
- Description: The number of periods over which the CMF is calculated. A higher value smooths the indicator but may delay signals.
EFI Length (`efi_length`):
- Default: 13
- Description: The EMA length for the EFI calculation. Adjusting this value affects the sensitivity of the EFI to price changes.
EFI Scaling Factor (`efi_scaling_factor`):
- Default: 0.000001
- Description: A constant used to scale the EFI to match the CMF's amplitude. Fine-tuning this value ensures the indicators align visually.
How to Adjust the EFI Scaling Factor
Start with the Default Value:
- Begin with the default scaling factor of `0.000001`.
Visual Inspection:
- Observe the plotted indicators. If the EFI appears too large or small compared to the CMF, proceed to adjust the scaling factor.
Fine-Tune the Scaling Factor:
- Increase or decrease the scaling factor incrementally (e.g., `0.000005`, `0.00001`, `0.00005`) until the amplitudes of the CMF and EFI visually align.
- The optimal scaling factor may vary depending on the asset and timeframe.
Verify Alignment:
- Ensure that the scaled EFI preserves the shape and zero crossings of the original EFI.
- Overlay the original EFI (if desired) to confirm alignment.
How to Use the Indicator
Analyze Buying/Selling Pressure and Momentum:
- Positive CMF (>0): Indicates accumulation (buying pressure).
- Negative CMF (<0): Indicates distribution (selling pressure).
- Positive EFI: Indicates positive momentum (prices rising with strong volume).
- Negative EFI: Indicates negative momentum (prices falling with strong volume).
Look for Indicator Alignment:
- Both CMF and EFI Positive:
- Suggests strong bullish conditions with both buying pressure and upward momentum.
- Both CMF and EFI Negative:
- Indicates strong bearish conditions with selling pressure and downward momentum.
Identify Divergences:
- CMF Positive, EFI Negative:
- Buying pressure exists, but momentum is negative; potential for a bullish reversal if momentum shifts.
- CMF Negative, EFI Positive:
- Selling pressure exists despite rising prices; caution advised as it may indicate a potential bearish reversal.
Confirm Signals with Other Analysis:
- Use this indicator in conjunction with other technical analysis tools (e.g., trend lines, support/resistance levels) to confirm trading decisions.
Example Usage
Scenario 1: Bullish Alignment
- CMF Positive: Indicates accumulation (buying pressure).
- EFI Positive and Increasing: Shows strengthening upward momentum.
- Interpretation:
- Strong bullish signal suggesting that buyers are active, and the price is likely to continue rising.
- Action:
- Consider entering a long position or adding to existing ones.
Scenario 2: Bearish Divergence
- CMF Negative: Indicates distribution (selling pressure).
- EFI Positive but Decreasing: Momentum is positive but weakening.
- Interpretation:
- Potential bearish reversal; price may be rising but underlying selling pressure suggests caution.
- Action:
- Be cautious with long positions; consider tightening stop-losses or preparing for a possible trend reversal.
Tips
Adjust for Different Assets:
- The optimal scaling factor may differ across assets due to varying price and volume characteristics.
- Always adjust the scaling factor when analyzing a new asset.
Monitor Indicator Crossovers:
- Crossings above or below the zero line can signal potential trend changes.
Watch for Divergences:
- Divergences between the CMF and EFI can provide early warning signs of trend reversals.
Combine with Other Indicators:
- Enhance your analysis by combining this overlay with other indicators like moving averages, RSI, or Ichimoku Cloud.
Limitations
Scaling Factor Sensitivity:
- An incorrect scaling factor may misalign the indicators, leading to inaccurate interpretations.
- Regular adjustments may be necessary when switching between different assets or timeframes.
Not a Standalone Indicator:
- Should be used as part of a comprehensive trading strategy.
- Always consider other market factors and indicators before making trading decisions.
Disclaimer
No Guarantee of Performance:
- Past performance is not indicative of future results.
- Trading involves risk, and losses can exceed deposits.
Use at Your Own Risk:
- This indicator is provided for educational purposes.
- The author is not responsible for any financial losses incurred while using this indicator.
Code Summary
//@version=5
indicator(title="CMF and Scaled EFI Overlay", shorttitle="CMF & Scaled EFI", overlay=false)
cmf_length = input.int(20, minval=1, title="CMF Length")
efi_length = input.int(13, minval=1, title="EFI Length")
efi_scaling_factor = input.float(0.000001, title="EFI Scaling Factor", minval=0.0, step=0.000001)
// --- CMF Calculation ---
ad = high != low ? ((2 * close - low - high) / (high - low)) * volume : 0
mf = math.sum(ad, cmf_length) / math.sum(volume, cmf_length)
// --- EFI Calculation ---
efi_raw = ta.ema(ta.change(close) * volume, efi_length)
// --- Scale EFI ---
efi_scaled = efi_raw * efi_scaling_factor
// --- Plotting ---
plot(mf, color=color.green, title="CMF", linewidth=2)
plot(efi_scaled, color=color.red, title="EFI (Scaled)", linewidth=2)
hline(0, color=color.gray, title="Zero Line", linestyle=hline.style_dashed)
- Lines 4-6: Define input parameters for CMF length, EFI length, and EFI scaling factor.
- Lines 9-11: Calculate the CMF.
- Lines 14-16: Calculate the EFI.
- Line 19: Scale the EFI by the scaling factor.
- Lines 22-24: Plot the CMF, scaled EFI, and zero line.
Feedback and Support
Suggestions: If you have ideas for improvements or additional features, please share your feedback.
Support: For assistance or questions regarding this indicator, feel free to contact the author through TradingView.
---
By combining the CMF and scaled EFI into a single overlay, this indicator provides a powerful tool for traders to analyze market dynamics more comprehensively. Adjust the parameters to suit your trading style, and always practice sound risk management.

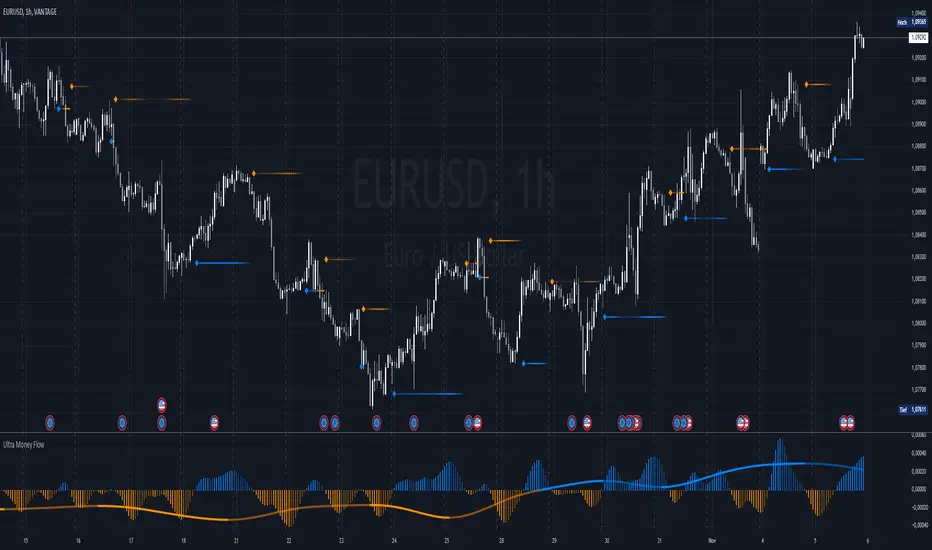
Ultra Money FlowIntroduction
The Ultra Money Flow script is a technical indicator for analyzing stock trends. It highlights buying and selling power, helping you identify bullish (rising) or bearish (falling) market trends.
Detailed Description
The Ultra Money Flow script calculates and visually displays two main components: Fast and Slow money flow. These components represent short-term and long-term trends, respectively.
Here's how it works:
.........
Inputs
You can adjust the speed of analysis (Fast Length and Slow Length) and the type of smoothing applied (e.g., Simple Moving Average, Exponential Moving Average).
Choose colors for visualizing the trends, with blue for bullish (positive) and orange for bearish (negative) movements.
.....
Money Flow Calculation
The script analyzes price changes (delta) over specified periods.
It separates upward price movements (buying power) from downward ones (selling power).
It then calculates the difference between these powers for both Fast and Slow components.
The types of smoothing methods range from traditional ones like the Simple Moving Average (SMA) to advanced ones like the Double Expotential Moving Average (DEMA) or the Triple Exponential Moving Average (TEMA) or the Recursive Moving Average (RMA) or the Weigthend Moving Average (WMA) or the Volume Weigthend Moving Average (VWMA) or Hull Moving Average (HMA).
Very Special ones are the Triple Weigthend Moving Average (TWMA) wich created RedKTrader .
I created the Multi Weigthend Moving Average (MWMA) wich is a simple signal line to the TWMA.
.....
Divergence
This indicator can show divergence by comparing the direction of price movements with the indicator value.
If the price and the indicator move in opposite directions, you can use these signals to help decide when to buy or sell.
.....
Auto Scaling
The script adjusts its calculations based on the time frame you are viewing, whether it's minutes, hours, or days, ensuring accurate representation across different time scales.
.....
Plotting
The script plots the Fast component as a histogram and the Slow component as a line, using the chosen colors to indicate bullish or bearish trends.
The thickness and transparency of these plots give additional clues about the strength of the trend.
.........
By using this indicator, traders can easily spot shifts in buying and selling power, allowing for better-informed decisions in the market.
Special Thanks
I use the TWMA-Function created from RedKTrader to smooth the values.
Special thanks to him for creating and sharing this function!
Advanced Stochastic ForLoopAdvanced Stochastic ForLoop
OVERVIEW
Advanced Stochastic ForLoop is an improved version of Stochastic it is designed to calculate an array of values 1 or -1 depending if soruce for calculations is above or below basis.
It takes avereage of values over a range of lengths, providing trend signals smothed based on various moving averages in order to get rid of noise.
It offers flexibility with different signal modes and visual customizations.
TYPE OF SIGNALS
-FAST (MA > MA or MA > 0.99)
-SLOW (MA > 0)
-THRESHOLD CROSSING (set by user treshold for both directions)
-FAST THRESHOLD (when theres an change in signal by set margin e.g 0.4 -> 0.2 means bearsih when FT is set to 0.1, when MA is > 0.99 it will signal bullish, when MA < -0.99 it will signal bearish)
Generaly Lime color of line indicates Bullish, Fuchsia indicates Bearish.
This colors are not set in stone so you can change them in settings.
Alerts included when line color is:
-Bullish Trend, line color is lime
-Bearish Trend, line color is fuchsia
Credit
Idea for this script was from one of indicators created by www.tradingview.com
Warning
This indicator can be really noisy depending on the settings, signal mode so it should be used preferably as a part of an strategy not as a stand alone indicator
Remember the lower the timeframe you use the more noise there is.
No single indicator should be used alone when making investment decisions.

Adaptive Momentum Oscillator [BackQuant]Adaptive Momentum Oscillator
Please take time to read the following.
Conceptual Foundation and Innovation
The Adaptive Momentum Oscillator brings a new approach to momentum trading by introducing percentile-based adaptive thresholding. Unlike traditional momentum oscillators that rely on static overbought and oversold levels, this indicator adjusts dynamically to changing market conditions, providing more relevant signals in real-time. By combining percentile-based thresholds with a smoothed momentum oscillator, this tool allows traders to detect trend shifts with a higher degree of accuracy.
Technical Composition and Calculation
The core of this oscillator uses a lookback period to calculate the highest and lowest values of a smoothed price source (using a non-robust moving average). These values are then used to compute the oscillator, which normalizes the current price between the lookback high and low. The true innovation lies in its adaptive thresholds, which adjust based on percentiles of past oscillator values over a user-defined lookback period.
Lookback Period: The indicator checks the highest and lowest smoothed price over a set period, which becomes the basis for calculating momentum.
Percentile-Based Thresholds: The upper and lower thresholds are dynamically set at user-defined percentiles of historical momentum values, allowing the oscillator to adapt to the volatility and strength of the market.
Smoothing Length: Users can adjust the smoothing of the source input to fine-tune the sensitivity of the oscillator.
Features and User Inputs offer a host of customizable settings to suit different market conditions and trading strategies:
Adaptive Thresholding: Traders can set the lookback period and define the percentile levels for the upper (long) and lower (short) thresholds. This provides the ability to dynamically adjust to changing market conditions and avoid static thresholds that may become irrelevant over time.
Signal Line Customization: Users can configure the signal line width, colors for long, short, and neutral conditions, and choose whether to display adaptive threshold lines on the chart.
Candle Coloring: An optional feature allows traders to color the price bars based on the oscillator's trend signal, adding a visual confirmation layer for trend shifts.
Practical Applications
This oscillator is particularly effective in markets where the strength and direction of momentum are essential for identifying potential trend reversals or confirming ongoing trends. Traders can leverage the Adaptive Momentum Oscillator to:
Capture Adaptive Trends: The percentile-based thresholds adjust dynamically, ensuring that traders catch significant trends while filtering out market noise.
Avoid False Signals: By adapting to historical momentum levels, the oscillator reduces the risk of false breakouts or breakdowns, allowing for more reliable entries and exits.
Optimize Entries and Exits: With dynamically adjusting thresholds, the oscillator helps traders time their positions more effectively, minimizing the risk of getting caught in choppy or uncertain markets.
Advantages and Strategic Value
It offers a clear advantage over traditional static oscillators by continuously adjusting its sensitivity to market conditions. The adaptive percentile thresholds ensure that the indicator remains relevant, regardless of changes in volatility or market direction. This feature, combined with a customizable UI, makes the Adaptive Momentum Oscillator a powerful tool for traders looking to refine their momentum-based strategies with dynamic thresholds.
Summary and Usage Tips
The Adaptive Momentum Oscillator is a versatile tool for both trend-following and contrarian traders. Its dynamic nature allows for better alignment with current market conditions, while its user-friendly inputs offer extensive customization options. Traders are encouraged to experiment with the percentile-based threshold settings to find the optimal balance between signal sensitivity and noise reduction, particularly in fast-moving or volatile markets.
This indicator is best used in combination with other trend-confirmation tools, offering a dynamic layer to your trading system.
Thus following all of the key points here are some sample backtests on the 1D Chart
Disclaimer: Backtests are based off past results, and are not indicative of the future.
INDEX:BTCUSD
INDEX:ETHUSD
BINANCE:SOLUSD

KASPA Slope OscillatorKASPA Slope Oscillator for analyzing KASPA on the 1D (daily) chart.
The indicator is plotted in a separate pane below the price chart and uses a mathematical approach to calculate and visualize the momentum or "slope" of KASPA's price movements.
Input Parameters:
Slope Window (days):
Defines the period (66 days by default) over which the slope is calculated.
Normalization Window (days):
The window size (85 days) for normalizing the slope values between 0 and 100.
Smoothing Period:
The number of days (15 days) over which the slope values are smoothed to reduce noise.
Overbought and Oversold Levels:
Threshold levels set at 80 (overbought) and 20 (oversold), respectively.
Calculation of the Slope:
Logarithmic Price Calculation:
Converts the close price of KASPA into a logarithmic scale to account for exponential growth or decay.
Rolling Slope:
Computes the rate of change in logarithmic prices over the defined slope window.
Normalization:
The slope is normalized between 0 and 100, allowing easier identification of extreme values.
Smoothing and Visualization:
Smoothing the Slope:
A Simple Moving Average (SMA) is applied to the normalized slope for the specified smoothing period.
Plotting the Oscillator:
The smoothed slope is plotted on the oscillator chart. Horizontal lines indicate overbought (80), oversold (20), and the mid-level (50).
Background Color Indications:
Background colors (red or green) indicate when the slope crosses above the overbought or below the oversold levels, respectively, signaling potential buy or sell conditions.
Detection of Local Maxima and Minima:
The code identifies local peaks (maxima) above the overbought level and troughs (minima) below the oversold level.
Vertical background lines are highlighted in red or green at these points, signaling potential reversals.
Short Summary:
The oscillator line fluctuates between 0 and 100, representing the normalized momentum of the price.
Red background areas indicate periods when the oscillator is above the overbought level (80), suggesting a potential overbought condition or a sell signal.
Green background areas indicate periods when the oscillator is below the oversold level (20), suggesting a potential oversold condition or a buy signal.
The vertical lines on the background mark local maxima and minima where price reversals may occur.
(I also want to thank @ForgoWork for optimizing visuality and cleaning up the source code)
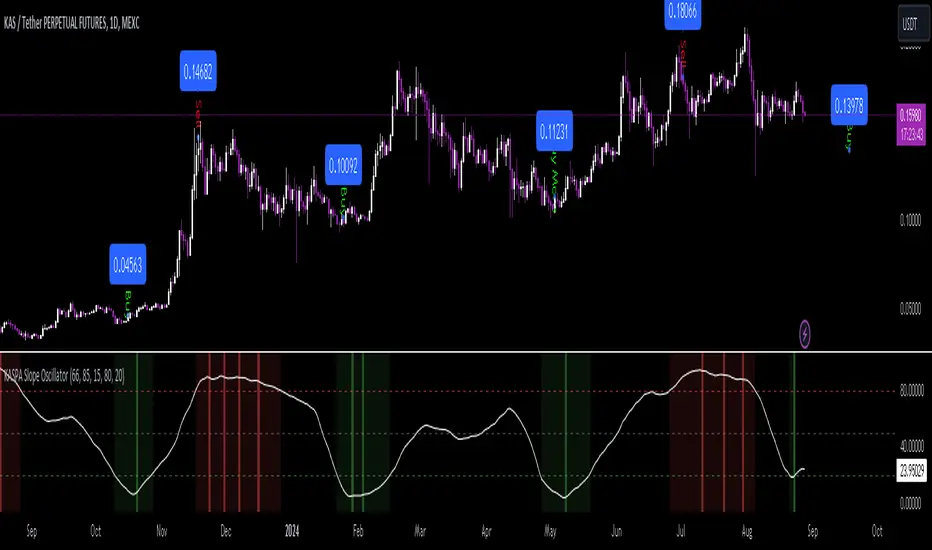
Price & Momentum Reversal Indicator [TradeDots]Price & Momentum Divergence Indicator is a variant of the Chande Momentum Oscillator (CMO), designed to identify reversal patterns in overvalued and undervalued markets. This indicator aims to mitigate the common problem of all oscillating indicators: false buy/sell signals during prolonged market trends, by incorporating a volume-weighted approach and momentum analysis.
📝 HOW IT WORKS
Price Extremeness Calculation
The indicator evaluates the extremeness of the current price by analyzing price changes over a fixed window of candlesticks.
It separates the price changes into positive and negative changes, then multiplies them by the bar volume to obtain volume-weighted values, giving higher significance to bars with larger volumes.
Extremeness Ratio
The ratio is calculated by taking the difference between the total positive changes and total negative changes, and then dividing this result by the sum of the total positive and negative changes.
The result is then smoothed to reduce market noise and rescaled to a range between -100 to 100, where 100 indicates all price changes within the window are positive.
Momentum Analysis
Momentum is calculated by measuring the rate of change of the smoothed extremeness ratio, indicating whether market extremeness is slowing and showing signs of reversion.
Reversal Signal Confirmation
For an asset to be considered a reversal, it has to be in the overvalued or undervalued zone (exceeding the overvalued & undervalued threshold). It must then show a slowed momentum change and a price reversion.
Lastly, candlestick analysis is used to confirm the reversal signal, ensuring there is no room for further breakout price movement.
🛠️ HOW TO USE
Candlestick Visualization
Candlestick bodies are painted with gradient colors representing the smoothed price extremeness (OBOS Index), ranging from -100 (solid red) to 100 (solid green). The exact value is displayed in a table at the bottom right corner.
Slowing price momentum is indicated with blue (bearish) and purple (bullish) colors, showing market pressure from the opposite side.
Reversal Confirmation
A decrease in price momentum combined with a price reversal triggers a signal label on the candlestick, indicating a potential pullback or reversal. This can serve as a reference for better entry and exit points.
⭐️ Premium Features
Higher Timeframe (HTF) Analysis
The indicator includes a feature to apply the same algorithm to a selected higher timeframe, ensuring trend alignment across multiple timeframes.
Alert Functions
Real-time notifications for overvalued and undervalued conditions, allowing traders to monitor trades and reversal signals anywhere and anytime.
❗️LIMITATIONS
Accuracy decreases in volatile and noisy markets.
Extended bullish or bearish market conditions may affect performance.
See Author's instructions below to get instant access to this indicator.
RISK DISCLAIMER
Trading entails substantial risk, and most day traders incur losses. All content, tools, scripts, articles, and education provided by TradeDots serve purely informational and educational purposes. Past performances are not definitive predictors of future results.
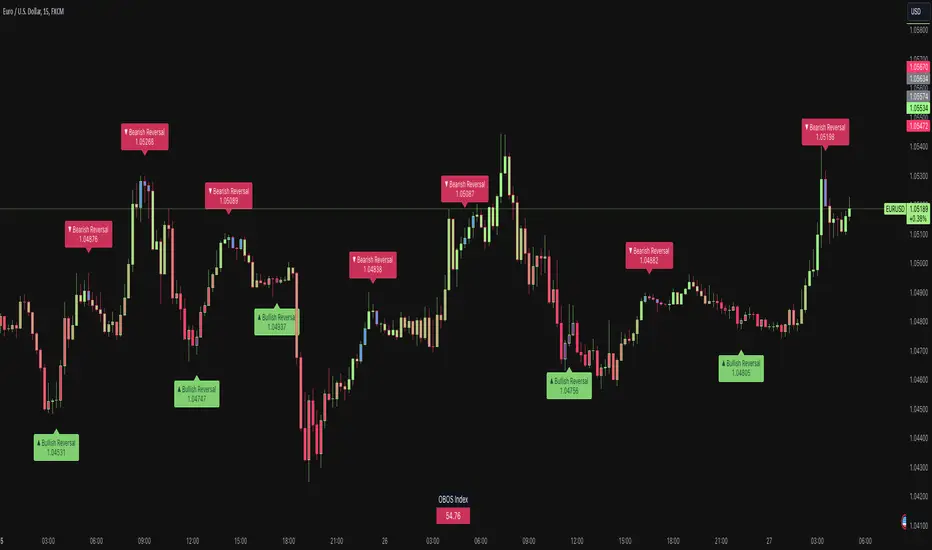
Momentum Trend [MT]The Momentum Trend indicator is an innovative technical analysis tool designed to capture and visualize momentum trends in financial markets. This advanced indicator goes beyond traditional momentum measures, offering a unique perspective on price action and trend strength.
Core Functionality:
Trend Momentum Index (TMI) Calculation:
At the heart of this indicator is the Trend Momentum Index (TMI), a proprietary algorithm that combines moving averages with price action analysis to gauge momentum. The TMI is calculated using a user-defined source, length, and moving average type.
Dynamic Trend Visualization:
The indicator uses a color-coded column plot to represent the TMI values, providing an intuitive visual representation of trend strength and direction. The colors change based on specific conditions, offering instant insights into the current market state.
Adaptive Momentum Analysis:
The TMI adapts to changing market conditions by comparing current values to historical ones, allowing for a more nuanced understanding of momentum shifts.
Key Inputs and Their Significance:
TMI Source:
Allows users to select the price data for TMI calculations. The default is the closing price, but users can choose alternative sources for different analytical perspectives.
TMI Length:
Defines the lookback period for the TMI calculation. The default of 8 provides a balance between responsiveness and stability, but users can adjust this to suit their trading style.
Moving Average Type:
Users can select from various moving average types (SMA, EMA, SMMA, WMA, VWMA) for the base calculation, allowing for customization based on trading preferences.
What Makes It Unique:
Comprehensive Momentum Analysis:
The TMI combines elements of trend following and momentum, providing a more holistic view of market dynamics than traditional momentum indicators.
Multi-Faceted Trend Identification:
The color-coding system doesn't just show bullish or bearish trends, but also identifies accelerating and decelerating momentum in both directions.
Flexible Moving Average Integration:
The ability to choose different moving average types allows traders to fine-tune the indicator's responsiveness and smoothness.
Visual Clarity:
The column-style plot with color changes offers clear, at-a-glance insights into trend strength and direction.
Momentum Comparison Logic:
The indicator incorporates logic to compare current momentum changes with recent historical changes, providing context for the current market state.
The Momentum Trend indicator represents a sophisticated approach to momentum and trend analysis. By combining moving averages, price action, and comparative momentum logic, it offers traders a powerful tool for identifying potential trend continuations, reversals, and momentum shifts.
This indicator is particularly valuable for traders looking to:
- Identify the start of new trends
- Spot potential trend reversals
- Gauge the strength of ongoing trends
- Time entries and exits based on momentum shifts

Momentum & Squeeze Oscillator [UAlgo]The Momentum & Squeeze Oscillator is a technical analysis tool designed to help traders identify shifts in market momentum and potential squeeze conditions. This oscillator combines multiple timeframes and periods to provide a detailed view of market dynamics. It enhances the decision-making process for both short-term and long-term traders by visualizing momentum with customizable colors and alerts.
🔶 Key Features
Custom Timeframe Selection: Allows users to select a custom timeframe for oscillator calculations, providing flexibility in analyzing different market periods.
Recalculation Option: Enables or disables the recalculation of the indicator, offering more control over real-time data processing.
Squeeze Background Visualization: Highlights potential squeeze conditions with a background color, helping traders quickly spot consolidation periods.
Adjustable Squeeze Sensitivity: Users can modify the sensitivity of the squeeze detection, tailoring the indicator to their specific trading style and market conditions.
Bar Coloring Condition: Option to color the price bars based on momentum conditions, enhancing the visual representation of market trends.
Threshold Bands: Option to fill threshold bands for a clearer visualization of overbought and oversold levels.
Reference Lines: Display reference lines for overbought, oversold, and mid-levels, aiding in quick assessment of momentum extremes.
Multiple Output Modes: Offers different output visualization modes, including:
ALL: Displays all calculated momentum values (fast, medium, slow).
AVG: Shows the average momentum, providing a consolidated view.
STD: Displays the standard deviation of momentum, useful for understanding volatility.
Alerts: Configurable alerts for key momentum events such as crossovers and squeeze conditions, keeping traders informed of important market changes.
🔶 Usage
The Momentum & Squeeze Oscillator can be used for various trading purposes:
Trend Identification: Use the oscillator to determine the direction and strength of market trends. By analyzing the average, fast, medium, and slow momentum lines, traders can gain insights into short-term and long-term market movements.
Squeeze Detection: The indicator highlights periods of low volatility (squeeze conditions) which often precede significant price movements. Traders can use this information to anticipate and prepare for potential breakouts.
Overbought/Oversold Conditions: The oscillator helps identify overbought and oversold conditions, indicating potential reversal points. This is particularly useful for timing entry and exit points in the market.
Momentum Shifts: By monitoring the crossover of momentum lines with key levels (e.g., the 50 level), traders can spot shifts in market momentum, allowing them to adjust their positions accordingly.
🔶 Disclaimer:
Use with Caution: This indicator is provided for educational and informational purposes only and should not be considered as financial advice. Users should exercise caution and perform their own analysis before making trading decisions based on the indicator's signals.
Not Financial Advice: The information provided by this indicator does not constitute financial advice, and the creator (UAlgo) shall not be held responsible for any trading losses incurred as a result of using this indicator.
Backtesting Recommended: Traders are encouraged to backtest the indicator thoroughly on historical data before using it in live trading to assess its performance and suitability for their trading strategies.
Risk Management: Trading involves inherent risks, and users should implement proper risk management strategies, including but not limited to stop-loss orders and position sizing, to mitigate potential losses.
No Guarantees: The accuracy and reliability of the indicator's signals cannot be guaranteed, as they are based on historical price data and past performance may not be indicative of future results.

Fusion MFI RSIHello fellas,
This superb indicator summons two monsters called Relative Strength Index (RSI) and Money Flow Index (MFI) and plays the Yu-Gi-Oh! card "Polymerization" to combine them.
Overview
The Fusion MFI RSI Indicator is an advanced analytical tool designed to provide a nuanced understanding of market dynamics by combining the Relative Strength Index (RSI) and the Money Flow Index (MFI). Enhanced with sophisticated smoothing techniques and the Inverse Fisher Transform (IFT), this indicator excels in identifying key market conditions such as overbought and oversold states, trends, and potential reversal points.
Key Features (Brief Overview)
Fusion of RSI and MFI: Integrates momentum and volume for a comprehensive market analysis.
Advanced Smoothing Techniques: Employs Hann Window, Jurik Moving Average (JMA), T3 Smoothing, and Super Smoother to refine signals.
Inverse Fisher Transform (IFT) Enhances the clarity and distinctiveness of indicator outputs.
Detailed Feature Analysis
Fusion of RSI and MFI
RSI (Relative Strength Index): Developed by J. Welles Wilder Jr., the RSI measures the speed and magnitude of directional price movements. Wilder recommended using a 14-day period and identified overbought conditions above 70 and oversold conditions below 30.
MFI (Money Flow Index): Created by Gene Quong and Avrum Soudack, the MFI combines price and volume to measure trading pressure. It is typically calculated using a 14-day period, with over 80 considered overbought and under 20 as oversold.
Application in Fusion: By combining RSI and MFI, the indicator leverages RSI's sensitivity to price changes with MFI's volume-weighted confirmation, providing a robust analysis tool. This combination is particularly effective in confirming the strength behind price movements, making the signals more reliable.
Advanced Smoothing Techniques
Hann Window: Traditionally used to reduce the abrupt data discontinuities at the edges of a sample, it is applied here to smooth the price data.
Jurik Moving Average (JMA): Known for preserving the timing and smoothness of the data, JMA reduces market noise effectively without significant lag.
T3 Smoothing: Developed to respond quickly to market changes, T3 provides a smoother response to price fluctuations.
Super Smoother: Filters out high-frequency noise while retaining important trends.
Application in Fusion: These techniques are chosen to refine the output of the combined RSI and MFI values, ensuring the indicator remains responsive yet stable, providing clearer and more actionable signals.
Inverse Fisher Transform (IFT):
Developed by John Ehlers, the IFT transforms oscillator outputs to enhance the clarity of extreme values. This is particularly useful in this fusion indicator to make critical turning points more distinct and actionable.
Mathematical Calculations for the Fusion MFI RSI Indicator
RSI (Relative Strength Index)
The RSI is calculated using the following steps:
Average Gain and Average Loss: First, determine the average gain and average loss over the specified period (typically 14 days). This is done by summing all the gains and losses over the period and then dividing each by the period.
Average Gain = (Sum of Gains over the past 14 periods) / 14
Average Loss = (Sum of Losses over the past 14 periods) / 14
Relative Strength (RS): This is the ratio of average gain to average loss.
RS = Average Gain / Average Loss
RSI: Finally, the RSI is calculated using the RS value:
RSI = 100 - (100 / (1 + RS))
MFI (Money Flow Index)
The MFI is calculated using several steps that incorporate both price and volume:
Typical Price: Calculate the typical price for each period.
Typical Price = (High + Low + Close) / 3
Raw Money Flow: Multiply the typical price by the volume for the period.
Raw Money Flow = Typical Price * Volume
Positive and Negative Money Flow: Compare the typical price of the current period to the previous period to determine if the money flow is positive or negative.
If today's Typical Price > Yesterday's Typical Price, then Positive Money Flow = Raw Money Flow; Negative Money Flow = 0
If today's Typical Price < Yesterday's Typical Price, then Negative Money Flow = Raw Money Flow; Positive Money Flow = 0
Money Flow Ratio: Calculate the ratio of the sum of Positive Money Flows to the sum of Negative Money Flows over the past 14 periods.
Money Flow Ratio = (Sum of Positive Money Flows over 14 periods) / (Sum of Negative Money Flows over 14 periods)
MFI: Finally, calculate the MFI using the Money Flow Ratio.
MFI = 100 - (100 / (1 + Money Flow Ratio))
Fusion of RSI and MFI
The final Fusion MFI RSI value could be calculated by averaging the IFT-transformed values of RSI and MFI, providing a single oscillator value that reflects both momentum and volume-weighted price action:
Fusion MFI RSI = (MFI weight * MFI) + (RSI weight * RSI)
Suggested Settings and Trading Rules
Original Usage
RSI: Wilder suggested buying when the RSI moves above 30 from below (enter long) and selling when the RSI moves below 70 from above (enter short). He recommended exiting long positions when the RSI reaches 70 or higher and exiting short positions when the RSI falls below 30.
MFI: Quong and Soudack recommended buying when the MFI is below 20 and starts rising (enter long), and selling when it is above 80 and starts declining (enter short). They suggested exiting long positions when the MFI reaches 80 or higher and exiting short positions when the MFI falls below 20.
Fusion Application
Settings: Use a 14-day period for this indicator's calculations to maintain consistency with the original settings suggested by the inventors.
Trading Rules:
Enter Long Signal: Consider entering a long position when both RSI and MFI are below their respective oversold levels and begin to rise. This indicates strong buying pressure supported by both price momentum and volume.
Exit Long Signal: Exit the long position when either RSI or MFI reaches its respective overbought threshold, suggesting a potential reversal or decrease in buying pressure.
Enter Short Signal: Consider entering a short position when both indicators are above their respective overbought levels and begin to decline, suggesting that selling pressure is mounting.
Exit Short Signal: Exit the short position when either RSI or MFI falls below its respective oversold threshold, indicating diminishing selling pressure and a potential upward reversal.
How to Use the Indicator
Select Source and Timeframe: Choose the data source and the timeframe for analysis.
Configure Fusion Settings: Adjust the weights for RSI and MFI.
Choose Smoothing Technique: Select and configure the desired smoothing method to suit the market conditions and personal preference.
Enable Fisherization: Optionally apply the Inverse Fisher Transform to enhance signal clarity.
Customize Visualization: Set up gradient coloring, background plots, and bands according to your preferences.
Interpret the Indicator: Use the Fusion value and visual cues to identify market conditions and potential trading opportunities.
Conclusion
The Fusion MFI RSI Indicator integrates classical and modern technical analysis concepts to provide a comprehensive tool for market analysis. By combining RSI and MFI with advanced smoothing techniques and the Inverse Fisher Transform, this indicator offers enhanced insights, aiding traders in making more informed and timely trading decisions. Customize the settings to align with your trading strategy and leverage this powerful tool to navigate financial markets effectively.
Best regards,
simwai
---
Credits to:
@loxx – T3
@everget – JMA
@cheatcountry – Hann Window

Simple Volatility MomentumOverview:
The Simple Volatility Momentum indicator calculates the mean and standard deviation of the changes of price (returns) using various types of moving averages (Incremental, Rolling, and Exponential). With quantifying the dispersion of price data around the mean, statistical insights are provided on the volatility and the movements of price and returns. The indicator also ranks the mean absolute value of the changes of price over a specified time period which helps you assess the strength of the "trend" and "momentum" regardless of the direction of returns.
Simple Volatility Momentum
This indicator can be used for mean reversion strategies and "momentum" or trend based strategies.
The indicator calculates the average return as the momentum metric and then gets the moving average of the average return and standard deviations from average return average. On the options you can determine if you want to use 1 or 2 standard deviation bands or have both of them enabled.
Settings:
Source: By default it's at close.
M Length: This is the length of the "momentum".
Rank Length: This is the length of the rank calculation of absolute value of the average return
MA Type: This is the different type of calculations for the mean and standard deviation. By default its at incremental.
Smoothing factor: (Only used if you choose the exponential MA type.)
The absolute value of the average return helps you see the strength of the "momentum" and trend. If there is a low ranking of the absolute value of the average return then you can eventually expect it to increase which means that the average return is trending, leading to trending price moves. If the Mean ABS rank value is at or near the maximum value 100 and the average return is at -2 standard deviation from the mean, you can see it as the negative momentum or trend being "finished". Similarly, if the Mean ABS value is near or at the maximum value 100 and the average return is at +2 standard deviation from the mean, you can view the uptrend, as "finished" and the Mean ABS rank can't really go higher than 100.
Moving Average Calculations type:
Incremental: Incremental moving averages use an incremental approach to update the moving average by adding the newest data point and subtracting the oldest one.
Exponential: The exponential moving average gives more weight to recent data points while still considering older ones. This is achieved by applying a smooth factor to the previous EMA value and the current data point. EMA's react more quickly to recent changes in the data compared to simple moving averages, making them useful for short term trends and momentum in financial markets.
Rolling: The moving average is calculated by taking the average of a fixed number of data points within a defined window. As new data becomes available, the window moves forward and the average is recalculated. Rolling Moving Averages are useful for smoothing out short-fluctuations and identifying trends over time.
Important thing to note about indicators involving bands and "momentum" or "trend" or prices:
For the explanation we will assume that stock returns follow a normal distribution and price follows a log normal distribution. Please note that in the live market this assumption isn't always true. Many people incorrectly use standard deviations on prices and trade them as mean reversion strategies or overbought or oversold levels which is not what standard deviations are meant for. Assuming you have applied the log transformation on the standard deviation bands (if your input is raw price then you should use a log transformation to remove the skewness of price), and you have a range of 2 standard deviations from the mean, under the empirical rule with enough occurrences 95% of the values will be within the 2 standard deviation range. This doesn't mean that if price falls to the bottom of the 2 standard deviation bound, there is a 95% chance it will revert back to mean, this is incorrect and not how standard deviations or mean reversion works.
"MOMENTUM"
In finance "momentum" refers to the rate of change of a time series data point. It shows the persistence or tendency for a data series to continue moving in its current direction. In finance, "momentum" based strategies capitalize on the observed tendency of assets that have performed well (or poorly) in the recent past to continue performing well (or poorly) in the near future. This persistence is often observed in various financial instruments including stocks, currencies and commodities.
"Momentum" is commonly calculated with the average return, and relies on the assumption that assets with positive "momentum" or a positive average return will likely continue to perform well in the short to medium term, while assets with a negative average return are expected to continue underperforming. This average return or expected value is derived from historical observations and statistical analysis of previous price movements. However, real markets are subject to levels of efficiencies, market fluctuations, randomness, and may not always produce consistent returns over time involving momentum based strategies.
Mean Reversion:
In finance, the average return is an important parameter in mean reversion strategies. Using statistical methodologies, mean reversion strategies aim to exploit the deviations from the historical average return by identifying instances where current prices and their changes diverge from their expected levels based on past performance. This approach involves statistical analysis and predictive modelling techniques to check where and when the average rate of change is likely to revert towards the mean. It's important to know that mean reversion is a temporary state and will not always be present in a specific timeseries.
Using the average return over price offers several advantages in finance and trading since it is less sensitive to extreme price movements or outliers compared to raw price data. Price itself contains a distribution that is usually positively-skewed and has no upper bound. Mean reversion typically occurs in distributions where extreme values are followed by a tendency for the variable to return towards its mean over time, however the probability distribution of price has no tendency for values to revert towards any specific level. Instead, values may continue to increase without a bound. Returns themself contain more stationary behavior than price levels. Mean reversion strategies rely on the assumption that deviations from the mean will eventually revert back to the mean. Returns, being more likely to exhibit stationary, are better suited for mean reversion based strategies.
The distribution of returns are often more symmetrically distributed around their mean compared to price distributions. This symmetry makes it easier to identify deviations from the mean and assess the likelihood of mean reversion occurrence. Returns are also less sensitive to trends and long-term price movements compared to price levels. Mean reversion strategies aim to exploit deviations from mean, which can be obscured when analyzing raw price data since raw price is almost always trending. Returns can filter out the trend component of price movements, making it easier to identify opportunities.
Stationary Process: Implication that properties like mean and variance remain relatively constant over time.

CSC_Macchiato Price Trend Oscillator by CoffeeShopCryptoDescription:
Introducing "The Macchiato" – your go-to indicator in the realm of trading, meticulously crafted by CoffeeShopCrypto. Much like the complex flavors of a well-made Macchiato, this tool offers a robust suite of functionalities designed to enhance your trading experience across Forex, stocks, and cryptocurrencies.
The Macchiato stands out for its distinct ability to confirm market trends, identify building momentum, and navigate through periods of market stalls. Drawing cues from the RSI (Relative Strength Index), its color scheme dynamically reflects the shifts in market forces, providing traders with real-time insights into price action dynamics.
Gone are the days of navigating through market uncertainties blindly. With The Macchiato at your disposal, you gain a more clear understanding of market movements, helping you to make informed decisions with confidence. Whether you're a seasoned trader or just starting out, this indicator adds more confluence to your trading strategy, ensuring that you stay ahead of the curve in today's fast-paced trading environment.
So, say goodbye to guesswork and hello to precision trading with The Macchiato – where real-time data analysis meets actionable insights, all in the quest for trading success.
----------------------------------------------------
The Histogram:
The Macchiato Histogram gives you a representation of current change in closing values against the closing values within a "Range" of the lookback period. It calculates your price ranging extremes of the highest high vs lowest low according to your lookback setting. Then it shows you whether the momentum of these closing prices calculated against the highs or the lows is either rising or falling. It takes into account the difference in the highs, lows, open and closing prices as a whole. This helps to determine the actual trend of your market structure.
Histogram Rising / Falling:
The Histogram of the Macchiato doesn't care about being above or below zero. Since we are simply calculating momentum rising or falling, then we only care that the histogram is rising or falling. Especially when it's doing this in line with our Macchiato Average.
Macchiato Average:
Included is a smoothing line called "the Macchiato Average"
Using the average is just like using a moving average against price action, however here we are using one against momentum to determine whether price is moving against, with, better, or worse than the current average of momentum.
The RSI:
The base purpose of the RSI in this tool is mainly to color the columns of the Histogram.
I gave you the benefit of exposing the RSI so you can see where it lies in the oscillator for any additional strategies you may use.
How the RSI Colors the Histogram:
The Histogram has 4 momentum colors and 1 non-momentum color.
They are described below but here we will understand why they exist the way they do against the RSI positioning.
The 4 momentum colors:
You can have the RSI in 4 different positions against its moving average.
Trend Trading Colors and setups:
Strong Long - RSI above zero and above its average is a strong long trend.
Strong Short - RSI below zero and below its average is a strong short trend.
These can also be seen as breakout indications.
Counter Trend Trading and Setups:
Weak Long - RSI above zero and below its average is a weak long trend.
Weak Short - RSI below zero and above its average is a weak short trend.
(Only trade weak momentum to known internal support and resistance areas.)
You'll notice that when the RSI is set up against its RSI Moving average under these conditions, the Histogram is colored accordingly to tell you whether you have strong or weak momentum.
For these colors to appear accordingly, the RSI and the momentum of the histogram must be moving in the same direction as each other.
The 5th color of the Histogram:
(GRAY)
This is where there is a divergence / disagreement between your RSI setup and the momentum being observed. If momentum is moving one way and the force of the RSI is not matching the overall momentum, you have a divergence. This commonly means that higher timeframe momentum is in disagreement to lower or current timeframe closing momentum changes.
Conditions of a Bullish Trending Market:
The color scheme has specific implications when all columns are above zero.
As noted before, the Macchiato doesn't care that it is above or below zero. It simply needs to be rising or falling. The color scheme is depicted by what the RSI is doing in relation to ZERO and where it lies against its average.
This image helps to differentiate what is happening with momentum when in a strong bullish market.
The color scheme is always the same. You always have 4 conditions of momentum.
According to the default settings:
Strong Long = Dark Green
Weak Long = Light Green
Strong Short = Dark Red
Weak short = Light Red
The final color is GRAY which is standard for a NON directional market.
You can alter the colors as you choose for your chart background and color preference.
Macchiato Bias Line Conditions
The "Bias Line" helps you understand whether your current momentum is traveling into opposing forces or if your momentum is going WITH the bias.
Going against the bias would be like momentum and price action converging against each other.
Going in the same direction would offer much larger movements on price.
Using the Bias to trade
Trading Internal Support and Resistance
Noting previous price action, pivots, and price swings is important in its use.
When you see momentum coming to a halt or changing, note the previous price action that you are approaching. You should see the histogram change its color, telling you where momentum is ending in its current direction.
EXAMPLE BULLISH MARKET FLIP
There is the exception however that when the market flips, from bearish to bullish, you can see the following:
BIAS LINE switches to a Bullish Bias
Histogram is showing Strong Long Color
Histogram stays ahead of the BIAS line
Price should break previous swing highs to create new highs.
Strategy you can use in observance. (short pause, to pullback, to continued short)
If the momentum is rising while RSI is falling you'll have gray columns until the RSI is in the correct positions against its average.
For your trend to continue downward you are looking for dark red or "Strong Short" columns.
When there is a disagreement, your columns will be gray and then switch to weak long. (Light Green)
This is because your RSI is above its average while the RSI is bearish.
This light green area can be observed as the pullback area.
If you only want to trade short, you would wait for the pullback to be complete.
This occurs when the weak long changes back to gray and then strong short, or skipping gray into strong short.
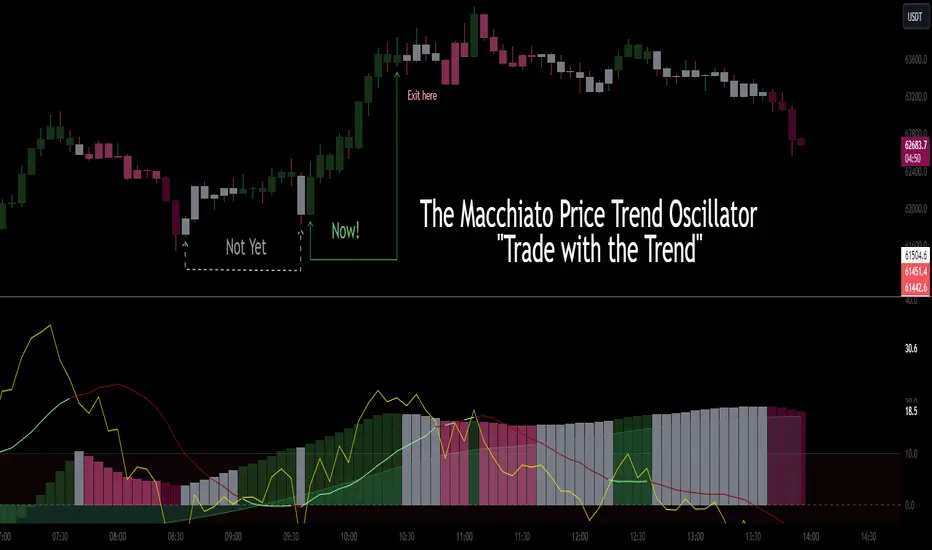
Dynamic Price Oscillator (Zeiierman)█ Overview
The Dynamic Price Oscillator (DPO) by Zeiierman is designed to gauge the momentum and volatility of asset prices in trading markets. By integrating elements of traditional oscillators with volatility adjustments and Bollinger Bands, the DPO offers a unique approach to understanding market dynamics. This indicator is particularly useful for identifying overbought and oversold conditions, capturing price trends, and detecting potential reversal points.
█ How It Works
The DPO operates by calculating the difference between the current closing price and a moving average of the closing price, adjusted for volatility using the True Range method. This difference is then smoothed over a user-defined period to create the oscillator. Additionally, Bollinger Bands are applied to the oscillator itself, providing visual cues for volatility and potential breakout signals.
█ How to Use
⚪ Trend Confirmation
The DPO can serve as a confirmation tool for existing trends. Traders might look for the oscillator to maintain above or below its mean line to confirm bullish or bearish trends, respectively. A consistent direction in the oscillator's movement alongside price trend can provide additional confidence in the strength and sustainability of the trend.
⚪ Overbought/Oversold Conditions
With the application of Bollinger Bands directly on the oscillator, the DPO can highlight overbought or oversold conditions in a unique manner. When the oscillator moves outside the Bollinger Bands, it signifies an extreme condition.
⚪ Volatility Breakouts
The width of the Bollinger Bands on the oscillator reflects market volatility. Sudden expansions in the bands can indicate a breakout from a consolidation phase, which traders can use to enter trades in the direction of the breakout. Conversely, a contraction suggests a quieter market, which might be a signal for traders to wait or to look for range-bound strategies.
⚪ Momentum Trading
Momentum traders can use the DPO to spot moments when the market momentum is picking up. A sharp move of the oscillator towards either direction, especially when crossing the Bollinger Bands, can indicate the start of a strong price movement.
⚪ Mean Reversion
The DPO is also useful for mean reversion strategies, especially considering its volatility adjustment feature. When the oscillator touches or breaches the Bollinger Bands, it indicates a deviation from the normal price range. Traders might look for opportunities to enter trades anticipating a reversion to the mean.
⚪ Divergence Trading
Divergences between the oscillator and price action can be a powerful signal for reversals. For instance, if the price makes a new high but the oscillator fails to make a corresponding high, it may indicate weakening momentum and a potential reversal. Traders can use these divergence signals to initiate counter-trend moves.
█ Settings
Length: Determines the lookback period for the oscillator and Bollinger Bands calculation. Increasing this value smooths the oscillator and widens the Bollinger Bands, leading to fewer, more significant signals. Decreasing this value makes the oscillator more sensitive to recent price changes, offering more frequent signals but with increased noise.
Smoothing Factor: Adjusts the degree of smoothing applied to the oscillator's calculation. A higher smoothing factor reduces noise, offering clearer trend identification at the cost of signal timeliness. Conversely, a lower smoothing factor increases the oscillator's responsiveness to price movements, which may be useful for short-term trading but at the risk of false signals.
-----------------
Disclaimer
The information contained in my Scripts/Indicators/Ideas/Algos/Systems does not constitute financial advice or a solicitation to buy or sell any securities of any type. I will not accept liability for any loss or damage, including without limitation any loss of profit, which may arise directly or indirectly from the use of or reliance on such information.
All investments involve risk, and the past performance of a security, industry, sector, market, financial product, trading strategy, backtest, or individual's trading does not guarantee future results or returns. Investors are fully responsible for any investment decisions they make. Such decisions should be based solely on an evaluation of their financial circumstances, investment objectives, risk tolerance, and liquidity needs.
My Scripts/Indicators/Ideas/Algos/Systems are only for educational purposes!
