Estrategia de Monitor - RSI/EMAThis indicator, competes the signals of two of the most important and reliable indicators for monitoring price trends, the Squeeze Monitor and the RSI.
For a better visualization of the relationship of the indicators with the price, the Squeeze Monitor is presented in colored bars that represent the trend of the indicator. The RSI is combined with the EMA of the RSI that supports its directionality.
As additional support for decision making, the ADX is also plotted, as an element to project the force of the next movement.
The indicator settings are presented in the configuration of the indicator. The following parameters can be adjusted there:
** Monitor Parameters **
Monitor Length Squeeze -> "Long. Monitor"
** ADX parameters **
ADX Longitug -> "Long. ADX"
ADX Smoother -> "Suavizador ADX"
ADX Variation Factor -> "Factor Var. ADX"
This parameter defines the minimum variation for the
ADX address highlighting
** RSI parameters **
RSI Length -> "Long. RSI"
RSI Smoothing -> "Suavizador RSI"
RSI EMA Length -> "Long. EMA del RSI"
Finally, the Script consolidates the information, based on the trends of the indicators, and changes the color of the candle body. The color code considers Green for the uptrend, Red for the Downtrend and Yellow in transition processes (not operable).
Indicador de Momentum (MOM)

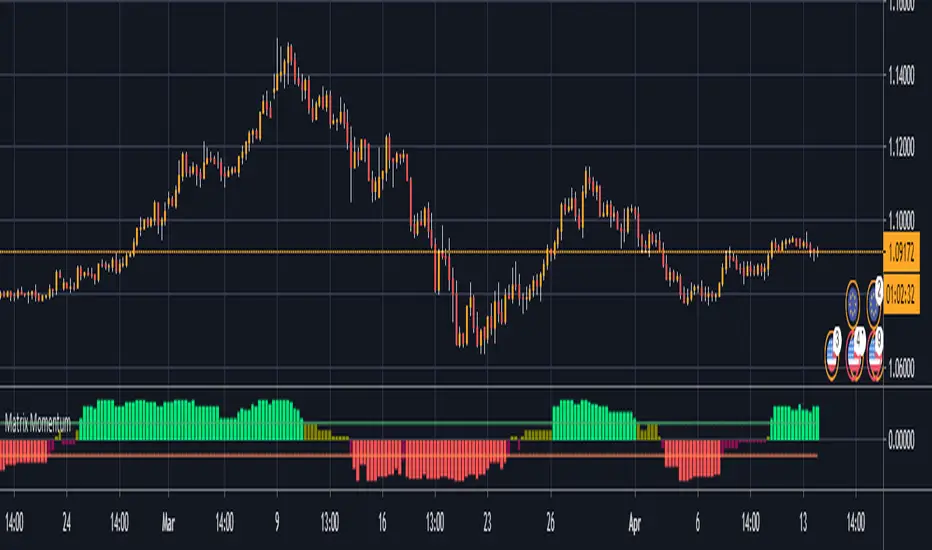
matrix momentum packageThis indicator gives a score to the momentum of a market in a percentage term based on a combination of measurements, this can be used on any time frame, on any instrument to identify if the current trend has enough momentum to see it carry on further this will help eliminate fomo and also help you to identify reversals in the chart at the right time so you can eliminate exposure to a market about to reverse, there is 4 levels to this indicator you have a strong bullish trend denote by green bars the weaker bullish trend denoted by the olive coloured bars, a weak bearish trend which is given in maroon bars and a strong bearish trend which gives red bars you will also note the 2 horizontal boundary lines these are not overbought and oversold bounds like in most indicators but actually indicate whether there is sufficient momentum in the market as the idea is that in strong momentum you want it to be above or below this line to give you confidence there is momentum available to ride
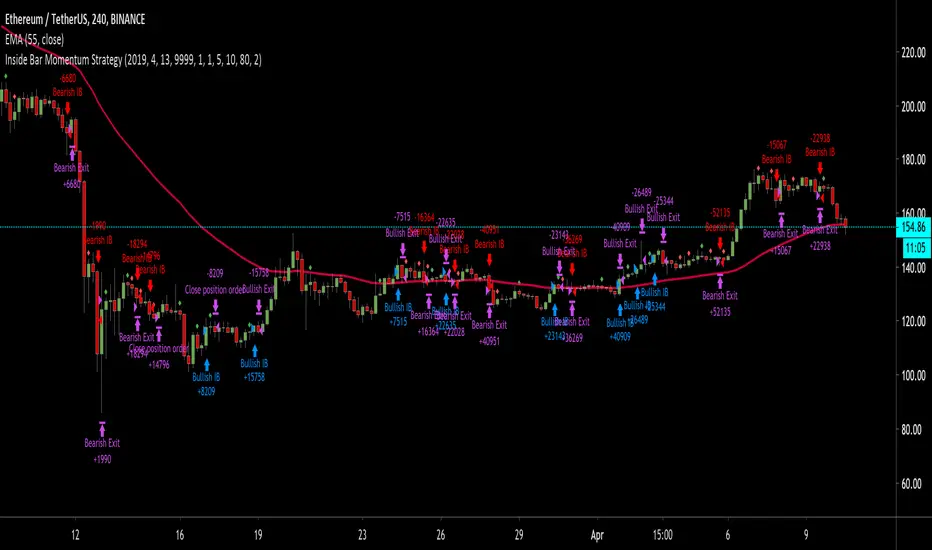
Inside Bar Momentum StrategyDescription for the strategy:
It's an inside bar momentum trade, looking for candlestick formations breakout and trading momentum with a short stop and target to 80% of the initial candle.
The entry is on a break of the original candle, stop loss is at 20% of the candle range (from the entry).
In case there's a new inside bar formation, all existing orders and trades are cancelled and new orders are placed for the new levels.
Wolfs ADX + DII have created an alternative visualisation of the ADX + DI indicator created by MasaNakamura, credits to them for providing the source code! :-)
The histogram represents the distance between the DI+ and the DI-. The crossing of the histogram is equal to the crossing of the DI lines.
The ADX line is coloured based on the threshold.
This creates a clean representation of the ADX + DI.

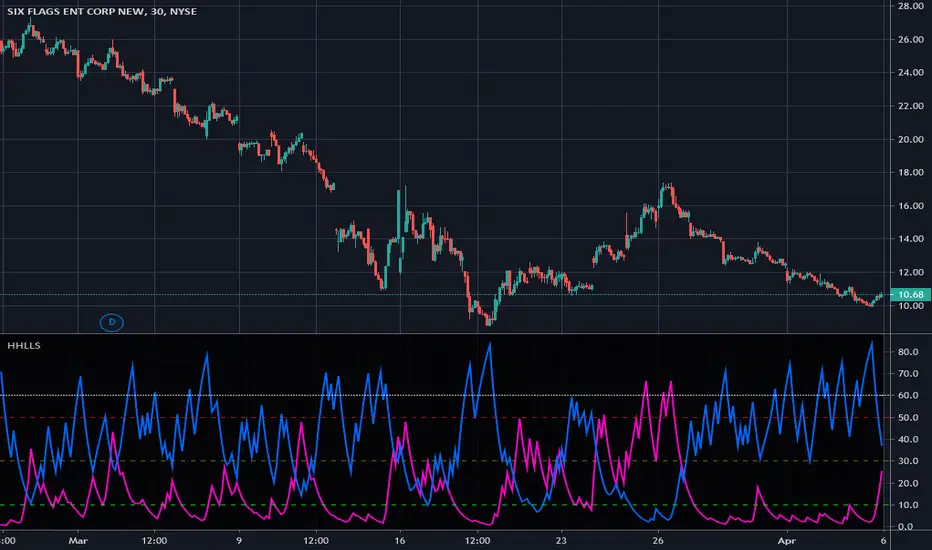
Higher Highs & Lower Lows Stochastics - Vitali ApirineThis is my modified "Higher Highs & Lower Lows Stochastics" employing PSv4.0, originally formulated by Vitali Apirine for TASC - February 2016 Traders Tips. Reading through a TASC magazine of mine, behold, I found a little known indicator that I can't find anywhere on all of Tradingview. That was a tragedy I felt I had to resolve... This indicator is best described as a dual momentum indicator, being helpful with anticipating reversals, spotting emerging trends, and defining correction periods. I felt it worthy of justice to unveil this for all TV members to utilize and also learn from. It's uniqueness is beyond past due for the honor it deserves on Tradingview.
As always, I have included advanced Pine programming techniques that conform to proper "Pine Etiquette". For those of you who are newcomers to Pine Script, this code release may also help you comprehend the "Power of Pine" by employing advanced programming techniques while exhibiting code utilization in a most effective manner. This script's uniqueness displays that we can now override built-in Pine functions. Firstly, you may have noticed that I replaced ema(), sma(), highest(), and lowest(). If you weren't aware of this Pine capability, well, here is a prime example... Now you know! Just heed caution when doing so to ensure your replacement algorithms are 100% sound. Lastly, I also added an additional "Median" line where the companion stochastics seemingly appear to gravitate within a central zone.
NOTICE: You may have observed, there is highest(), lowest(), ema(), and sma() custom functions overwriting Pine built-ins, some of which are audaciously used in ternary. "IF" you are planning to use Pine Script v4.0 functions in ternary, be forewarned, they WILL NOT operate as expected in most scenarios. The reason why I legitimately used them here in ternary is because they are ONLY manually controlled by an input(). If these were dynamically controlled with bar-to-bar dynamic conditional logic, you would most certainly run into serious unexpected programming issues, potentially resulting in hours of frustrations and guaranteed loss of hair. That's my lesson for this release, so never ever forget this when utilizing the full potential of the "Power of Pine". For more information concerning these potential dilemmas, please consult "Execution of Pine functions and historical context inside function blocks" in the "Pine Script v4 User Manual".
Features List Includes:
Dark Background - Easily disabled in indicator Settings->Style for "Light" charts or with Pine commenting
AND much, much more... You have the source!
The comments section below is solely just for commenting and other remarks, ideas, compliments, etc... regarding only this indicator, not others. When available time provides itself, I will consider your inquiries, thoughts, and concepts presented below in the comments section, should you have any questions or comments regarding this indicator. When my indicators achieve more prevalent use by TV members, I may implement more ideas when they present themselves as worthy additions. As always, "Like" it if you simply just like it with a proper thumbs up, and also return to my scripts list occasionally for additional postings. Have a profitable future everyone!
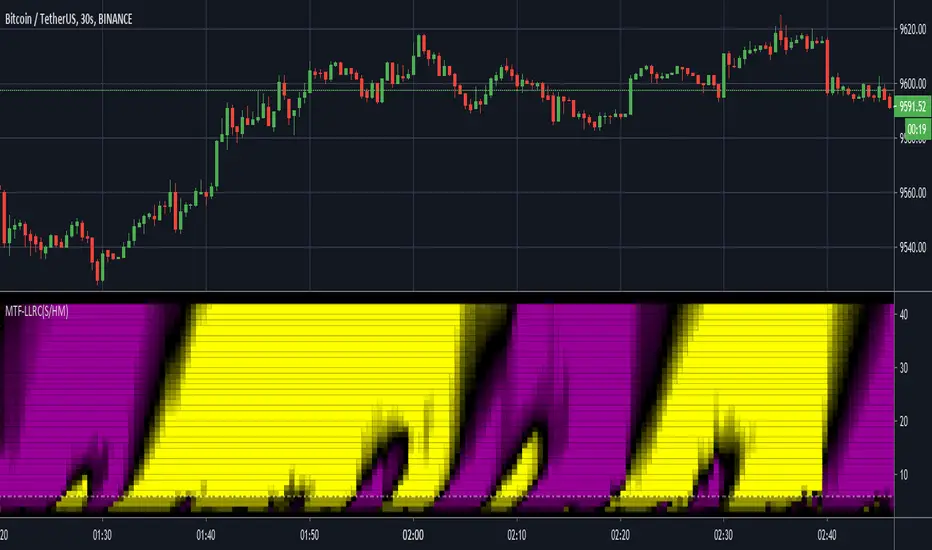
MTF Lag-Less RasterChart (Spectrogram/HeatMap)I present yet another state-of-the-art "MTF Lag-Less RasterChart" employing PSv4.0. Simply describing how this indicator works, the bottom of the indicator pane is most reactive and is highly effective at identifying reversal points quickly once they occur, while the upper portion of the indicator commonly shows enduring trends. This may be my finest multi-timeframe heatmap indicator that I have created so far, complete with multiple stunning gradient color schemes. I'm unsure if I will be able to pack any more tech into these RasterCharts. This may exclude additional algorithms or polychromatics I may discover later on that are worthy of other RasterChart releases. One last thing, this is a companion indicator to my "Lag-Less Rainbow Ribbon" indicator, because the heavily modified base algorithms are nearly identical.
I once again would like to personally thank Dr . John Ehlers for inspiring me to ponder into the realm of heatmap technology and all it has to offer. Your mathemagical splendor is most appreciated! You're a divine inspiration to the algorithmic trading community and forever shall be.
The MTF capabilities include seconds, minutes, and days. If the time frame settings are shorter in time than the current sampling interval, a warning notification will be appropriately displayed. I included a horizontal rule to approximately gauge at what level you may wish to have before entering/exiting a trade upon identifying a trend change. This gizmo functions on all assets on time frames ranging from one second bars up to the "All" chart having monthly bars.
Lastly, I have included so many color scheming techniques that I couldn't demonstrate all of them above. This indicator has what I would term as enhanced "predator" vision. For those of you who have witnessed these movies, you may understand what I have built. This indicator additionally includes a color morphing control to perfectly adjust the gradients to your visual liking, on any time frame whether it be seconds or daily chart preferences. The use of this indicator is just like any of my other RasterCharts or heatmap indicators found on the internet, except it has the greatest versatility I have accomplished as of yet.
Features List Includes:
"Source" selection
MTF controls for seconds, minutes, and days
Adjustable horizontal rule to differentiate between more reactive aspects of turning point fluctuations in the lower portion of the chart (visible above)
Window aperture control
Adjustable heatmap brightness control
Visual color scheme techniques (a few of many are displayed above)
Color gradient morphing
Color inversion control
This is not a freely available indicator, FYI. To witness my Pine poetry in action, properly negotiated requests for unlimited access, per indicator, may ONLY be obtained by direct contact with me using TV's "Private Chats" or by "Message" hidden in my member name above. The comments section below is solely just for commenting and other remarks, ideas, compliments, etc... regarding only this indicator, not others. When available time provides itself, I will consider your inquiries, thoughts, and concepts presented below in the comments section, should you have any questions or comments regarding this indicator. When my indicators achieve more prevalent use by TV members, I may implement more ideas when they present themselves as worthy additions. As always, "Like" it if you simply just like it with a proper thumbs up, and also return to my scripts list occasionally for additional postings. Have a profitable future everyone!
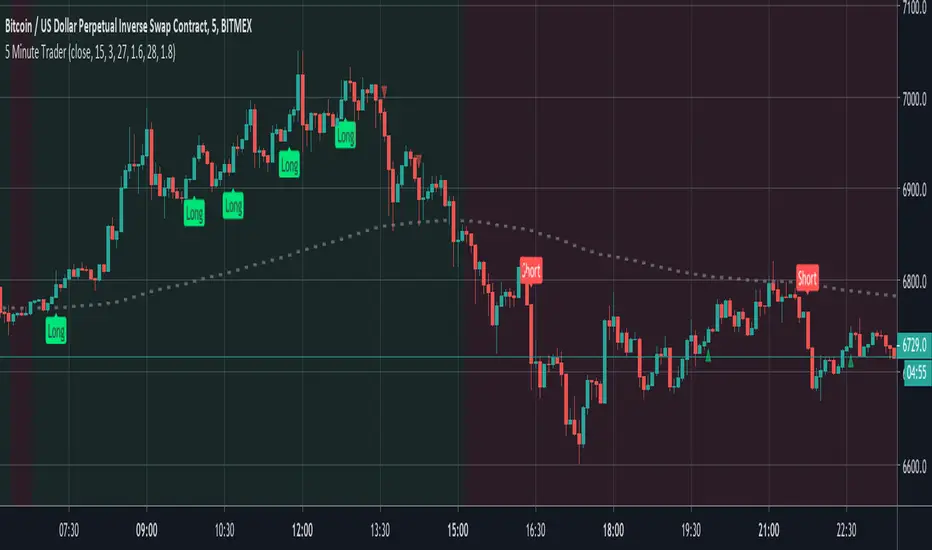
5 Minute TraderBy request, this is an amalgamation of my most popular indicator features but tailored for lower timeframes.
Signals are generated by simple EMA crosses (with adjustable values) in the direction of the current trend and then validated against a scoring system that's comprised of 20 other indicators. When the majority of them agree then the trade can be taken. The tolerance score that permits a trade can be adjusted within the indicator preference panel and the values can be printed above/below the candle to help you tune your entry points.
To further reassure you, the smoothed candle direction from the 4 hour chart is printed in the background to validate the trend direction and a floating trade helper panel translates the scores in to practical terms (buy, sell etc)
Alerts are built in.
Note: This is a premium script. Please DM me for access.
LOSS2PROFIT_TDITraders Dynamic Index (TDI) - For Naked/Blind Trader..
Combination Of MACD , Bollinger Band And RSI ..(All in One)
Indicate Market condition related to Trend Direction , Momentum and Market Volatility..
PL (Price Line)
TSL (Trade Signal Line)
MBL (Market Base Line)
UVB (Upper Volatility Band)
LVB (Lower Volatility Band)

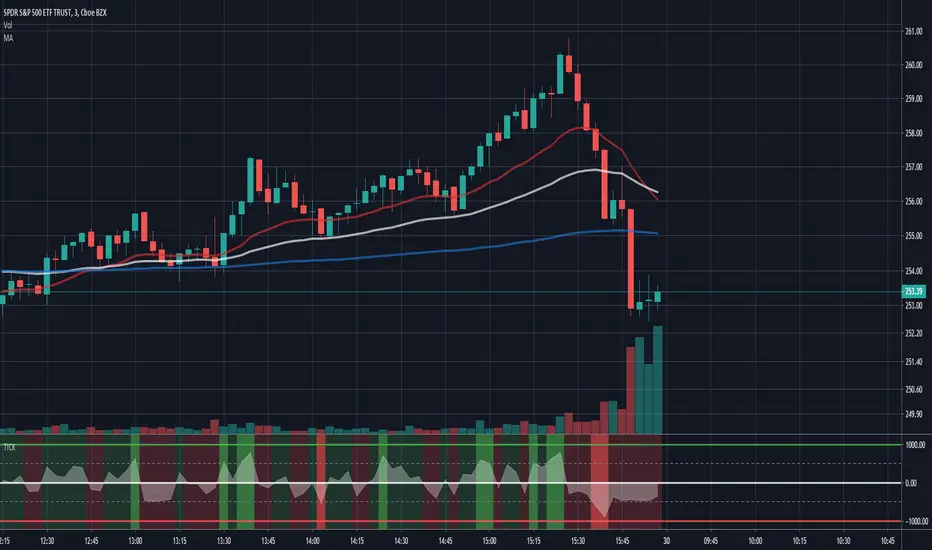
TICK IndicatorThis indicator is meant for primarily day trading. This indicator displays TICK in an easy to follow format and becomes more visible when there is a strong move in either direction
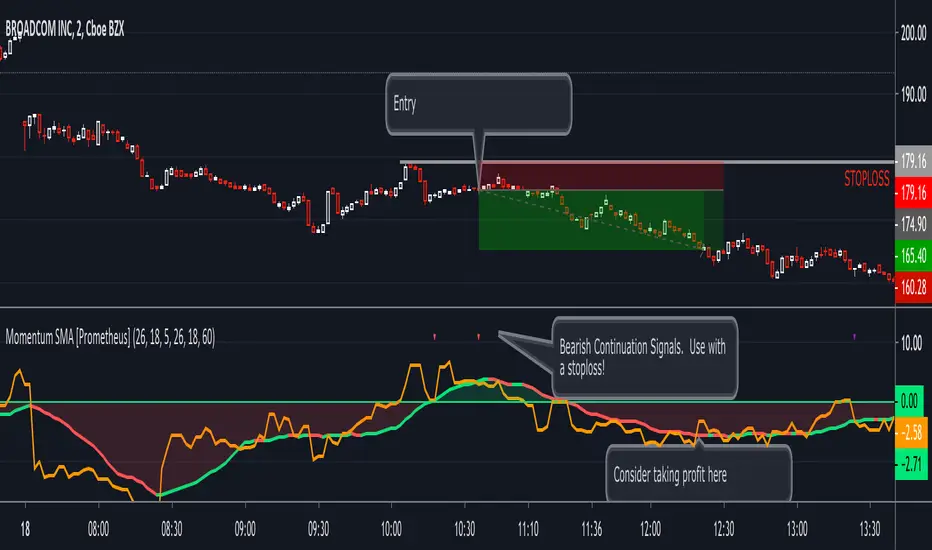
Momentum SMA [Prometheus]This is a price momentum indicator that calculates the change in price momentum over time with a simple moving average to use as a potential profit taking mechanism.
The lookback period is for calculating the momentum plot on the chart. It measures the closing price between the current candle and the candle X periods ago. (orange line)
The indicator also has a simple moving average of the momentum plotted on the chart. (red/green line with background fill)
This script improves upon its predecessor with an additional higher timeframe momentum indicator and the ability to make both plots represent a fixed timeframe so that you can switch between chart timeframes and continue to see the same momentum profile.
Future versions will include alertconditions.
Prometheus' Momentum SMAThis is a price momentum indicator that calculates the change in price momentum over time with a simple moving average to use as a potential profit taking mechanism.
The lookback period is for calculating the momentum plot on the chart. It measures the closing price between the current candle and the candle X periods ago. (orange line)
The indicator also has a simple moving average of the momentum plotted on the chart. (gray line with background fill)
Future versions will include multitimeframe signals and alertconditions.

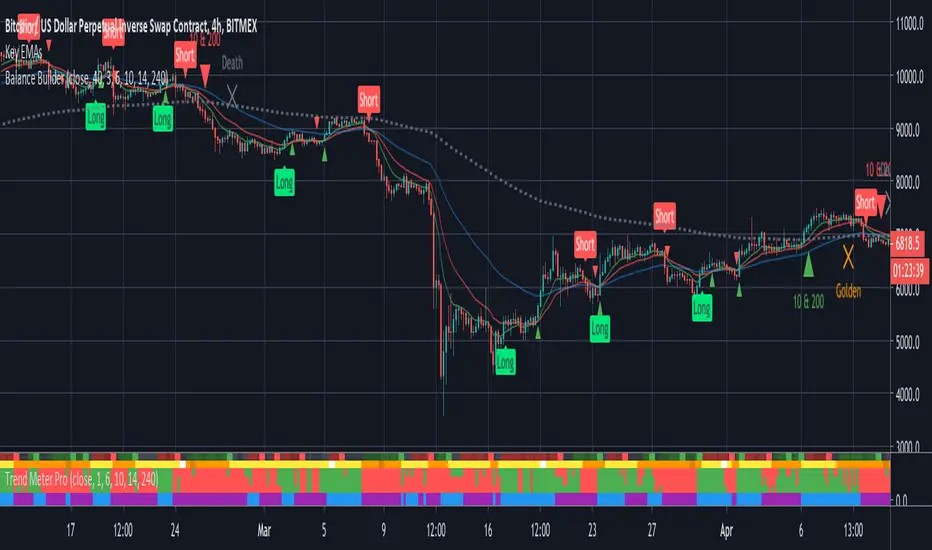
Balance BuilderBalance Builder is the culmination of everything I've learned over the last few years and will be my exclusive FOREX and crypto trading indicator going forward. I will be developing and updating it on a regular basis.
The unique signals it generates do not repaint, nor do they lag. What you are seeing is real-time and will not change once the current candle closes.
This technology analyses trend strength, momentum and the outcome of previous candles to determine the best time to accurately go long or short.
Use the labels to influence your own manual trading decisions or enable the built in alerts to hook in to your trading bot of choice and automatically trade around the clock.
The system can be applied to any instrument but the defaults are tuned for trading Bitcoin on the 4 hour chart. Higher time frames such as this are recommended to increase the win-rate but the parameters can easily be tweaked to cater for shorter term trading.
Important: I personally use Heikin Ashi candles with this script to further filter entries. An option is available within the script settings to toggle this on/off should you wish to do the same.
This is a premium script. Please DM me for access.
Schaff Trend CycleWhat is STC?
This is an open source indicator but I added a few improvements to its code and a more friendly UI.
The STC indicator is a forward-looking, leading indicator, that generates faster, more accurate signals than earlier indicators, such as the MACD because it considers both time (cycles) and moving averages. Like any chart indicator, the tool is best used with other forms of analysis and its performance will surely vary as market conditions change.
Know more about STC here: Investopedia .
How to Read STC :
1. Main use
--look if momentum is bullish or bearish
--Bullish = Above 75
--Bearish = Below 25
--Neutral = negligible movement inside here
2. If flat at extremes (100 and 0), it means that the momentum is strong
3. Pivots
--To show if there’s a shift of momentum
Access and Documentation:
Message or PM me to know how to get access.

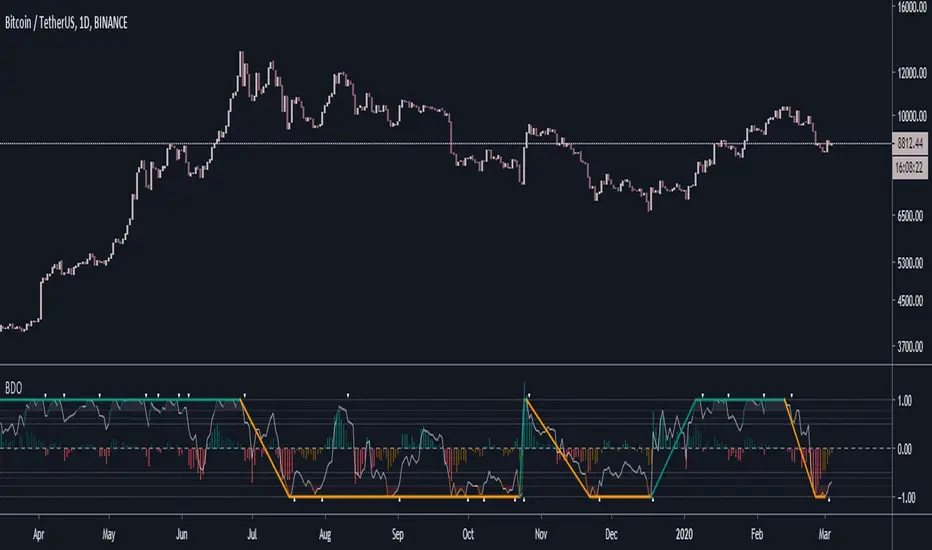
Better Donchian OscillatorWhat is BDO?
- BDO is the Better Donchian Oscillator. This is a proprietary indicator which I derived from the donchian formula.
BDO usage
1. BDO is mainly used to determine overbought and oversold levels. I think it is more accurate in determing these levels than RSI or MACD.
2. It can also be used to follow major trends with a very high accuracy, although it is lagging. However, its main oscillator in the middle is still a leading indicator.
Access and Documentation:
Message or PM to know how to get access.
ZFelds Stoch Cubed³Three Stochastic Lengths combined into one unit based on the Stochastacult Strategy.
Thanks to Krown and The Caretaker for the inspiration for this indicator.
Pink = Fast Plot
Red/Orange = Medium Plot
Blue/Green = Slow Plot
Purple Zone = Bearish Control Zone
Blue Zone = Bullish Control Zone
The indicator is used in the following fashion for optimal scalping entries/exits especially.
Long Entries: Look for the fast (Pink) Plot to cross upwards through the Medium AND Slow Plots in the Bearish Control Zone (Purple Zone)
Short Entries: Look for the fast (Pink) Plot to cross DOWNWARDS through the Medium AND Slow Plots in the Bullish Control Zone (Blue Zone)
~~~~
Pink Crossing Red/Orange plots = earlier signal
Pink Crossing Blue/Green plots = later signal (often continuation signal)
~~~~
These postures can hold even more weight when aligned with divergence, horizontal levels, moving averages, Bollinger bands, etc.
~~~~

Recursive Median Oscillator by Jhon EhlersEN: Impulsive noise spikes or extreme price or volume data are not unusual in the financial markets and these extreme values can throw off your averaging calculations. Ehlers thinks, How can you set up a data filter to remove these extreme price movements? This Stocks & Commodities Contributing Editor shows you a way to handle this by using a filter that discards all data except the median value.
TR: Dürtüsel fiyat hareketleri, aşırı fiyatlamalar yada hacim artışları finansal piyasalarda olağan dışı değildir ve bu hareketler genelde ortalama hesaplarımızın savrulmasına sebep olur. Ehlers bu aşırı fiyat hareketliliklerinin neden olduğu ortalamalardaki bu savrulmanın nasıl kaldırıcağını düşünür ve medyan değer hariç tüm verileri silen bir filtre kullanarak bunu halletmenin bir yolunu bulur.

Market Waves Omega All-In-One IndicatorMarket Waves Omega Indicator consists of 5 separate indicators wrapped into one display area, which makes it easy to see all the information in one go.
Momentum waves
The main area of Market Waves Omega Indicator are the momentum waves, this shows bear and bull divergence as shown on the diagram below:
The idea here is that you are looking for a big momentum wave, followed by a smaller trigger wave. At that point, the price will move accordingly. Note the lighter blue peaks, when these light blue peaks cut in, it’s the end of that trend and the actual trigger point. The wave is not complete until the close of that candle.
The best way to use Market Waves Omega Indicator is to work on the higher time frames first, to get a bigger picture of where the market is moving. So on the daily, if it looks bullish, then you should be looking for bull triggers on the smaller time frames to trade.
VWAP
The next indicator that needs to be considered is the VWAP, shown on the diagram above in yellow. VWAP is volume-weighted average price and shows where the volume is on a positive or negative position. This is typically used by traders on the smaller time frames but gives the user an idea of where the main buyers or sellers are at that point.
RSI
Another indicator within Market Waves Omega Indicator is the RSI, which every trader uses to get an idea of whether the price is overbought or oversold:
Money Flow
The Money Flow Index (MFI) is a technical oscillator that uses price and volume for identifying overbought or oversold conditions in an asset. It can also be used to spot divergences which warn of a trend change in price:
Stoch RSI
Stochastic RSI oscillator was developed to take advantage of both momentum indicators in order to create a more sensitive indicator that is attuned to a specific security's historical performance rather than a generalized analysis of price change.
Green Dots
One of the biggest indicators use to trade off the Market Waves Omega Indicator are green dots :
The green dots are showing when the RSI is super low and therefore should spark some buying pressure due to market being oversold.
One great thing about Market Waves Omega Indicator is that all the data is in one place, and you can see a lot of information, making it easier to scroll through the different time frames at speed and understand the general market position.

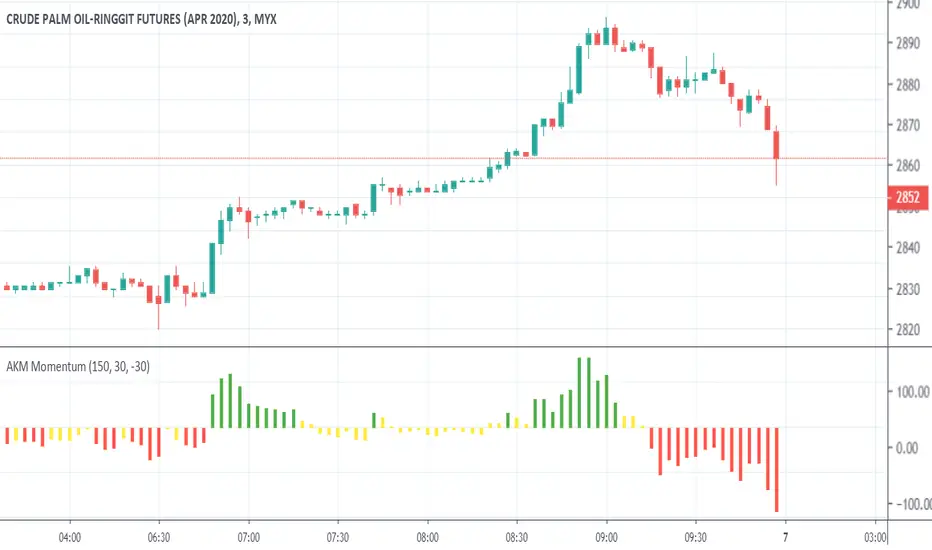
AKM MomentumAKM Momentum
Rekomendasi
FCPO
Timeframe Value LM Upper Value LM Bottom
3M 30 -30
15M 50 -50
Hull Signal and Auto Fib 30 secThis script will not be given away for free. Been months of developing and the effort is paying off.
The code uses a 40 HULL MA on the 30 second chart to identify up/down changes in trend. It ensures the equity is positive on the day to go long, or negative on the day to go short.
It draws the stop and fib lines according to the current 3 min ATR over the last 4 periods (12 minutes) : x1 x2 x3 x4 x6
Candles are highlighted upon entries. Grid begins.
Code resets upon one of the following:
- 4x target achieved and the trade has been active for 30 minutes
- 6x target achieved
- Stop hits
- 30 minutes have lapsed and the close is less than target x2
I have performed simple strategy analyses and have determined:
(Approximately)
34% lose x1
66% achieve 1:1, manually stop out at B/E after first target hits
48% achieve 2:1, manually stop out above B/E after x2 target hits
38% achieve 3:1, manually stop out above x1 after x3 target hits (will reset fib grid without change in trend)
13% achieve 4:1, manually stop out above x3 after x4 target hits (will reset fib grid without change in trend)
I have not evaluated for x6 though it expected to be around 5% of the winning trades. (will reset fib grid without change in trend)
Message me if your interested further.

Point and Figure (PnF) MomentumThis is live and non-repainting Point and Figure Chart Momentum tool. The script has it’s own P&F engine and not using integrated function of Trading View.
Point and Figure method is over 150 years old. It consist of columns that represent filtered price movements. Time is not a factor on P&F chart but as you can see with this script P&F chart created on time chart.
P&F chart provide several advantages, some of them are filtering insignificant price movements and noise, focusing on important price movements and making support/resistance levels much easier to identify.
Momentum indicator measures the rate of change or speed of price movement. It compares the current price with the previous price from a number of periods ago. By analysing the rate of change , possible to gauge the strength or “momentum”. By using this script we get Point and Figure chart momentum.
If you are new to Point & Figure Chart then you better get some information about it before using this tool. There are very good web sites and books. Please PM me if you need help about resources.
Options in the Script
Box size is one of the most important part of Point and Figure Charting. Chart price movement sensitivity is determined by the Point and Figure scale. Large box sizes see little movement across a specific price region, small box sizes see greater price movement on P&F chart. There are four different box scaling with this tool: Traditional, Percentage, Dynamic (ATR), or User-Defined
4 different methods for Box size can be used in this tool.
User Defined: The box size is set by user. A larger box size will result in more filtered price movements and fewer reversals. A smaller box size will result in less filtered price movements and more reversals.
ATR: Box size is dynamically calculated by using ATR, default period is 20.
Percentage: uses box sizes that are a fixed percentage of the stock's price. If percentage is 1 and stock’s price is $100 then box size will be $1
Traditional: uses a predefined table of price ranges to determine what the box size should be.
Price Range Box Size
Under 0.25 0.0625
0.25 to 1.00 0.125
1.00 to 5.00 0.25
5.00 to 20.00 0.50
20.00 to 100 1.0
100 to 200 2.0
200 to 500 4.0
500 to 1000 5.0
1000 to 25000 50.0
25000 and up 500.0
Default value is “ATR”, you may use one of these scaling method that suits your trading strategy.
If ATR or Percentage is chosen then there is rounding algorithm according to mintick value of the security. For example if mintick value is 0.001 and box size (ATR/Percentage) is 0.00124 then box size becomes 0.001.
And also while using dynamic box size (ATR or Percentage), box size changes only when closing price changed.
Reversal : It is the number of boxes required to change from a column of Xs to a column of Os or from a column of Os to a column of Xs. Default value is 3 (most used). For example if you choose reversal = 2 then you get the chart similar to Renko chart.
Source: Closing price or High-Low prices can be chosen as data source for P&F charting.
There is 2 options for P&F Momentum
Length: Length for the P&F Momentum, default value is 10
Display as: there are two options and can display as “Histogram” or “Line”

Growing or Waning Patterns [Alerts]Example how to color patterns of 3 bodies growing or waning by percentage with or without trend. Also included option for alert triggers. The yellow triangles on the chart denote where the alert triggers will fire.
• Choose Pattern Of Filter: shows bodies growing or waning or both.
• Sample Lengths Of AvgBar: number of recent bars to use for average size.
• BigBar Is Min% Of AvgBar: the minimum percent of average the big bar must be.
• MedBar Is Max% Of BigBar: the maximum percent of big bar the medium bar can be.
• SmlBar Is Max% Of MedBar: the maximum percent of medium bar the small bar can be.
• Repeat Pattern If n Bars: the number of bars to ignore repeat patterns, 1 allows all.
• Trending: on requires the growing or waning patterns to also be trending.
• GrayBars: colors non pattern bodies gray.
NOTICE: This is an example script and not meant to be used as an actual strategy. By using this script or any portion thereof, you acknowledge that you have read and understood that this is for research purposes only and I am not responsible for any financial losses you may incur by using this script!

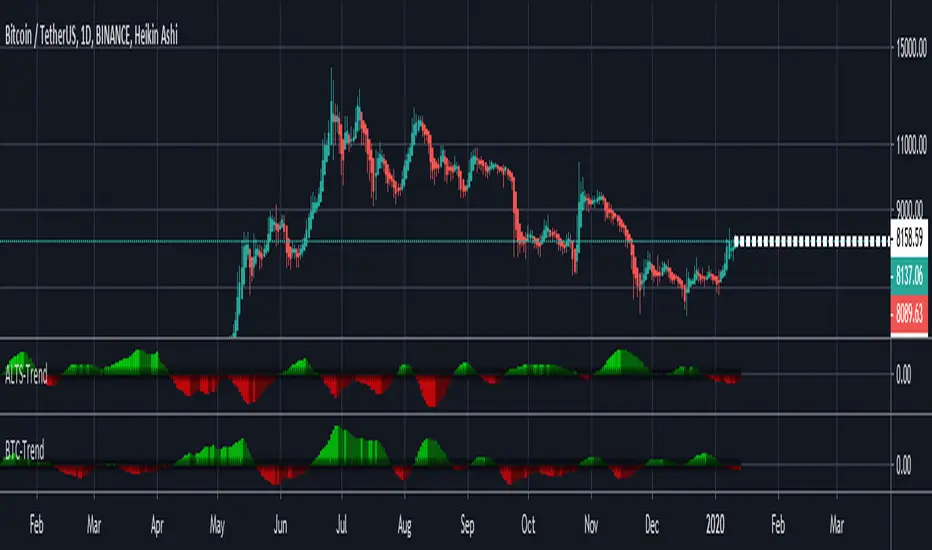
ALTS-Trend
ALTS-Trend
Altcoins-Trend is a technique that shows how much Altcoins is dominating the Marketcap and it's effect over the whole Crypto Market ,and that will show you alts season in each time frame because trend is relative .
*** Features
* Color grading to show you the Increase of domination effect (Green).
* Color grading to show you the Decrease of domination effect (Red) .
* Better understanding to the market ,and that will help you with a very good timed trades at the best trading times for altcoins .
/////////////////////////////////////////////
*Note
Special thanks for Lazybear for his momentum algorithm .
Volume Weighted TSI V 1.0This script uses a unique calculation for True Strength Indicator (TSI) and incorporates volume weighting the chosen source over a variable length.
The frame length changes dynamically to minimize chop zones.
Two lines:
- a signal line and a moving average of the signal line
There are a few ways to use this indicator:
- look for the cross of the signal line with the moving average for an early marker, this is more volatile
- look for the signal line cross with zero line a medium volatility marker
- look for the average to cross the zero line, a less volatile marker but comes in later
- over sold and over bought zones, suggest looking for exits from those zones as a trigger
Parameter explanation:
- setting the source for the TSI, this is then weighed with volume
- setting the maximum and minimum length, this sets the boundaries for the dynamic length/frame, actual frame lengths will fall within these boundaries (be sensitive to using very high lengths the indicator may fail on loop calculations)
- setting the change look back for TSI, the standard setting is 1, you can play with this for fine tuning
- the boundary that sets the value for overbought/oversold
What you see
- signal line
- moving average of signal line, this is colored to show points of velocity
- overbought/oversold circles at the top or bottom that meet boundary criteria
- diamonds that show crossing events
