Dynamic RSI Mean Reversion StrategyDynamic RSI Mean Reversion Strategy
Overview:
This strategy uses an RSI with ATR-Adjusted OB/OS levels in order to enhance the quality of it's mean reversion trades. It also incorporates a form of trend filtering in an effort to minimize downside and maximize upside. The backtest has fewer trades, as it uses substantial filtering to enhance trade quality. As you can see, I didn't cherry pick the results, so the results aren't the most beautiful thing you'll see in your life. I did this to ensure nobody gets misled. If you need a higher frequency of trades, consider removing the trend filter or increasing the length of the EMAs used for trend detection.
Features:
Dynamic OB/OS Levels: Uses ATR to adjust overbought and oversold thresholds dynamically, making the RSI more responsive in varying volatility conditions. This approach enhances signal strength by expanding the RSI range in high volatility and tightening it in low volatility.
Mean Reversion Focus: Designed for mean reversion but incorporates a trend-following filter to reduce countertrend trades. When the RSI is high, it often indicates an uptrend, so a trend filter prevents shorting in these cases and the same goes for downtrends and longing.
Trend Filtering: A moving average cross trend filter checks for the trend direction, with the RSI signal line color-coded to reflect trend shifts. Entries occur when the RSI crosses above or below the dynamic thresholds and is not a countertrend trade.
Stop Losses: Stop losses are set based on ATR distance from the entry price, providing volatility-adjusted protection.
Note:
If you're using this strategy on assets with a higher price, remember to increase the initial capital in the strategy settings. Otherwise, the strategy won't generate any (or many) trades and you'll end up with some inaccurate results.
Recommended Use:
Test it on different assets and timeframes. I’ve found the best results with standard RSI inputs, a relatively slow ATR, and a slower MA cross for trend filtering. Thus, the defaults are set that way. If the trend metrics are too slow, you’ll filter out too many good trades while allowing crummy ones; if too fast, most trades may be filtered out. As always, this has a lot of configurability so experiment to find the balance that works for your trading style.
Meanreversion

Power Root SuperTrend [AlgoAlpha]📈🚀 Power Root SuperTrend by AlgoAlpha - Elevate Your Trading Strategy! 🌟
Introducing the Power Root SuperTrend by AlgoAlpha, an advanced trading indicator that enhances the traditional SuperTrend by incorporating Root-Mean-Square (RMS) calculations for a more responsive and adaptive trend detection. This innovative tool is designed to help traders identify trend directions, potential take-profit levels, and optimize entry and exit points with greater accuracy, making it an excellent addition to your trading arsenal.
Key Features:
🔹 Root-Mean-Square SuperTrend Calculation : Utilizes the RMS of closing prices to create a smoother and more sensitive SuperTrend line that adapts quickly to market changes.
🔸 Multiple Take-Profit Levels : Automatically calculates and plots up to seven take-profit levels (TP1 to TP7) based on market volatility and the change in SuperTrend values.
🟢 Dynamic Trend Coloring : Visually distinguish between bullish and bearish trends with customizable colors for clearer market visualization.
📊 RSI-Based Take-Profit Signals : Incorporates the Relative Strength Index (RSI) of the distance between the price and the SuperTrend line to generate additional take-profit signals.
🔔 Customizable Alerts : Set alerts for trend direction changes, achievement of take-profit levels, and RSI-based take-profit conditions to stay informed without constant chart monitoring.
How to Use:
Add the Indicator : Add the indicator to favorites by pressing the ⭐ icon or search for "Power Root SuperTrend " in the TradingView indicators library and add it to your chart. Adjust parameters such as the ATR multiplier, ATR length, RMS length, and RSI take-profit length to suit your trading style and the specific asset you are analyzing.
Analyze the Chart : Observe the SuperTrend line and the plotted take-profit levels. The color changes indicate trend directions—green for bullish and red for bearish trends.
Set Alerts : Utilize the built-in alert conditions to receive notifications when the trend direction changes, when each TP level is drawn, or when RSI-based take-profit conditions are met.
How It Works:
The Power Root SuperTrend indicator enhances traditional SuperTrend calculations by applying a Root-Mean-Square (RMS) function to the closing prices, resulting in a more responsive trend line that better reflects recent price movements. It calculates the Average True Range (ATR) to determine the volatility and sets the upper and lower SuperTrend bands accordingly. When a trend direction change is detected—signified by the SuperTrend line switching from above to below the price or vice versa—the indicator calculates the change in the SuperTrend value. This change is then used to establish multiple take-profit levels (TP1 to TP7), each representing incremental targets based on market volatility. Additionally, the indicator computes the RSI of the distance between the current price and the SuperTrend line to generate extra take-profit signals when the RSI crosses under a specific threshold. The combination of RMS calculations, multiple TP levels, dynamic coloring, and RSI signals provides traders with a comprehensive tool for identifying trends and optimizing trade exits. Customizable alerts ensure that traders can stay updated on important market developments without needing to constantly watch the charts.
Elevate your trading strategy with the Power Root SuperTrend indicator and gain a smarter edge in the markets! 🚀✨

Z-Score RSI StrategyOverview
The Z-Score RSI Indicator is an experimental take on momentum analysis. By applying the Relative Strength Index (RSI) to a Z-score of price data, it measures how far prices deviate from their mean, scaled by standard deviation. This isn’t your traditional use of RSI, which is typically based on price data alone. Nevertheless, this unconventional approach can yield unique insights into market trends and potential reversals.
Theory and Interpretation
The RSI calculates the balance between average gains and losses over a set period, outputting values from 0 to 100. Typically, people look at the overbought or oversold levels to identify momentum extremes that might be likely to lead to a reversal. However, I’ve often found that RSI can be effective for trend-following when observing the crossover of its moving average with the midline or the crossover of the RSI with its own moving average. These crossovers can provide useful trend signals in various market conditions.
By combining RSI with a Z-score of price, this indicator estimates the relative strength of the price’s distance from its mean. Positive Z-score trends may signal a potential for higher-than-average prices in the near future (scaled by the standard deviation), while negative trends suggest the opposite. Essentially, when the Z-Score RSI indicates a trend, it reflects that the Z-score (the distance between the average and current price) is likely to continue moving in the trend’s direction. Generally, this signals a potential price movement, though it’s important to note that this could also occur if there’s a shift in the mean or standard deviation, rather than a meaningful change in price itself.
While the Z-Score RSI could be an insightful addition to a comprehensive trading system, it should be interpreted carefully. Mean shifts may validate the indicator’s predictions without necessarily indicating any notable price change, meaning it’s best used in tandem with other indicators or strategies.
Recommendations
Before putting this indicator to use, conduct thorough backtesting and avoid overfitting. The added parameters allow fine-tuning to fit various assets, but be careful not to optimize purely for the highest historical returns. Doing so may create an overly tailored strategy that performs well in backtests but fails in live markets. Keep it balanced and look for robust performance across multiple scenarios, as overfitting is likely to lead to disappointing real-world results.

Volume-Adjusted Schaff Trend Cycle (VASTC)Volume-Adjusted Schaff Trend Cycle (VASTC)
The VASTC is a fairly fast-moving oscillator designed to identify trends early and signal when trends may be nearing their end. While it can be used for both trend-following and mean-reversion strategies , it shines in trend-following setups. It’s particularly useful for catching the start of a trend and giving early warnings that a trend might end soon, making it a valuable addition to a multi-indicator system.
How It Works:
The VASTC adapts the traditional Schaff Trend Cycle by adjusting the MACD component with volume data. This volume-adjusted MACD is run through two stochastic processes , applying exponential smoothing to enhance responsiveness. Volume sensitivity allows the VASTC to adapt dynamically to periods of high or low trading activity, providing more reliable trend signals.
Recommended Use:
Use VASTC in confluence with other indicators to confirm trend entries and exits. It’s best for identifying early trend setups rather than sustaining prolonged trend trades. When used alongside other indicators, especially those with a longer-term outlook or momentum based trend indicators, you’ll gain a clearer signal for potential exits or entries. Always backtest the VASTC on your chosen assets to determine the most effective input parameters, as the defaults may not suit all markets or assets. Different assets behave differently, and adjustments in parameters can improve its ability to analyze the assets you're looking at.
Parameters:
Length : Sets the primary smoothing length.
Fast/Slow Length : Adjust the speed of the volume-adjusted MACD component.
Factor : Controls the final smoothing applied to the STC.
Overbought/Oversold Levels : Defines overbought/oversold levels.
Experiment with these settings to customize the VASTC to your trading strategy and asset.
Disclaimer : This indicator is a tool to complement your trading analysis and should not be used in isolation. Always backtest and use other confluence signals for best results. The assets I looked at when making this indicator are almost certainly different than what you're looking at.

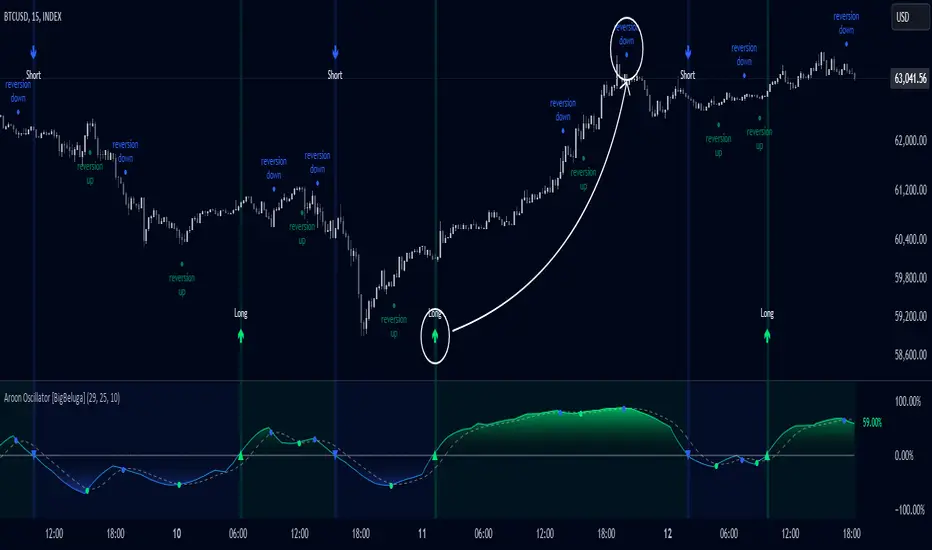
Aroon Oscillator [BigBeluga]Aroon Oscillator with Mean Reversion & Trend Signals is a versatile tool that helps traders identify both trend direction and potential mean reversion points. The core Aroon Oscillator tracks the strength of a trend by measuring how long it has been since a high or low price occurred within a specified period. This oscillator provides trend-following signals (LONG/SHORT) along with mean reversion signals, giving traders both the ability to ride trends and anticipate reversals.
The unique feature of this indicator is the Mean Reversion Signals, marked with dots on the main chart, indicating potential points where the trend might reverse or retrace. In addition, trend-following signals (LONG and SHORT) are plotted directly on the chart, providing clear entry and exit points when a trend is beginning or ending.
🔵 IDEA
The Aroon Oscillator with Mean Reversion indicator provides a combined approach of trend analysis and mean reversion. The core idea is to track the health and momentum of trends, while also identifying when those trends might reverse or slow down. This dual approach allows traders to both follow the prevailing market direction and also capture mean reversion opportunities.
The oscillator is smoothed with John Ehlers' Zero Lag function , which helps reduce noise and improves signal clarity by removing lag without sacrificing the indicator's responsiveness.
The indicator uses color-coded signals and an easy-to-read oscillator to visually represent different types of signals on the chart. This makes it easy for traders to spot important changes in market trends and take action based on both the trend-following and mean reversion aspects of the indicator.
🔵 KEY FEATURES & USAGE
Trend Following Signals (LONG/SHORT):
In addition to mean reversion signals, the indicator also provides clear trend-following signals. LONG signals (green arrows) are plotted when the oscillator crosses above zero, indicating a potential uptrend. Conversely, SHORT signals (blue arrows) are plotted when the oscillator crosses below zero, signaling a potential downtrend.
Mean Reversion Signals:
This indicator features unique mean reversion signals, represented by dots on the main chart. These signals occur when the oscillator crosses over or under a smoother signal line, indicating that the current trend might be losing strength and a reversal or retracement is possible. Green dots represent a possible upward reversion, while blue dots signal a potential downward reversion.
Color-Coded Signals and Oscillator:
The Aroon Oscillator is color-coded to make it visually easier for traders to differentiate between trends and mean reversion signals. When the oscillator is above zero, the area is filled with green, and when it is below zero, the area is filled with blue. This visual representation helps traders quickly identify the current market condition at a glance.
🔵 CUSTOMIZATION
Aroon Length & Smoothing: Control the sensitivity of the Aroon Oscillator by adjusting the lookback period and smoothing settings, allowing traders to fine-tune the indicator to match different market conditions.
Mean Reversion Signals: Enable or disable mean reversion signals based on your trading preferences. Adjust the signal line length to control when these reversal signals are triggered.
Color Customization: Customize the colors for the oscillator and signals to match your chart’s color scheme for better visual clarity.
ATR Adjusted RSIATR Adjusted RSI Indicator
By Nathan Farmer
The ATR Adjusted RSI Indicator is a versatile indicator designed primarily for trend-following strategies, while also offering configurations for overbought/oversold (OB/OS) signals, making it suitable for mean-reversion setups. This tool combines the classic Relative Strength Index (RSI) with a unique Average True Range (ATR)-based smoothing mechanism, allowing traders to adjust their RSI signals according to market volatility for more reliable entries and exits.
Key Features:
ATR Weighted RSI:
At the core of this indicator is the ATR-adjusted RSI line, where the RSI is smoothed based on volatility (measured by the ATR). When volatility increases, the smoothing effect intensifies, resulting in a more stable and reliable RSI reading. This makes the indicator more responsive to market conditions, which is especially useful in trend-following systems.
Multiple Signal Types:
This indicator offers a variety of signal-generation methods, adaptable to different market environments and trading preferences:
RSI MA Crossovers: Generates signals when the RSI crosses above or below its moving average, with the flexibility to choose between different moving average types (SMA, EMA, WMA, etc.).
Midline Crossovers: Provides trend confirmation when either the RSI or its moving average crosses the 50 midline, signaling potential trend reversals.
ATR-Inversely Weighted RSI Variations: Uses the smoothed, ATR-adjusted RSI for a more refined and responsive trend-following signal. There are variations both for the MA crossover and the midline crossover.
Overbought/Oversold Conditions: Ideal for mean reversion setups, where signals are triggered when the RSI or its moving average crosses over overbought or oversold levels.
Flexible Customization:
With a wide range of customizable options, you can tailor the indicator to fit your personal trading style. Choose from various moving average types for the RSI, modify the ATR smoothing length, and adjust overbought/oversold levels to optimize your signals.
Usage:
While this indicator is primarily designed for trend-following, its OB/OS configurations make it highly effective for mean-reverting setups as well. Depending on your selected signal type, the relevant indicator line will change color between green and red to visually signal long or short opportunities. This flexibility allows traders to switch between trending and sideways market strategies seamlessly.
A Versatile Tool:
The ATR Adjusted RSI Indicator is a valuable component of any trading system, offering enhanced signals that adapt to market volatility. However, it is not recommended to rely on this indicator alone, especially without thorough backtesting. Its performance varies across different assets and timeframes, so it’s essential to experiment with the parameters to ensure consistent results before applying it in live trading.
Recommendation:
Before incorporating this indicator into live trading, backtest it extensively. Given its flexibility and wide range of signal-generation methods, backtesting allows you to optimize the settings for your preferred assets and timeframes. Only consider using it on it's own if you are confident in its performance based on your own backtest results, and even then, it is not recommended.

Session Range Breakouts With Targets [AlgoAlpha]⛓️💥Session Range Breakouts With Targets 🚀
Introducing the "Session Range Breakouts With Targets" indicator by AlgoAlpha, a powerful tool for traders to capitalize on session-based range breakouts and identify precise target zones using ATR-based calculations! Whether you trade the Asian, American, European, or Oceanic sessions, this script highlights key breakout levels and targets that adapt to market volatility, ensuring you're always prepared for those crucial price movements. 🕒📊
Session-based Trading : The indicator highlights session-specific ranges, offering clear breakouts for Asian, American, European, Oceanic, and even custom sessions 🌍.
Adaptive Volatility Zones : Uses ATR to determine dynamic zone widths, filtering out fakeouts and adjusting to market conditions ⚡.
Precise Take-Profit Targets : Set multiple levels of take-profits based on ATR multipliers, ensuring you can manage both aggressive and conservative trades 🎯.
Customizable Appearance : Tailor the look with customizable colors for session highlights and breakout zones to fit your chart style 🎨.
Alerts on Key Events : Built-in alert conditions for breakouts and take-profit hits, so you never miss a trading opportunity 🔔.
🚀 Quick Guide to Using the Indicator
🛠 Add the Indicator : Add the indicator to favorites by pressing the star icon. Choose your session (Asia, America, Europe, Oceana, or Custom) and adjust the ATR length, zone width multiplier, and target multipliers to suit your strategy.
📊 Analyze Breakouts : Watch for the indicator to plot upper and lower range boxes based on session highs and lows. Price breaking through these boxes will signal a potential entry.
📈 Monitor Targets : Track bullish and bearish targets as price moves, with up to three take-profit levels based on ATR multipliers.
🔔 Set Alerts : Enable alerts for session breakouts or when price hits your designated take-profit targets.
🔍 How It Works
This script operates by identifying session-specific ranges based on highs and lows from the beginning of the selected session (Asia, America, Europe, or others). After a user-defined wait period (default: 120 bars), it calculates the highest and lowest points and creates upper and lower zones using the Average True Range (ATR) to adapt to market volatility. If the price breaks above or below these zones, it is identified as a breakout, and the script dynamically calculates up to three take-profit targets for both bullish and bearish scenarios using an ATR multiplier. The indicator also includes alerts for breakouts and take-profit hits, providing real-time trading signals.

Adaptive SuperTrend Oscillator [AlgoAlpha]Adaptive SuperTrend Oscillator 🤖📈
Introducing the Adaptive SuperTrend Oscillator , an innovative blend of volatility clustering and SuperTrend logic designed to identify market trends with precision! 🚀 This indicator uses K-Means clustering to dynamically adjust volatility levels, helping traders spot bullish and bearish trends. The oscillator smoothly tracks price movements, adapting to market conditions for reliable signals. Whether you're scalping or riding long-term trends, this tool has got you covered! 💹✨
🔑 Key Features:
📊 Volatility Clustering with K-Means: Segments volatility into three levels (high, medium, low) using a K-Means algorithm for precise trend detection.
📈 Normalized Oscillator : Allows for customizable smoothing and normalization, ensuring the oscillator remains within a fixed range for easy interpretation.
🔄 Heiken Ashi Candles : Optionally visualize smoothed trends with Heiken Ashi-style candlesticks to better capture market momentum.
🔔 Alert System : Get notified when key conditions like trend shifts or volatility changes occur.
🎨 Customizable Appearance : Fully customizable colors for bullish/bearish signals, along with adjustable smoothing methods and lengths.
📚 How to Use:
⭐ Add the indicator to favorites by pressing the star icon. Customize settings to your preference:
👀 Watch the chart for trend signals and reversals. The oscillator will change color when trends shift, offering visual confirmation.
🔔 Enable alerts to be notified of critical trend changes or volatility conditions
⚙️ How It Works:
This script integrates SuperTrend with volatility clustering by analyzing ATR (Average True Range) to dynamically identify high, medium, and low volatility clusters using a K-Means algorithm . The SuperTrend logic adjusts based on the assigned volatility level, creating adaptive trend signals. These signals are then smoothed and optionally normalized for clearer visual interpretation. The Heiken Ashi transformation adds an additional layer of smoothing, helping traders better identify the market's true momentum. Alerts are set to notify users of key trend shifts and volatility changes, allowing traders to react promptly.

Dynamic Supply and Demand Zones [AlgoAlpha]Introducing the Dynamic Supply and Demand Zones by AlgoAlpha. This indicator is designed to automatically identify and visualize dynamic supply and demand zones on your chart, helping traders pinpoint potential reversal areas and assess market sentiment with enhanced clarity. It adapts to market conditions using a dynamic look-back mechanism, making it more responsive to recent price movements. 📈💡
Key Features
📊 Dynamic Look-Back : Automatically adjusts the look-back period based on the most recent pivot point, ensuring the most relevant data is analyzed.
🎯 Pivot Point Detection : Utilizes a user-defined period to detect significant pivot highs and lows, marking potential reversal points with precision.
🛠 Customizable Parameters : Offers extensive customization options including look-back period, pivot detection sensitivity, resolution, and zone tolerance.
🗺 Visual Display : Shows supply and demand zones as boxes on the chart, with optional profiles and background highlighting to differentiate between bullish and bearish zones.
🖍 Color-Coded Zones : Zones are color-coded for easy identification: green for bullish, red for bearish, and gray for neutral levels.
🔔 Alert Conditions : Triggers alerts when new pivot points are detected, ensuring you never miss a key market movement.
How to Use
🚀 Adding the Indicator : Press the star icon and add the indicator to favorites. Add it to your chart and adjust settings to fit your trading strategy.
🔍 Zone Analysis : Observe the color-coded zones on the chart. Bullish zones indicate potential support areas, while bearish zones suggest resistance. Monitor price interactions with these zones for potential entry and exit signals.
🔔 Alerts : Activate alert conditions for new pivot detections to stay ahead of market reversals.
How It Works
The indicator starts by detecting pivot highs and lows over a specified period. These pivots serve as reference points for determining the analysis range. If the Dynamic Look-Back feature is enabled, the look-back range dynamically adjusts from the most recent pivot to the current bar. Otherwise, a fixed look-back period is used. The price range is divided into multiple bins based on a specified resolution, and each bin’s volume is calculated by accumulating the volume of candles that fall within its price range. A zone is defined as significant if its volume is less than the adjacent bins, and the difference meets the Zone Tolerance criteria, indicating a potential area of support or resistance. These zones are then plotted on the chart as boxes. Bullish zones are shown in green, and bearish zones in red, helping traders visually identify key levels where supply and demand imbalances may cause price reversals.

Mean Reversion Cloud (Ornstein-Uhlenbeck) // AlgoFyreThe Mean Reversion Cloud (Ornstein-Uhlenbeck) indicator detects mean-reversion opportunities by applying the Ornstein-Uhlenbeck process. It calculates a dynamic mean using an Exponential Weighted Moving Average, surrounded by volatility bands, signaling potential buy/sell points when prices deviate.
TABLE OF CONTENTS
🔶 ORIGINALITY
🔸Adaptive Mean Calculation
🔸Volatility-Based Cloud
🔸Speed of Reversion (θ)
🔶 FUNCTIONALITY
🔸Dynamic Mean and Volatility Bands
🞘 How it works
🞘 How to calculate
🞘 Code extract
🔸Visualization via Table and Plotshapes
🞘 Table Overview
🞘 Plotshapes Explanation
🞘 Code extract
🔶 INSTRUCTIONS
🔸Step-by-Step Guidelines
🞘 Setting Up the Indicator
🞘 Understanding What to Look For on the Chart
🞘 Possible Entry Signals
🞘 Possible Take Profit Strategies
🞘 Possible Stop-Loss Levels
🞘 Additional Tips
🔸Customize settings
🔶 CONCLUSION
▅▅▅▅▅▅▅▅▅▅▅▅▅▅▅▅▅▅▅▅▅▅▅▅▅▅▅▅▅▅▅▅▅▅▅▅▅▅▅▅▅▅▅▅▅▅
🔶 ORIGINALITY The Mean Reversion Cloud (Ornstein-Uhlenbeck) is a unique indicator that applies the Ornstein-Uhlenbeck stochastic process to identify mean-reverting behavior in asset prices. Unlike traditional moving average-based indicators, this model uses an Exponentially Weighted Moving Average (EWMA) to calculate the long-term mean, dynamically adjusting to recent price movements while still considering all historical data. It also incorporates volatility bands, providing a "cloud" that visually highlights overbought or oversold conditions. By calculating the speed of mean reversion (θ) through the autocorrelation of log returns, this indicator offers traders a more nuanced and mathematically robust tool for identifying mean-reversion opportunities. These innovations make it especially useful for markets that exhibit range-bound characteristics, offering timely buy and sell signals based on statistical deviations from the mean.
🔸Adaptive Mean Calculation Traditional MA indicators use fixed lengths, which can lead to lagging signals or over-sensitivity in volatile markets. The Mean Reversion Cloud uses an Exponentially Weighted Moving Average (EWMA), which adapts to price movements by dynamically adjusting its calculation, offering a more responsive mean.
🔸Volatility-Based Cloud Unlike simple moving averages that only plot a single line, the Mean Reversion Cloud surrounds the dynamic mean with volatility bands. These bands, based on standard deviations, provide traders with a visual cue of when prices are statistically likely to revert, highlighting potential reversal zones.
🔸Speed of Reversion (θ) The indicator goes beyond price averages by calculating the speed at which the price reverts to the mean (θ), using the autocorrelation of log returns. This gives traders an additional tool for estimating the likelihood and timing of mean reversion, making the signals more reliable in practice.
🔶 FUNCTIONALITY The Mean Reversion Cloud (Ornstein-Uhlenbeck) indicator is designed to detect potential mean-reversion opportunities in asset prices by applying the Ornstein-Uhlenbeck stochastic process. It calculates a dynamic mean through the Exponentially Weighted Moving Average (EWMA) and plots volatility bands based on the standard deviation of the asset's price over a specified period. These bands create a "cloud" that represents expected price fluctuations, helping traders to identify overbought or oversold conditions. By calculating the speed of reversion (θ) from the autocorrelation of log returns, the indicator offers a more refined way of assessing how quickly prices may revert to the mean. Additionally, the inclusion of volatility provides a comprehensive view of market conditions, allowing for more accurate buy and sell signals.
Let's dive into the details:
🔸Dynamic Mean and Volatility Bands The dynamic mean (μ) is calculated using the EWMA, giving more weight to recent prices but considering all historical data. This process closely resembles the Ornstein-Uhlenbeck (OU) process, which models the tendency of a stochastic variable (such as price) to revert to its mean over time. Volatility bands are plotted around the mean using standard deviation, forming the "cloud" that signals overbought or oversold conditions. The cloud adapts dynamically to price fluctuations and market volatility, making it a versatile tool for mean-reversion strategies. 🞘 How it works Step one: Calculate the dynamic mean (μ) The Ornstein-Uhlenbeck process describes how a variable, such as an asset's price, tends to revert to a long-term mean while subject to random fluctuations. In this indicator, the EWMA is used to compute the dynamic mean (μ), mimicking the mean-reverting behavior of the OU process. Use the EWMA formula to compute a weighted mean that adjusts to recent price movements. Assign exponentially decreasing weights to older data while giving more emphasis to current prices. Step two: Plot volatility bands Calculate the standard deviation of the price over a user-defined period to determine market volatility. Position the upper and lower bands around the mean by adding and subtracting a multiple of the standard deviation. 🞘 How to calculate Exponential Weighted Moving Average (EWMA)
The EWMA dynamically adjusts to recent price movements:
mu_t = lambda * mu_{t-1} + (1 - lambda) * P_t
Where mu_t is the mean at time t, lambda is the decay factor, and P_t is the price at time t. The higher the decay factor, the more weight is given to recent data.
Autocorrelation (ρ) and Standard Deviation (σ)
To measure mean reversion speed and volatility: rho = correlation(log(close), log(close ), length) Where rho is the autocorrelation of log returns over a specified period.
To calculate volatility:
sigma = stdev(close, length)
Where sigma is the standard deviation of the asset's closing price over a specified length.
Upper and Lower Bands
The upper and lower bands are calculated as follows:
upper_band = mu + (threshold * sigma)
lower_band = mu - (threshold * sigma)
Where threshold is a multiplier for the standard deviation, usually set to 2. These bands represent the range within which the price is expected to fluctuate, based on current volatility and the mean.
🞘 Code extract // Calculate Returns
returns = math.log(close / close )
// Calculate Long-Term Mean (μ) using EWMA over the entire dataset
var float ewma_mu = na // Initialize ewma_mu as 'na'
ewma_mu := na(ewma_mu ) ? close : decay_factor * ewma_mu + (1 - decay_factor) * close
mu = ewma_mu
// Calculate Autocorrelation at Lag 1
rho1 = ta.correlation(returns, returns , corr_length)
// Ensure rho1 is within valid range to avoid errors
rho1 := na(rho1) or rho1 <= 0 ? 0.0001 : rho1
// Calculate Speed of Mean Reversion (θ)
theta = -math.log(rho1)
// Calculate Volatility (σ)
sigma = ta.stdev(close, corr_length)
// Calculate Upper and Lower Bands
upper_band = mu + threshold * sigma
lower_band = mu - threshold * sigma
🔸Visualization via Table and Plotshapes
The table shows key statistics such as the current value of the dynamic mean (μ), the number of times the price has crossed the upper or lower bands, and the consecutive number of bars that the price has remained in an overbought or oversold state.
Plotshapes (diamonds) are used to signal buy and sell opportunities. A green diamond below the price suggests a buy signal when the price crosses below the lower band, and a red diamond above the price indicates a sell signal when the price crosses above the upper band.
The table and plotshapes provide a comprehensive visualization, combining both statistical and actionable information to aid decision-making.
🞘 Code extract // Reset consecutive_bars when price crosses the mean
var consecutive_bars = 0
if (close < mu and close >= mu) or (close > mu and close <= mu)
consecutive_bars := 0
else if math.abs(deviation) > 0
consecutive_bars := math.min(consecutive_bars + 1, dev_length)
transparency = math.max(0, math.min(100, 100 - (consecutive_bars * 100 / dev_length)))
🔶 INSTRUCTIONS
The Mean Reversion Cloud (Ornstein-Uhlenbeck) indicator can be set up by adding it to your TradingView chart and configuring parameters such as the decay factor, autocorrelation length, and volatility threshold to suit current market conditions. Look for price crossovers and deviations from the calculated mean for potential entry signals. Use the upper and lower bands as dynamic support/resistance levels for setting take profit and stop-loss orders. Combining this indicator with additional trend-following or momentum-based indicators can improve signal accuracy. Adjust settings for better mean-reversion detection and risk management.
🔸Step-by-Step Guidelines
🞘 Setting Up the Indicator
Adding the Indicator to the Chart:
Go to your TradingView chart.
Click on the "Indicators" button at the top.
Search for "Mean Reversion Cloud (Ornstein-Uhlenbeck)" in the indicators list.
Click on the indicator to add it to your chart.
Configuring the Indicator:
Open the indicator settings by clicking on the gear icon next to its name on the chart.
Decay Factor: Adjust the decay factor (λ) to control the responsiveness of the mean calculation. A higher value prioritizes recent data.
Autocorrelation Length: Set the autocorrelation length (θ) for calculating the speed of mean reversion. Longer lengths consider more historical data.
Threshold: Define the number of standard deviations for the upper and lower bands to determine how far price must deviate to trigger a signal.
Chart Setup:
Select the appropriate timeframe (e.g., 1-hour, daily) based on your trading strategy.
Consider using other indicators such as RSI or MACD to confirm buy and sell signals.
🞘 Understanding What to Look For on the Chart
Indicator Behavior:
Observe how the price interacts with the dynamic mean and volatility bands. The price staying within the bands suggests mean-reverting behavior, while crossing the bands signals potential entry points.
The indicator calculates overbought/oversold conditions based on deviation from the mean, highlighted by color-coded cloud areas on the chart.
Crossovers and Deviation:
Look for crossovers between the price and the mean (μ) or the bands. A bullish crossover occurs when the price crosses below the lower band, signaling a potential buying opportunity.
A bearish crossover occurs when the price crosses above the upper band, suggesting a potential sell signal.
Deviations from the mean indicate market extremes. A large deviation indicates that the price is far from the mean, suggesting a potential reversal.
Slope and Direction:
Pay attention to the slope of the mean (μ). A rising slope suggests bullish market conditions, while a declining slope signals a bearish market.
The steepness of the slope can indicate the strength of the mean-reversion trend.
🞘 Possible Entry Signals
Bullish Entry:
Crossover Entry: Enter a long position when the price crosses below the lower band with a positive deviation from the mean.
Confirmation Entry: Use additional indicators like RSI (above 50) or increasing volume to confirm the bullish signal.
Bearish Entry:
Crossover Entry: Enter a short position when the price crosses above the upper band with a negative deviation from the mean.
Confirmation Entry: Look for RSI (below 50) or decreasing volume to confirm the bearish signal.
Deviation Confirmation:
Enter trades when the deviation from the mean is significant, indicating that the price has strayed far from its expected value and is likely to revert.
🞘 Possible Take Profit Strategies
Static Take Profit Levels:
Set predefined take profit levels based on historical volatility, using the upper and lower bands as guides.
Place take profit orders near recent support/resistance levels, ensuring you're capitalizing on the mean-reversion behavior.
Trailing Stop Loss:
Use a trailing stop based on a percentage of the price deviation from the mean to lock in profits as the trend progresses.
Adjust the trailing stop dynamically along the calculated bands to protect profits as the price returns to the mean.
Deviation-Based Exits:
Exit when the deviation from the mean starts to decrease, signaling that the price is returning to its equilibrium.
🞘 Possible Stop-Loss Levels
Initial Stop Loss:
Place an initial stop loss outside the lower band (for long positions) or above the upper band (for short positions) to protect against excessive deviations.
Use a volatility-based buffer to avoid getting stopped out during normal price fluctuations.
Dynamic Stop Loss:
Move the stop loss closer to the mean as the price converges back towards equilibrium, reducing risk.
Adjust the stop loss dynamically along the bands to account for sudden market movements.
🞘 Additional Tips
Combine with Other Indicators:
Enhance your strategy by combining the Mean Reversion Cloud with momentum indicators like MACD, RSI, or Bollinger Bands to confirm market conditions.
Backtesting and Practice:
Backtest the indicator on historical data to understand how it performs in various market environments.
Practice using the indicator on a demo account before implementing it in live trading.
Market Awareness:
Keep an eye on market news and events that might cause extreme price movements. The indicator reacts to price data and might not account for news-driven events that can cause large deviations.
🔸Customize settings 🞘 Decay Factor (λ): Defines the weight assigned to recent price data in the calculation of the mean. A value closer to 1 places more emphasis on recent prices, while lower values create a smoother, more lagging mean.
🞘 Autocorrelation Length (θ): Sets the period for calculating the speed of mean reversion and volatility. Longer lengths capture more historical data, providing smoother calculations, while shorter lengths make the indicator more responsive.
🞘 Threshold (σ): Specifies the number of standard deviations used to create the upper and lower bands. Higher thresholds widen the bands, producing fewer signals, while lower thresholds tighten the bands for more frequent signals.
🞘 Max Gradient Length (γ): Determines the maximum number of consecutive bars for calculating the deviation gradient. This setting impacts the transparency of the plotted bands based on the length of deviation from the mean.
🔶 CONCLUSION
The Mean Reversion Cloud (Ornstein-Uhlenbeck) indicator offers a sophisticated approach to identifying mean-reversion opportunities by applying the Ornstein-Uhlenbeck stochastic process. This dynamic indicator calculates a responsive mean using an Exponentially Weighted Moving Average (EWMA) and plots volatility-based bands to highlight overbought and oversold conditions. By incorporating advanced statistical measures like autocorrelation and standard deviation, traders can better assess market extremes and potential reversals. The indicator’s ability to adapt to price behavior makes it a versatile tool for traders focused on both short-term price deviations and longer-term mean-reversion strategies. With its unique blend of statistical rigor and visual clarity, the Mean Reversion Cloud provides an invaluable tool for understanding and capitalizing on market inefficiencies.

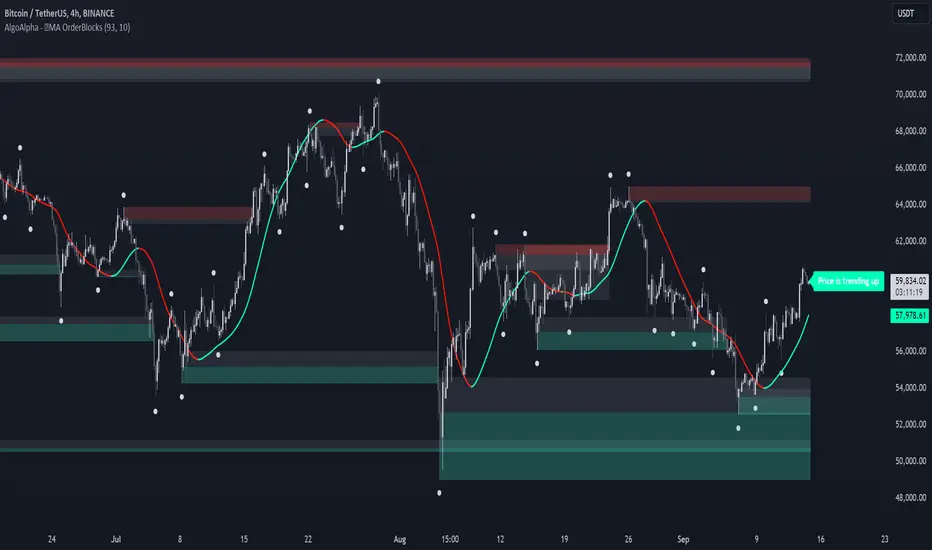
MA OrderBlocks [AlgoAlpha]🟨 HMA OrderBlocks by AlgoAlpha is a powerful tool designed to help traders visualize key pivot zones and order blocks based on the Hull Moving Average (HMA). By dynamically identifying bullish and bearish pivot points, this script provides insights into potential price reversals and trend continuations. With customizable settings, it allows traders to tweak the behavior of the indicator to match their strategies. Plus, it comes packed with built-in alerts for trend changes, making it easier to spot potential trade opportunities.
Key Features :
📊 Trend Detection : Utilizes Hull Moving Average to detect the current trend.
🟢🔴 Bullish & Bearish Zones : Automatically plots bullish and bearish order blocks, using customizable colors for clear visual cues.
🎯 Pivot Points : Detects and marks pivot highs and lows, helping traders spot key price reversals.
🚨 Alerts : Built-in alert system for when the price approaches key bullish or bearish zones, or when the trend changes.
🔨 Customizable MA: Choose from various moving averages (SMA, HMA, EMA, etc.) to suit your strategy.
How to Use :
⭐ Add the Indicator : Add the indicators to favourites by pressing the star icon. Once added, configure settings like the Hull MA period and pivot detection period.
📈 Analyze the Chart : Watch for the plotted order blocks and pivot points to identify possible price action strategies.
🔔 Enable Alerts : Set up alerts to be notified of potential trend reversals or when the price nears a bullish/bearish block.
How It Works :
The script starts by calculating the Hull Moving Average (HMA) based on the user-defined length, which is used to determine the market trend direction. It compares the current HMA value with the previous one to confirm whether the price is trending upwards or downwards. Once a trend change is detected, it plots bullish or bearish order blocks based on recent pivot highs and lows. These zones are extended in real-time as long as they remain invalidated. Zones are invalidated are invalidated when price completely closes through them. If the price gets close to a zone in the opposing direction, a warning system alerts the user that the block may not hold. Additionally, customizable alerts trigger whenever the price trend shifts or the price gets near important bullish/bearish blocks. The script’s logic ensures that order blocks are cleared if price violates them, keeping the chart clean and updated.
Smart Signals Assistant [AlgoAlpha]🟠 OVERVIEW
The Smart Signals Assistant is a comprehensive, all-in-one trading toolkit designed to provide a complete analytical framework on your chart. It is built around a primary signal engine that generates trend and reversal signals, enhanced by a suite of five optional "confluence" indicators that provide deeper market context.
This script is highly modular, allowing you to build a personalized dashboard. You can use the main signals for entries, add a machine-learning classifier to check if the market is trending, overlay dynamic support/resistance clouds, and manage your trades with on-chart take-profit and stop-loss levels. The system is tied together with a powerful, multi-step alert builder that lets you create custom alert conditions from any combination of the script's components.
🟠 CONCEPTS
This indicator is a collection of several distinct systems working together. The combination is designed to allow traders to build a complete strategy—from signal generation to confirmation and trade management—within a single tool. Here are the core concepts behind them:
Smart Signals Engine: This is the heart of the indicator and operates as a hybrid with two distinct modes. The "Swing" mode uses a proprietary model that analyzes price stability and volatility to identify stable, longer-term trends. The "Scalping" mode uses a more responsive machine-laerning trend system that dynamically adapts its parameters based on learned market 'states' to real-time changes in market conditions, making it better suited for faster, lower-timeframe movements.
Fair Value Trail (FVT): This is not a simple moving average. It's a volatility-based trail that helps identify dynamic zones of support and resistance. The concept is to track a "fair value" price, derived by analyzing price levels with significant volume activity, providing logical areas for entries or trailing stop-loss adjustments.
Trend Spine: This component calculates a core trend backbone. Its purpose is to cut through short-term noise and provide a clearer, more stable view of the underlying primary trend direction by filtering out price action during periods of low directional momentum.
Trend Bias: This is a band that measures the strength and weakness of the current price momentum. It visualizes whether bullish or bearish pressure is accelerating or decelerating by comparing recent momentum to its historical average, which is useful for confirming the conviction behind a move.
Firmament Clouds: These are dynamic zones plotted on the chart that act as potential areas of support and resistance. Unlike static lines, these clouds expand and contract based on market volatility, providing an adaptive view of key price zones where the market may be overextended.
Trend-Range Classifier (TRC): This is a machine learning model that analyzes multiple market characteristics (like volatility and momentum patterns) in real-time. It classifies the current market environment as either "trending" or "ranging," helping you decide which strategy to apply and filter signals that are inappropriate for the current conditions.
🟠 FEATURES
Trend & Reversal Signals: Configure the main engine to provide either trend-following signals or potential counter-trend reversal signals. Signals are categorized as "Normal" or "Strong" to indicate conviction.
Advanced Candle Coloring: Choose from multiple candle coloring modes, including static trend colors, a color gradient based on momentum, or a gradient based on volume. Also includes an option to highlight ranging markets with gray candles.
Automated Trade Management: Enable on-chart Take-Profit and Stop-Loss levels that are automatically calculated when a signal appears. These are visualized with colored risk/reward zones.
Component Status Table: A customizable on-chart dashboard that shows the live status, direction, and signal duration for every active component, giving you a complete overview at a glance.
Powerful Multi-Step Alert System: Build highly specific, custom alerts. You can combine dozens of built-in conditions from all components using AND/OR logic across a sequence of up to 7 steps.
External Alert Integration: The alert system can incorporate up to five external sources, allowing you to mix conditions from this script with your other favorite indicators.
🟠 USAGE
This script is designed to be adapted to your personal trading style by combining components to build a complete strategy. The synergy between the components is key to its usefulness. Here is a general workflow:
Initial Configuration: Start by enabling the core "Smart Signals" in the settings. Choose your preferred "Smart Signals Mode" (Swing or Scalping) and "Signal Mode" (Trend or Reversal) based on your strategy and timeframe.
Adding Confluence for Reliability: To increase the reliability of signals, enable one or more confluence tools. For example, a trend trader can enable the "Trend-Range Classifier" and decide to only consider signals that appear when the market is classified as "Trending." You could further enhance this by also enabling the "Fair Value Trail" and only taking buy signals that occur near or above the trail. This demonstrates how combining components filters for higher-quality setups.
Reading the Visuals: A standard "▲" or "▼" represents a normal signal, while a "+▲" or "+▼" indicates a strong signal with higher conviction. Use the candle colors to gauge the momentum within the trend.
Managing Trades: If you enable "Take-Profit Levels" and "Stop-Loss Level," the script will automatically plot these on your chart when a signal appears. This can help you pre-plan your risk and potential targets. The exit signals ("x") can be used as a suggestion for taking partial or full profits.
Setting Up Custom Alerts for High-Probability Setups: For a high-probability setup, navigate to the "Alerts" tab. You can create a sequence that combines multiple components to fire only on your ideal conditions. For instance:
Step 1: "Smart Signals Strong Bullish Signal "
Step 2: "Market Is Trending " AND "FVT In Bullish Trend "
This alert would only trigger when a strong buy signal occurs while the TRC confirms a trend and the price is in a favorable position relative to the Fair Value Trail, effectively filtering out lower-quality signals by demanding agreement between multiple, conceptually different components.
Script pago

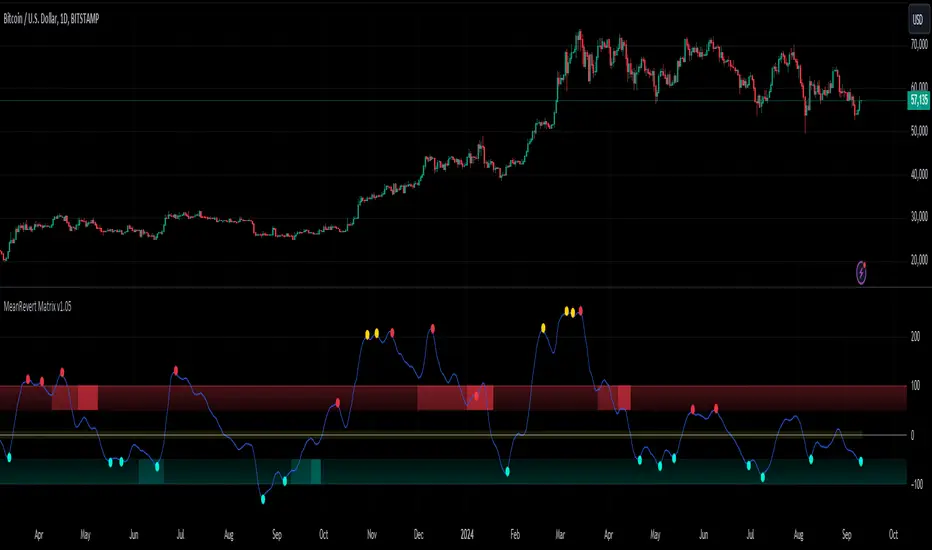
MeanRevert Matrix [StabTrading]MeanRevert Matrix is a sophisticated trading tool designed to detect when prices significantly deviate from their historical averages, signalling potential market trends and reversals.
Leveraging complex algorithms that incorporate human emotions and mean reversion theory, this indicator is the first stage in a comprehensive system for identifying market entry points. Its versatility allows it to be applied across all charts and timeframes, providing traders with clear visual cues for trend analysis and decision-making.
This indicator is purposefully straightforward, allowing traders to observe how the different algorithms work in confluence. The MeanRevert Matrix can be customized to fit individual trading styles, particularly in terms of aggressiveness, making it adaptable to various market conditions. Working in tandem with the FloWave Oscillator, it offers an additional layer of confluence, ensuring that trading signals are more reliable.
💡 Features
Reversal Zones - These zones are integral to the MeanRevert Matrix, highlighting areas where trader emotions and money flow suggest potential longer-term reversals. The lighter shaded zones indicate early-stage reversals, while darker shades signal stronger reversal potential. This feature is designed to help traders anticipate market shifts and prepare for them accordingly.
Localized Mean Reversion Signals - These signals are triggered when the price deviates significantly from the mean, unaffected by longer-term price movements. This localized algorithm helps traders focus on short-term market fluctuations without being influenced by broader trends.
Yellow Signals - These signals identify isolated overbought or oversold conditions. While they often indicate reversal points, they can also signal the beginning of accelerated buying or selling, giving traders early warning of potential market shifts.
Trading Style Customization - The MeanRevert Matrix allows traders to tailor their strategy by adjusting the indicator’s aggressiveness. A more aggressive setting will produce more frequent reversal signals, offering flexibility based on the trader’s risk tolerance and market outlook.
Noise Eliminator - This feature helps traders filter out market noise or manipulation by increasing the noise value. By removing unwanted or misleading signals, it ensures that traders are acting on the most reliable data.
📈 Implementing the System
Step 1 - Begin by observing the localized blue trend to identify reversal points below the mean. Green or red signals within this trend indicate that the price remains within the current market parameters, suggesting that a reversal may occur more quickly. Yellow signals, however, indicate that the trend is likely to continue, so it’s advisable to wait for clearer reversal zones to develop. To avoid misleading signals, consider using higher noise values.
Step 2 - Wait for the reversal zone algorithm to indicate a potential market reversal by showing either light or dark red/green colour. A lighter zone suggests that the overall trend is beginning to reverse, while a darker zone indicates a higher likelihood of reversal.
Step 3 - Once a reversal zone is identified, monitor the trend line for signals that the price is moving significantly away from the mean. This indicates a strong localized price movement that is poised for a reversal. At this stage, you can reduce the noise value and increase the aggressiveness of the trading style to capture more reversal signals.
🛠️ Usage/Practice
In the example above, the indicator is set with neutral aggression for buy signals and lower aggression for sell signals, reflecting the current bull market cycle
Red Reversal Zone - A bearish reversal zone emerges, followed by a darker bearish zone, indicating an increased probability of a trend reversal. The red signals show price reversion from the localized mean, but the absence of yellow signals suggests the reversion isn't abnormally aggressive, making this a good area to consider a short position.
Strong Reversal Opportunity - Similar to point 1, but this time a green signal appears within the bullish dark green zone, highlighting a strong reversal potential. Subsequent red signals suggest opportunities to take profits as the trend faces resistance.
Opportunity to Strengthen Long Position - Once again, the indicator shows a bullish reversal zone without yellow signals. This suggests an area of increased resistance at this price point, offering traders another chance to increase their long positions before the market enters the long bull cycle.
Excessive Buying Pressure - The price has deviated significantly from the mean, triggering a yellow signal. This indicates excessive buying pressure, suggesting the trend is likely to continue upward. Although not an immediate bearish area, the red sell signals suggest it could be a time to conservatively take partial profits.
Trend Weakening - As the trend slows down, bearish zones appear, indicating potential reversal points. As the market shows signs of losing upward momentum, this suggests an opportunity to reduce their long exposure or enter a short trade and take advantage of the correction in the bull cycle.
Potential for Additional Long Position - Despite the earlier sell signals, the overall uptrend remains strong. This presents an opportunity either to add to the long position or to take profits from a previous sell position. The strength of the upward trend suggests that the market may continue higher.
Abnormal Upward Momentum - Similar to points 4 and 5, the yellow signals indicate abnormal price action with aggressive upward momentum. As the trend corrects to a normal range, the price hitting a resistance level is confirmed by the appearance of red reversal zones, suggesting a potential pullback.
Sideways Market Signals - In a sideways market, the indicator shows signals that remain within the normal mean reversion range. These signals are not abnormal and suggest potential entry points for trades within a sideways market, indicating periods where the market lacks strong directional momentum.
🔶 Conclusion
With its seamless integration into various charts and timeframes, the MeanRevert Matrix stands as a reliable and adaptable tool, essential for navigating the complexities of modern markets. By following the implementation guidelines and leveraging its features, traders have the potential to effectively anticipate market movements and optimize their entry and exit points.
We developed this indicator to help traders enhance their understanding of market trends and achieve their trading objectives with greater precision.
Standardized PSAR Oscillator [AlgoAlpha]Enhance your trading experience with the "Standardized PSAR Oscillator" 🪝, a powerful tool that combines the Parabolic Stop and Reverse (PSAR) with standardization techniques to offer more nuanced insights into market trends and potential reversals.
🔑 Key Features:
- 🛠 Customizable PSAR Settings: Adjust the starting point, increment, and maximum values for the PSAR to tailor the indicator to your strategy.
- 📏 Standardization: Smooth out volatility by standardizing the PSAR values using a customizable EMA, making reversals easier to identify.
- 🎨 Dynamic Color-Coding: The oscillator changes colors based on market conditions, helping you quickly spot bullish and bearish trends.
- 🔄 Divergence Detection: Automatic detection of bullish and bearish divergences with customizable sensitivity and confirmation settings.
- 🔔 Alerts: Set up alerts for key events like zero-line crossovers and trend weakening, ensuring you never miss a critical market move.
🚀 How to Use:
✨ Add the Indicator: Add the indicator to favorites by pressing the star icon, adjust the settings to suite your needs.
👀 Monitor Signals: Watch for the automatic plotting of divergences and reversal signals to identify potential market entries and exits.
🔔 Set Alerts: Configure alerts to get notified of key changes without constantly monitoring the charts.
🔍 How It Works:
The Standardized PSAR Oscillator is an advanced trading tool that refines the traditional PSAR (Parabolic Stop and Reverse) indicator by incorporating several key enhancements to improve trend analysis and signal accuracy. The script begins by calculating the PSAR, a widely used indicator known for its effectiveness in identifying trend reversals. To make the PSAR more adaptive and responsive to market conditions, it is standardized using an Exponential Moving Average (EMA) of the high-low range over a user-defined period. This standardization helps to normalize the PSAR values, making them more comparable across different market conditions.
To further enhance signal clarity, the standardized PSAR is then smoothed using a Weighted Moving Average (WMA). This combination of EMA and WMA creates an oscillator that not only captures trend direction but also smooths out market noise, providing a cleaner signal. The oscillator's values are color-coded to visually indicate its position relative to the zero line, with additional emphasis on whether the WMA is rising or falling—this helps traders quickly interpret the trend’s strength and direction.
The oscillator also includes built-in divergence detection by comparing pivot points in price action with those in the oscillator. This feature helps identify potential discrepancies between the price and the oscillator, signaling possible trend reversals. Alerts can be configured for when the oscillator crosses the zero line or when a trend shows signs of weakening, ensuring that traders receive timely notifications to act on emerging opportunities. These combined elements make the Standardized PSAR Oscillator a robust tool for enhancing your trading strategy with more reliable and actionable signals

Intramarket Difference Index StrategyHi Traders !!
The IDI Strategy:
In layman’s terms this strategy compares two indicators across markets and exploits their differences.
note: it is best the two markets are correlated as then we know we are trading a short to long term deviation from both markets' general trend with the assumption both markets will trend again sometime in the future thereby exhausting our trading opportunity.
📍 Import Notes:
This Strategy calculates trade position size independently (i.e. risk per trade is controlled in the user inputs tab), this means that the ‘Order size’ input in the ‘Properties’ tab will have no effect on the strategy. Why ? because this allows us to define custom position size algorithms which we can use to improve our risk management and equity growth over time. Here we have the option to have fixed quantity or fixed percentage of equity ATR (Average True Range) based stops in addition to the turtle trading position size algorithm.
‘Pyramiding’ does not work for this strategy’, similar to the order size input togeling this input will have no effect on the strategy as the strategy explicitly defines the maximum order size to be 1.
This strategy is not perfect, and as of writing of this post I have not traded this algo.
Always take your time to backtests and debug the strategy.
🔷 The IDI Strategy:
By default this strategy pulls data from your current TV chart and then compares it to the base market, be default BINANCE:BTCUSD . The strategy pulls SMA and RSI data from either market (we call this the difference data), standardizes the data (solving the different unit problem across markets) such that it is comparable and then differentiates the data, calling the result of this transformation and difference the Intramarket Difference (ID). The formula for the the ID is
ID = market1_diff_data - market2_diff_data (1)
Where
market(i)_diff_data = diff_data / ATR(j)_market(i)^0.5,
where i = {1, 2} and j = the natural numbers excluding 0
Formula (1) interpretation is the following
When ID > 0: this means the current market outperforms the base market
When ID = 0: Markets are at long run equilibrium
When ID < 0: this means the current market underperforms the base market
To form the strategy we define one of two strategy type’s which are Trend and Mean Revesion respectively.
🔸 Trend Case:
Given the ‘‘Strategy Type’’ is equal to TREND we define a threshold for which if the ID crosses over we go long and if the ID crosses under the negative of the threshold we go short.
The motivating idea is that the ID is an indicator of the two symbols being out of sync, and given we know volatility clustering, momentum and mean reversion of anomalies to be a stylised fact of financial data we can construct a trading premise. Let's first talk more about this premise.
For some markets (cryptocurrency markets - synthetic symbols in TV) the stylised fact of momentum is true, this means that higher momentum is followed by higher momentum, and given we know momentum to be a vector quantity (with magnitude and direction) this momentum can be both positive and negative i.e. when the ID crosses above some threshold we make an assumption it will continue in that direction for some time before executing back to its long run equilibrium of 0 which is a reasonable assumption to make if the market are correlated. For example for the BTCUSD - ETHUSD pair, if the ID > +threshold (inputs for MA and RSI based ID thresholds are found under the ‘‘INTRAMARKET DIFFERENCE INDEX’’ group’), ETHUSD outperforms BTCUSD, we assume the momentum to continue so we go long ETHUSD.
In the standard case we would exit the market when the IDI returns to its long run equilibrium of 0 (for the positive case the ID may return to 0 because ETH’s difference data may have decreased or BTC’s difference data may have increased). However in this strategy we will not define this as our exit condition, why ?
This is because we want to ‘‘let our winners run’’, to achieve this we define a trailing Donchian Channel stop loss (along with a fixed ATR based stop as our volatility proxy). If we were too use the 0 exit the strategy may print a buy signal (ID > +threshold in the simple case, market regimes may be used), return to 0 and then print another buy signal, and this process can loop may times, this high trade frequency means we fail capture the entire market move lowering our profit, furthermore on lower time frames this high trade frequencies mean we pay more transaction costs (due to price slippage, commission and big-ask spread) which means less profit.
By capturing the sum of many momentum moves we are essentially following the trend hence the trend following strategy type.
Here we also print the IDI (with default strategy settings with the MA difference type), we can see that by letting our winners run we may catch many valid momentum moves, that results in a larger final pnl that if we would otherwise exit based on the equilibrium condition(Valid trades are denoted by solid green and red arrows respectively and all other valid trades which occur within the original signal are light green and red small arrows).
another example...
Note: if you would like to plot the IDI separately copy and paste the following code in a new Pine Script indicator template.
indicator("IDI")
// INTRAMARKET INDEX
var string g_idi = "intramarket diffirence index"
ui_index_1 = input.symbol("BINANCE:BTCUSD", title = "Base market", group = g_idi)
// ui_index_2 = input.symbol("BINANCE:ETHUSD", title = "Quote Market", group = g_idi)
type = input.string("MA", title = "Differrencing Series", options = , group = g_idi)
ui_ma_lkb = input.int(24, title = "lookback of ma and volatility scaling constant", group = g_idi)
ui_rsi_lkb = input.int(14, title = "Lookback of RSI", group = g_idi)
ui_atr_lkb = input.int(300, title = "ATR lookback - Normalising value", group = g_idi)
ui_ma_threshold = input.float(5, title = "Threshold of Upward/Downward Trend (MA)", group = g_idi)
ui_rsi_threshold = input.float(20, title = "Threshold of Upward/Downward Trend (RSI)", group = g_idi)
//>>+----------------------------------------------------------------+}
// CUSTOM FUNCTIONS |
//<<+----------------------------------------------------------------+{
// construct UDT (User defined type) containing the IDI (Intramarket Difference Index) source values
// UDT will hold many variables / functions grouped under the UDT
type functions
float Close // close price
float ma // ma of symbol
float rsi // rsi of the asset
float atr // atr of the asset
// the security data
getUDTdata(symbol, malookback, rsilookback, atrlookback) =>
indexHighTF = barstate.isrealtime ? 1 : 0
= request.security(symbol, timeframe = timeframe.period,
expression = [close , // Instentiate UDT variables
ta.sma(close, malookback) ,
ta.rsi(close, rsilookback) ,
ta.atr(atrlookback) ])
data = functions.new(close_, ma_, rsi_, atr_)
data
// Intramerket Difference Index
idi(type, symbol1, malookback, rsilookback, atrlookback, mathreshold, rsithreshold) =>
threshold = float(na)
index1 = getUDTdata(symbol1, malookback, rsilookback, atrlookback)
index2 = getUDTdata(syminfo.tickerid, malookback, rsilookback, atrlookback)
// declare difference variables for both base and quote symbols, conditional on which difference type is selected
var diffindex1 = 0.0, var diffindex2 = 0.0,
// declare Intramarket Difference Index based on series type, note
// if > 0, index 2 outpreforms index 1, buy index 2 (momentum based) until equalibrium
// if < 0, index 2 underpreforms index 1, sell index 1 (momentum based) until equalibrium
// for idi to be valid both series must be stationary and normalised so both series hae he same scale
intramarket_difference = 0.0
if type == "MA"
threshold := mathreshold
diffindex1 := (index1.Close - index1.ma) / math.pow(index1.atr*malookback, 0.5)
diffindex2 := (index2.Close - index2.ma) / math.pow(index2.atr*malookback, 0.5)
intramarket_difference := diffindex2 - diffindex1
else if type == "RSI"
threshold := rsilookback
diffindex1 := index1.rsi
diffindex2 := index2.rsi
intramarket_difference := diffindex2 - diffindex1
//>>+----------------------------------------------------------------+}
// STRATEGY FUNCTIONS CALLS |
//<<+----------------------------------------------------------------+{
// plot the intramarket difference
= idi(type,
ui_index_1,
ui_ma_lkb,
ui_rsi_lkb,
ui_atr_lkb,
ui_ma_threshold,
ui_rsi_threshold)
//>>+----------------------------------------------------------------+}
plot(intramarket_difference, color = color.orange)
hline(type == "MA" ? ui_ma_threshold : ui_rsi_threshold, color = color.green)
hline(type == "MA" ? -ui_ma_threshold : -ui_rsi_threshold, color = color.red)
hline(0)
Note it is possible that after printing a buy the strategy then prints many sell signals before returning to a buy, which again has the same implication (less profit. Potentially because we exit early only for price to continue upwards hence missing the larger "trend"). The image below showcases this cenario and again, by allowing our winner to run we may capture more profit (theoretically).
This should be clear...
🔸 Mean Reversion Case:
We stated prior that mean reversion of anomalies is an standerdies fact of financial data, how can we exploit this ?
We exploit this by normalizing the ID by applying the Ehlers fisher transformation. The transformed data is then assumed to be approximately normally distributed. To form the strategy we employ the same logic as for the z score, if the FT normalized ID > 2.5 (< -2.5) we buy (short). Our exit conditions remain unchanged (fixed ATR stop and trailing Donchian Trailing stop)
🔷 Position Sizing:
If ‘‘Fixed Risk From Initial Balance’’ is toggled true this means we risk a fixed percentage of our initial balance, if false we risk a fixed percentage of our equity (current balance).
Note we also employ a volatility adjusted position sizing formula, the turtle training method which is defined as follows.
Turtle position size = (1/ r * ATR * DV) * C
Where,
r = risk factor coefficient (default is 20)
ATR(j) = risk proxy, over j times steps
DV = Dollar Volatility, where DV = (1/Asset Price) * Capital at Risk
🔷 Risk Management:
Correct money management means we can limit risk and increase reward (theoretically). Here we employ
Max loss and gain per day
Max loss per trade
Max number of consecutive losing trades until trade skip
To read more see the tooltips (info circle).
🔷 Take Profit:
By defualt the script uses a Donchain Channel as a trailing stop and take profit, In addition to this the script defines a fixed ATR stop losses (by defualt, this covers cases where the DC range may be to wide making a fixed ATR stop usefull), ATR take profits however are defined but optional.
ATR SL and TP defined for all trades
🔷 Hurst Regime (Regime Filter):
The Hurst Exponent (H) aims to segment the market into three different states, Trending (H > 0.5), Random Geometric Brownian Motion (H = 0.5) and Mean Reverting / Contrarian (H < 0.5). In my interpretation this can be used as a trend filter that eliminates market noise.
We utilize the trending and mean reverting based states, as extra conditions required for valid trades for both strategy types respectively, in the process increasing our trade entry quality.
🔷 Example model Architecture:
Here is an example of one configuration of this strategy, combining all aspects discussed in this post.
Future Updates
- Automation integration (next update)

HMA Z-Score Probability Indicator by Erika BarkerThis indicator is a modified version of SteverSteves's original work, enhanced by Erika Barker. It visually represents asset price movements in terms of standard deviations from a Hull Moving Average (HMA), commonly known as a Z-Score.
Key Features:
Z-Score Calculation: Measures how many standard deviations the current price is from its HMA.
Hull Moving Average (HMA): This moving average provides a more responsive baseline for Z-Score calculations.
Flexible Display: Offers both area and candlestick visualization options for the Z-Score.
Probability Zones: Color-coded areas showing the statistical likelihood of prices based on their Z-Score.
Dynamic Price Level Labels: Displays actual price levels corresponding to Z-Score values.
Z-Table: An optional table showing the probability of occurrence for different Z-Score ranges.
Standard Deviation Lines: Horizontal lines at each standard deviation level for easy reference.
How It Works:
The indicator calculates the Z-Score by comparing the current price to its HMA and dividing by the standard deviation. This Z-Score is then plotted on a separate pane below the main chart.
Green areas/candles: Indicate prices above the HMA (positive Z-Score)
Red areas/candles: Indicate prices below the HMA (negative Z-Score)
Color-coded zones:
Green: Within 1 standard deviation (high probability)
Yellow: Between 1 and 2 standard deviations (medium probability)
Red: Beyond 2 standard deviations (low probability)
The HMA line (white) shows the trend of the Z-Score itself, offering insight into whether the asset is becoming more or less volatile over time.
Customization Options:
Adjust lookback periods for Z-Score and HMA calculations
Toggle between area and candlestick display
Show/hide probability fills, Z-Table, HMA line, and standard deviation bands
Customize text color and decimal rounding for price levels
Interpretation:
This indicator helps traders identify potential overbought or oversold conditions based on statistical probabilities. Extreme Z-Score values (beyond ±2 or ±3) often suggest a higher likelihood of mean reversion, while consistent Z-Scores in one direction may indicate a strong trend.
By combining the Z-Score with the HMA and probability zones, traders can gain a nuanced understanding of price movements relative to recent trends and their statistical significance.

Ranges and Breakouts [AlgoAlpha]💥 Ranges and Breakouts by AlgoAlpha is a dynamic indicator designed for traders seeking to identify market ranges and capitalize on breakout opportunities. This tool automatically detects ranges based on price action over a specified period, visualizing these ranges with shaded boxes and midlines, making it easy to spot potential breakout scenarios. The indicator includes advanced features such as customizable pivot detection, internal range allowance, and automatic trend color changes for quick market analysis.
Key Features
💹 Dynamic Range Detection : Automatically identifies market ranges using customizable look-back and confirmation periods.
🎯 Breakout Alerts : Get alerted to bullish and bearish breakouts for potential trading opportunities.
📊 Visual Aids : Displays pivot highs/lows within ranges and plots midlines with adjustable styles for easier market trend interpretation.
🔔 Alerts : Signals potential take-profit points based on volatility and moving average crossovers.
🎨 Customizable Appearance : Choose between solid, dashed, or dotted lines for midlines and adjust the colors for bullish and bearish zones.
How to Use
⭐ Add the Indicator : Add the indicator to favorites by pressing the star icon. Adjust the settings like the look-back period, confirmation length, and pivot detection to match your trading strategy.
👀 Monitor the Chart : Watch for new ranges to form, highlighted by shaded boxes on the chart. Midlines and range bounds will appear to help you gauge potential breakout points.
⚡ React to Breakouts : Pay attention to color changes and alert signals for bullish or bearish breakouts. Use these signals to enter or exit trades.
🔔 Set Alerts : Customize alert conditions for new range formations, breakout signals, and take-profit levels to stay on top of market movements without constant monitoring.
How It Works
The indicator detects price ranges by analyzing the highest and lowest prices over a specified period. It confirms a range if these levels remain unchanged for a set number of bars, at which point it visually marks the range with shaded boxes. Pivots are identified within these ranges, and a midline is plotted to help interpret potential breakouts. When price breaks out of these defined ranges, the indicator changes the chart's background color to signal a bullish or bearish trend. Alerts can be set for range formation, breakouts, and take-profit opportunities, helping traders stay proactive in volatile markets.

Machine Learning Support and Resistance [AlgoAlpha]🚀 Elevate Your Trading with Machine Learning Dynamic Support and Resistance!
The Machine Learning Dynamic Support and Resistance by AlgoAlpha leverages advanced machine learning techniques to identify dynamic support and resistance levels on your chart. This tool is designed to help traders spot key price levels where the market might reverse or stall, enhancing your trading strategy with precise, data-driven insights.
Key Features:
🎯 Dynamic Levels: Continuously adjusts support and resistance levels based on real-time price data using a K-means clustering algorithm.
🧠 Machine Learning: Utilizes clustering methods to optimize the identification of significant price zones.
⏳ Configurable Lookback Periods: Customize the training length and confirmation length for better adaptability to different market conditions.
🎨 Visual Clarity: Clearly distinguish bullish and bearish zones with customizable color schemes.
📉 Trailing and Fixed Levels: Option to display both trailing and fixed support/resistance levels for comprehensive analysis.
🚮 Auto-Cleaning: Automatically removes outdated levels after a specified number of bars to keep your chart clean and relevant.
Quick Guide to Using the Machine Learning Dynamic Support and Resistance Indicator
Maximize your trading with this powerful indicator by following these streamlined steps! 🚀✨
🛠 Add the Indicator: Add the indicator to favorites by pressing the star icon. Customize settings like clustering training length, confirmation length, and whether to show trailing or fixed levels to fit your trading style.
📊 Market Analysis: Monitor the dynamic levels to identify potential reversal points. Use these levels to inform entry and exit points, or to set stop losses.
How It Works
This indicator employs a K-means clustering algorithm to dynamically identify key price levels based on the historical price data within a specified lookback window. It starts by initializing three centroids based on the highest, lowest, and an average between the highest and lowest price over the lookback period. The algorithm then iterates through the price data to cluster the prices around these centroids, dynamically adjusting them until they stabilize, representing potential support and resistance levels. These levels are further confirmed based on a separate confirmation length parameter to identify "fixed" levels, which are then drawn as horizontal lines on the chart. The script continuously updates these levels as new data comes in, while also removing older levels to keep the chart clean and relevant, offering traders a clear and adaptive view of market structure.

AutocorrelationWhat is Autocorrelation?
Autocorrelation is a mathematical concept used to measure the degree of similarity between a given time series and a lagged version of itself over successive time intervals. Mathematically, it is the correlation of a signal with a delayed copy of itself as a function of delay. In simpler terms, autocorrelation helps us understand whether and how past values in a time series are related to future values.
Autocorrelation in Finance:
In finance, the autocorrelation is a tool used to analyze the behavior of time series data, such as asset prices or returns. It can reveal "patterns", trends, or cycles within the data.
Price Autocorrelation: When applied to prices, autocorrelations can indicate whether an asset price tends to follow a trend. On price you will typically observe positive autocorrelation because price often exhibits a momentum effect where today's price is positively correlated with past prices. As a result, when prices are trending, they tend to continue in the same direction, creating a positive autocorrelation.
Returns Autocorrelation: Returns on the other hand, generally show less autocorrelation than prices. This is because returns represent the change in prices over time, and in efficient markets, returns are often modeled as a random walk, leading to low or no significant autocorrelation. However, under certain market conditions, you may observe positive or negative autocorrelation in returns. Positive Autocorrelation of returns indicates a trend effect, where past returns can predict future returns. Negative Returns Autocorrelation suggest mean reversion, where large positive returns are often followed by negative returns and vice versa.
Critical Value Analysis:
This indicator comes with critical values based on user-selected confidence levels (90%,95%,99%). It assesses whether the autocorrelation at a particular lag is statistically significant, which is crucial for distinguishing between random noise and meaningful events.
Trading Based on Autocorrelation:
While this indicator was not really developed to be directly used for trading, this indicator is was instead to raise awareness on why you should avoid strategies involving mean reversion on price.

Hullinger Percentile Oscillator [AlgoAlpha]🚀 Introducing the Hullinger Percentile Oscillator by AlgoAlpha! 🚀
This versatile Pine Script™ indicator is designed to help you identify swing trends and potential reversals with precision. Whether you're looking to catch market swings or spot divergences, the Hullinger Percentile Oscillator offers a comprehensive suite of features to enhance your trading strategy.
Key Features
🎯 Customizable Hullinger Settings: Adjust the main length, source, and standard deviation multipliers to fine-tune the indicator to your preferred trading style.
🔄 Dynamic Oscillator Modes: Switch between "Swing" mode for trend identification and "Contrarian" mode for reversal spotting, adapting the indicator to your market view.
📉 Divergence Detection: The indicator includes parameters to control the sensitivity and confirmation of divergence signals, helping to filter out noise and highlight significant market moves.
🌈 Color-Coded Visuals: Easily distinguish between bullish and bearish signals with customizable color settings for a clear visual representation on your chart.
🔔 Alert Integration: Stay ahead of the market with built-in alerts for key conditions, including strong and weak reversals, as well as bullish and bearish swings.
Quick Guide to Using the Hullinger Percentile Oscillator
Maximize your trading edge with the Hullinger Percentile Oscillator by following these steps! 📈✨
🛠 Add the Indicator: Add the indicator to favorites by pressing the star icon ⭐. Customize settings like Main Length, Oscillator Mode, and Appearance to fit your trading needs.
📊 Market Analysis: Use "Swing" mode to track trends and "Contrarian" mode to spot reversals. Watch for divergence signals to catch potential trend changes.
🔔 Alerts: Set up alerts to be notified of significant market movements without constantly monitoring your chart.
How It Works
The Hullinger Percentile Oscillator calculates its signals by applying a modified standard deviation approach to the Hull Moving Average (HMA) of a selected price source. It creates both inner and outer bands based on different multipliers. The oscillator then measures the position of the price relative to these bands, smoothing the result for swing trend detection. Depending on the chosen mode, the oscillator either highlights swing trends or potential reversals. Divergences are detected by comparing recent pivot highs and lows in both price and the oscillator, allowing you to spot bullish or bearish divergence setups. Alerts are triggered based on key crossovers or when specific conditions are met, ensuring that you are always informed of crucial market developments.

Hullinger Bands [AlgoAlpha]🎯 Introducing the Hullinger Bands Indicator ! 🎯
Maximize your trading precision with the Hullinger Bands , an advanced tool that combines the strengths of Hull Moving Averages and Bollinger Bands for a robust trading strategy. This indicator is designed to give traders clear and actionable signals, helping you identify trend changes and optimize entry and exit points with confidence.
✨ Key Features :
📊 Dual-Length Settings : Customize your main and TP signal lengths to fit your trading style.
🎯 Enhanced Band Accuracy : The indicator uses a modified standard deviation calculation for more reliable volatility measures.
🟢🔴 Color-Coded Signals : Easily spot bullish and bearish conditions with customizable color settings.
💡 Dynamic Alerts : Get notified for trend changes and TP signals with built-in alert conditions.
🚀 Quick Guide to Using Hullinger Bands
1. ⭐ Add the Indicator : Add the indicator to favorites by pressing the star icon. Adjust the settings to align with your trading preferences, such as length and multiplier values.
2. 🔍 Analyze Readings : Observe the color-coded bands for real-time insights into market conditions. When price is closer to the upper bands it suggests an overbought market and vice versa if price is closer to the lower bands. Price being above or below the basis can be a trend indicator.
3. 🔔 Set Alerts : Activate alerts for bullish/bearish trends and TP signals, ensuring you never miss a crucial market movement.
🔍 How It Works
The Hullinger Bands indicator calculates a central line (basis) using a simple moving average, while the upper and lower bands are derived from a modified standard deviation of price movements. Unlike the traditional Bollinger Bands, the standard deviation in the Hullinger bands uses the Hull Moving Average instead of the Simple Moving Average to calculate the average variance for standard deviation calculations, this give the modified standard deviation output "memory" and the bands can be observed expanding even after the price has started consolidating, this can identify when the trend has exhausted better as the distance between the price and the bands is more apparent. The color of the bands changes dynamically, based on the proximity of the closing price to the bands, providing instant visual cues for market sentiment. The indicator also plots TP signals when price crosses these bands, allowing traders to make informed decisions. Additionally, alerts are configured to notify you of crucial market shifts, ensuring you stay ahead of the curve.

Predictive Order Blocks [CryptoSea]The Predictive Order Blocks Indicator is a unique and innovative tool that enhances market analysis by identifying support and resistance blocks based on standard deviations from a median line. Unlike traditional indicators that rely solely on the close price, this indicator leverages the median line and standard deviations to form areas of interest, rather than targeting a single price point. This approach provides a more accurate representation of market structure, especially during periods of consolidation and expansion.
Key Features
Multi-Term Length Analysis: The indicator offers short, medium, and long-term settings, allowing traders to customise the analysis based on their preferred trading strategy and timeframe. This flexibility ensures that the tool is adaptable to various market conditions and trading styles.
Standard Deviation-Based Order Blocks: The core functionality of the indicator revolves around calculating standard deviations from a median line to form support and resistance blocks. These blocks provide a clearer and more reliable picture of market structure compared to single-point levels. By focusing on areas rather than exact price levels, the indicator helps traders identify zones where price is likely to react, leading to more informed trading decisions.
Dynamic Box Creation: The indicator dynamically creates breakout boxes based on user-selected standard deviation ranges. These boxes are formed at the start of market expansion following periods of consolidation. This feature is particularly useful because it highlights key levels where price is likely to retrace after breaking out, providing traders with actionable insights during market transitions.
Proximity-Based Gradient Colors: The indicator features gradient colors that change based on the price's proximity to the standard deviation bands. This visual aid helps traders quickly assess the current market condition and the potential significance of the support and resistance blocks.
Adaptive Display Options: To accommodate different trading preferences, the indicator includes options to toggle the display of the trend line (median line) and the standard deviation bands. This flexibility allows traders to customise their chart view to match their analysis style, whether they prefer a more clutter-free view or a detailed breakdown of market levels.
In the example below, the indicator shows the bands compressing during a period of consolidation, highlighting the potential for a breakout.
How it Works
Median Line Calculation: The indicator calculates the median line using a user-defined period. This line serves as the central reference point from which the standard deviations are calculated. By using the median line instead of just the close price, the indicator provides a more stable and reliable baseline for identifying support and resistance areas.
Standard Deviation Bands: Around the median line, the indicator calculates multiple standard deviation bands. These bands represent areas where price is statistically likely to find support or resistance. By focusing on these areas, traders can better anticipate where price might react, rather than relying on arbitrary levels.
Dynamic Box Creation and Expansion Detection: The indicator monitors the compression and expansion of the standard deviation bands. During periods of low volatility (squeeze), the bands compress, indicating consolidation. Once the bands start expanding, it signals the potential for a breakout. At this point, the indicator dynamically creates predictive order blocks based on the selected standard deviation range. These blocks highlight key levels where price might retrace or react, providing traders with valuable entry and exit points.
Color-Coded Proximity Alerts: To further enhance usability, the indicator uses color gradients to indicate how close the current price is to the calculated bands. This visual representation helps traders quickly assess the potential significance of the price's current position relative to the support and resistance areas.
In the example below, the indicator shows the bands expanding with the price, triggering the formation of the predictive order block.
In the final example, the price retraces into the order block before bouncing back to the upside, demonstrating the effectiveness of the identified support area.
Alerts
Trend Line Alerts: The indicator provides alerts when the price crosses above or below the trend line (median line). This feature is crucial for traders looking to identify potential trend changes early, allowing them to act quickly on emerging opportunities.
Band Alerts: Alerts are also triggered when the price crosses above or below the upper or lower bands for each standard deviation level. This helps traders identify potential breakout or breakdown scenarios, ensuring they are notified of significant market movements as they happen.
Customisable Alert Conditions: To cater to different trading strategies, the indicator allows users to set alert conditions for each standard deviation band and the trend line. This level of customisation ensures that traders receive alerts that are relevant to their specific trading style and market analysis.
Application
Strategic Decision-Making: The Predictive Order Blocks Indicator assists traders in making informed decisions by providing detailed analysis of potential breakout zones. By identifying key support and resistance areas, the indicator helps traders plan their entries and exits with greater precision.
Trend Confirmation: The indicator reinforces trading strategies by identifying key levels where price is likely to react. This confirmation is crucial for traders looking to enter trades with higher confidence.
Customized Analysis: The indicator adapts to various trading styles with extensive input settings that control the display and calculation of order blocks. Whether you're a day trader, swing trader, or long-term investor, the indicator can be tailored to meet your specific needs.
Visual Clarity: With customizable color settings and display options, the indicator enhances chart readability, allowing traders to quickly and easily interpret market data.
The Predictive Order Blocks Indicator by CryptoSea is an invaluable addition to a trader's toolkit, offering depth and precision in market trend analysis to navigate complex market conditions effectively.

Machine Learning Adaptive SuperTrend [AlgoAlpha]📈🤖 Machine Learning Adaptive SuperTrend - Take Your Trading to the Next Level! 🚀✨
Introducing the Machine Learning Adaptive SuperTrend , an advanced trading indicator designed to adapt to market volatility dynamically using machine learning techniques. This indicator employs k-means clustering to categorize market volatility into high, medium, and low levels, enhancing the traditional SuperTrend strategy. Perfect for traders who want an edge in identifying trend shifts and market conditions.
What is K-Means Clustering and How It Works
K-means clustering is a machine learning algorithm that partitions data into distinct groups based on similarity. In this indicator, the algorithm analyzes ATR (Average True Range) values to classify volatility into three clusters: high, medium, and low. The algorithm iterates to optimize the centroids of these clusters, ensuring accurate volatility classification.
Key Features
🎨 Customizable Appearance: Adjust colors for bullish and bearish trends.
🔧 Flexible Settings: Configure ATR length, SuperTrend factor, and initial volatility guesses.
📊 Volatility Classification: Uses k-means clustering to adapt to market conditions.
📈 Dynamic SuperTrend Calculation: Applies the classified volatility level to the SuperTrend calculation.
🔔 Alerts: Set alerts for trend shifts and volatility changes.
📋 Data Table Display: View cluster details and current volatility on the chart.
Quick Guide to Using the Machine Learning Adaptive SuperTrend Indicator
🛠 Add the Indicator: Add the indicator to favorites by pressing the star icon. Customize settings like ATR length, SuperTrend factor, and volatility percentiles to fit your trading style.
📊 Market Analysis: Observe the color changes and SuperTrend line for trend reversals. Use the data table to monitor volatility clusters.
🔔 Alerts: Enable notifications for trend shifts and volatility changes to seize trading opportunities without constant chart monitoring.
How It Works
The indicator begins by calculating the ATR values over a specified training period to assess market volatility. Initial guesses for high, medium, and low volatility percentiles are inputted. The k-means clustering algorithm then iterates to classify the ATR values into three clusters. This classification helps in determining the appropriate volatility level to apply to the SuperTrend calculation. As the market evolves, the indicator dynamically adjusts, providing real-time trend and volatility insights. The indicator also incorporates a data table displaying cluster centroids, sizes, and the current volatility level, aiding traders in making informed decisions.
Add the Machine Learning Adaptive SuperTrend to your TradingView charts today and experience a smarter way to trade! 🌟📊
