EMA ExtendedThe general idea behind the indicator is that when price is extended away from an EMA (usually the 50 EMA for the Market Maker strategy), it usually comes back to it. When monitoring many assets or cryptocurrencies, this indicator (with Alerts) provides ease of mind to spot such opportunities across the board.
This indicator uses an EMA and the current price (candle's High and Low) to signal 'Long' or 'Short' when price is extended away from the EMA with a specific ratio. The signal is in the form of an arrow that appears above the candle to be Shorted, or below the candle to be Longed. Those signals are also exported to the Alerts system so you can choose to trigger alerts (preferably "Once Per Bar").
All features are configurable from the indicator's settings.
Example: 'Long' signal if price is extended 0.78% below the 50 EMA , or 'Short' signal if price is extended 5.2% above the 50 EMA .
I plan to expand on this indicator to support MAs, as well as the potential to include multi-conditions (AND/OR) of two different EMAs/MAs (eg. 'Short' signal if price is 8% above 50 EMA and 20% above 200 MA).
If you have suggestions or questions, you can message me or leave a comment.
Marketmaker

Market Maker Volatility Diameter V2 by Hawkeye Charting***German Description below***
Hey guys,
we are proud to publish the Market Maker Volatility Diameter V2!
Our goal with this indicator is to provide an All-in-one indicator, combining some special tools of open source scripts as well as some of our own developments and the algorithm of our MMVD V1.
We will create a video series very soon, where we will explain each aspect of the tool, your options and of course our trading strategies with this indicator.
You have the following technical tools and information combined in this indicator, which can each be shown and hidden:
- Psychological Ranges (Weekly Opening High/ Low for Crypto and Forex)
- Market Maker Sessions (Sydney, Asia, London, NY)
- Trade Cloud (algorithm developed by Hawkeye Charting)
- Fibonacci Cloud (inspired by watching paid offerings, coded by Hawkeye Charting)
- Display Moving Averages (select the visualization of up to 6 moving averages. You can change for each of these 6 MA's the type and the length.)
- Display Major Trend Cloud (developed by Hawkeye Charting)
- PVSRA Candle Colors
- Vector Candle Zones
- Pivots
- Pivot Fibonacci Levels (developed by Hawkeye Charting)
- OHLC-Levels
- Average Daily, Weekly, Monthly Ranges
- Volume Profile for Intraday Trading for up to 8 days.
We hope especially for people, who can not afford the Pro offering from TradingView, to give access to a good indicator, which includes many tools and alerts.
Our goal is to lower the barriers for new entrants and of course to protect people, to pay for indicators, which are completely insane priced.
Only, that you get an idea: the whole indicator has only cost me about 100 h of work (for a single person!), and I'm no Pine script expert, so don't get fooled when someone offers you insane amounts for an indicator...
There is no holy grail. Each indicator works only with calculations on previous data.
We appreciate seeing that you guys like this work, so please leave a like and a follow and share this indicator.
*****German Description*****
Hey Leute,
wir sind stolz, unsere 2. Version des Market Maker Volatility Diameter zu veröffentlichen!
Unser Ziel ist es, mit diesem Indikator eine All-In-One Lösung anzubieten, welche einige nicht ganz geläufige Tools sowie unsere eigenen Entwicklungen und natürlich den Algorithmus des MMVD V1 vereinen.
Wir werden in naher Zukunft eine Video Serie veröffentlichen, in welcher wir Stück für Stück jeden Aspekt des Werkzeugs, die Einstellungsmöglichkeiten sowie unsere Trading Strategien mit diesem Indikator erklären werden.
Ihr habt die folgenden technischen Werkzeuge und Informationen in diesem Indikator vereint, welche jede einzeln an- oder abgewählt und eingestellt werden können:
- Psychological Ranges (Weekly Opening High/ Low für Krypto and Forex)
- Market Maker Sessions (Sydney, Asia, London, NY)
- Trade Cloud (Algorithmus von Hawkeye Charting entwickelt)
- Fibonacci Cloud (inspiriert von der Beobachtung eines Paid-Indikators, Code geschrieben von Hawkeye Charting)
- Moving Averages (Ihr könnt die Darstellung von bis zu 6 Gleitenden Durchschnitten auswählen und für jeden dieser Durchschnitte den Typ und die Länge ändern.)
- Display Major Trend Cloud (entwickelt von Hawkeye Charting)
- PVSRA Candle Colors
- Vector Candle Zones
- Pivots
- Pivot Fibonacci Levels (entwickelt von Hawkeye Charting)
- OHLC-Levels
- Average Daily, Weekly, Monthly Ranges
- Volume Profile für Intraday Trading, Darstellungsmöglichkeit für 3-8 Tage
Wir hoffen, dass wir speziell für Leute, die sich nicht das PRO-Abo aufwärts von TradingView leisten können, Zugang zu einem guten Indikator, welche viele Werkzeuge und Alarme vereint gewährleisten zu können.
Unser Ziel ist es, die Eintrittsbarrieren für neue Marktteilnehmer senken und natürlich Leute vor wahnsinnigen Paid-Angeboten beschützen zu können.
Nur, damit ihr eine Vorstellung bekommt: den gesamten Indikator hat mich lediglich 100h Arbeit gekostet (für eine einzelne Person!), und ich bin kein Pine Script Experte. Also lasst euch bitte nicht verar******, wenn euch Paid-Angebote erreichen, mit dem Versprechen, den "zu 95% erfolgreich" Indikator erwerben zu können.
Es gibt keinen heiligen Gral, jeder Indikator arbeitet nur mit Berechnung von Vergangenheitswerten.
Wir würden uns riesig freuen, wenn euch diese Arbeit gefällt und ihr uns Likes und Follows hinterlasst und ihr diesen Indikator teilt.

Market Maker Indicator V2 [tecnocrypto]This indicator is based on the idea that prices are generated by the interaction between a Market Maker on one side (sometimes also called the "Composite Man") and Retail Traders on the other side (Retail Traders include simple retail, professional traders, whales, institutions...as a single entity). These two opposite entities "play" the trading game on trading platforms/exchanges (crypto), which are neutral to the game.
Market makers are liquidity providers, and make profits either by charging a spread between buy and sell prices, and (also) by trapping retail traders into specific positions.
Trading is a "zero sum" game in the sense that it generates a transfer of resources between these two specific players, which are indeed the Market Maker and Retail Traders. If Retail Traders are in profit, Market Maker is (temporarily) in loss, and viceversa. Market Maker goal is to squeeze profits out of Retail Traders, by inducing them to take wrong positions.
The Market Maker Method Indicator executes the following:
1) Identifies and plots candles that are generated by the Market Maker's moves (called "Shift Candles"); shift candles are "artificial" price/volumes moves, generated to induce retail traders into specific zones which are, essentially, traps. They are called Shift Candles as they generate abnormal (and mostly unexpected) price movements in either direction. They move the price from one zone to the next to execute the Market Maker strategy. Observe how often sudden (apparent) prices increases are followed by price crashes (stop hunt rise, drop); and observe how often sudden (apparent) price collapses are followed by price uptrends (stop hunt low, rise); sometimes these movements are made in progressive steps (generally, 3).
2) Plots open long/open short alerts based on the assumption that when Market Maker plots upwards shift candles, vivid green color, they are preparing for an upcoming price reversal (down); same, but opposite sign, for downwards shift candles. This is a counterintuitive logic for Retail Traders, that generally open long when price is rising, and open shorts when price is falling - jumping into Market Makers traps.
3) Plots the areas where price is expected to return (upwards or downwards) based on previous shift candles (called "Recovery Zones")
You can use this indicator on any timeframe and for any asset.
The Market Maker indicator V2 provides long / short entry signals based upon the market maker manipulative moves described above.
Long alerts are triggered by manipulative price push-downs by the marker maker, which will be followed by price increases (while price was decreasing, market maker was purchasing from retail). Additional factors are taken into consideration to plot long entry signals, , mainly volume build up and mean reversion, around this basic concept.
Short alerts are triggered by manipulative price push-ups by the marker maker, which will be followed by price drops (while price was increasing, market maker was selling to retail). Additional factors are taken into consideration to plot short entry signals, mainly volume build up and mean reversion, around this basic concept.
The indicator is based on the Traders Reality indicator, but improved with alerts, that can be used with trading bots, and additional possibilities to customize the behavior of the indicator.
A strategy associated with this indicator is also available.
Best results on the 1H timeframe.
Contact me for further info.
[DisDev] Level by LevelThis indicator's main objective is to provide you with the ability to chose the levels you are interested in , with the added functions of:
Level-by-Level Chart Reducer – This allows you to choose how many levels are above and below the current closing price to display.
Level-by-Level Table – This allows you to display all the levels within a table onto the chart.
The basis of this indicator is to provide you with a toolbox of levels that you can add to your trading plans.
Psychological Levels
A weekly range established each Saturday evening that can be thought of as a weekly "IB" or initial balance.
Average Daily Range ("ADR") & Average Weekly Range ("AWR")
In Forex, the International Monetary Fund ("IMF") controls the allowable weekly swings of a currency's price. The "AWR" and "ADR" perform calculations and dynamically adjust until the range is exceeded, at which time the levels will lock into place for the remainder of the day or week. The accepted theory is that price (even in Stocks and Crypto) will adhere to and remain within these levels, and, if exceeded, will revert back to them.
Initial Balance ("IB")
In Crypto trading, it is generally accepted that the High and Low of the first hour of each day (00:00 - 01:00 UTC) is the Initial Balance . The IB generally thought of as a zone that sets the tone for the rest of the trading session. It is often a time of high volume and volatility, with Stop Hunts at the highs and lows of a range before price moves in one direction or the other. The IB is a Market Profile concept introduced by Peter Steidlmayer. There is plenty of information on the Internet to learn more about IB's and how to implement them -- please do your own research.
Daily Open
Since Crypto is traded 24 hours per day, the generally accepted open is 00:00 UTC, the Tokyo open. Please refer to Part 1 for more details on sessions, starting times, conversions, and Daylight Savings Time.
Volume Weighted Average Price (VWAP's)
VWAPs are important areas on a chart. Institutional traders generally do not want to move price too far as they enter large buy or sell orders. So they wait for price to reach a tight zone around the VWAP where the majority of transactions occur on the Daily, Weekly, or Monthly timeframes. In these areas, there will be plenty of supply and demand for the institutional trader to execute their trades.
Weekly Open
The weekly open is Monday at 00:00 UTC.
Pivot Points (Support & Resistance)
This indicator calculates pivot levels based on a tested formula that calculates past and subsequent bars or candles. It displays the two closest to price pivot levels. The pivot formula takes a window of left bars and right bars, and then finds the highest or lowest value in that window. The window marches across the bar-set to discover the pivots.
We coded the script to label the levels and colors dynamically, either Support (Green) or Resistance (Red), depending on whether they are above or below price. The primary level line stays with the same color scheme:
Blue = Daily / Yellow = Weekly / Violet = Monthly
As price crosses the level:
1 - The label will switch from Support to Resistance and Resistance to Support
2 - The extender line will switch from Green to Red and Red to Green
3 - The same changes will take place in the Level-by-Level Coordinates Table
A Note on Levels and Data
Understanding How Data is Calculated and Presented
Calculating levels requires going back in time through a symbol or asset’s historical data. Time is measured by bars (candles), so depending on the chart's resolution (timeframe or TF) you are viewing, a different number of bars would be required to measure the same level.
For example, if we want to mark the Daily High and Low on the daily TF, we would be measuring 1 bar or candle. If we drop down to the 1-hour TF, we would need to measure 24 bars. For the 15-Minute TF it would be 96 bars (1hr/15min=4 bars per/hour and 4 x 24 = 96), and on the 1-Min TF, it requires 1,440 bars (1hr=60 Min and 6 x 24 = 1,440).
Hopefully, you get the idea and can see that the number of bars required increases exponentially as we move to weekly, monthly, and yearly levels.
TradingView Data
Please note this statement from TradingView's website:
"The length of historical data for any intraday interval (i.e. chart timeframe) is 5,000 bars/candles (for Pro and Pro+ account holders it is doubled to 10,000 bars/candles and for Premium holders it's quadrupled to 20,000) + additionally several bars/candles back to the beginning of the week, month or year (depending on the resolution). Unfortunately, this limit cannot be extended for now due to technical reasons. At lower resolutions (<30Min) Yearly and Monthly VWAPs may not show, but to overcome this issue the “Plot Save” function has been added to the settings to allow the user to manually input these levels. This concept is the same for Daily, Weekly, and Monthly pivots.
If you change the chart interval to daily or daily-based, you will see a longer date range. We display all available data for daily-based intervals."
How we Handled Data Limitations
The Plot Level Feature in the Level by Level Indicator
We have written this script to always show levels at the lowest time frame allowable by TradingView.
If you do not see specific Support or Resistance levels, switch to a higher time frame, enter the corresponding values in the provided fields on the input panel, and check the Plot box. This will hard code the level in and will print on any TF. Additionally, we coded it so that when the Plot feature is enacted, the calculated level will be disabled so that there are no overlaps of two levels being printed.
Legend
The logic behind the line styles:
Solid = Static or established
Dashed = Static but previous week or day
Dotted = Dynamic or still developing -- will turn solid once the values are locked in
*VWAPs would technically be a dotted line since they are fluid, however, TV does not handle the dots or dashes of a curved line well so we chose to keep this solid
Level-by-Level Table
We designed this table to provide the user with a view of the levels in the correct price sequence on the chart at all times since, depending on the resolution and zoom levels, it would typically not be possible. The levels are equidistant and do not align with the actual price.
The current price will move vertically through the table according to the actual price and its relative position to the other various levels. The levels will change price and line styles dynamically as well.
The current price rectangle and the border can be in sync with High Volume Candle colors to draw more attention to the chart during climatic volume events.
Settings & Options - Levels & Labels
Levels will show a faint line through price to the point of origin.
Labels will show a brighter line extended to the right of price.
The values (10, 20, 30) are the length of the extensions; they are staggered to avoid overlaps.
Settings & Options - Level Reducer
The Level Reducer gives you the ability to declutter your chart, but still have the indicator track all the selected levels.
With four Lines selected, for example, the indicator will give you the nearest four lines above price and the nearest four below price. The Table runs independently of the chart, so if you want to see eight levels as an example, the Table will show eight above and eight below price.
As the current price changes, the lines will dynamically change accordingly.

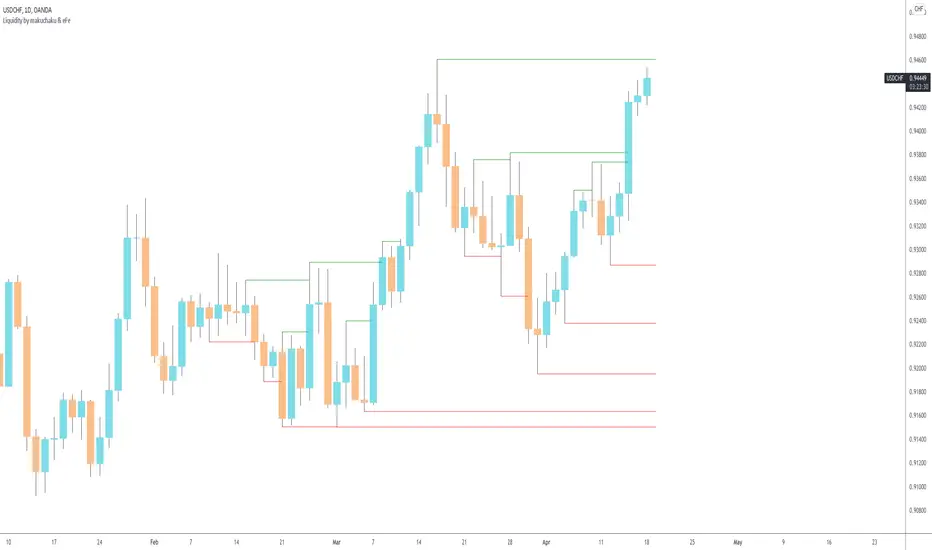
Makuchaku's trading tools - Liquidity visualizerThis indicator plots those pivots/fractals which have not been taken out by price, whereby showing where are the clusters of highs/lows where stop orders (or liquidity) could be hiding.
This is a fantastic tool for taking reversal trades.
MarketMaker Method [ShiftCandles]This indicator is based on the idea that prices are generated by the interaction between a Market Maker on one side (sometimes also called the "Composite Man") and Retail Traders on the other side (Retail Traders include simple retail, professional traders, whales, institutions...as a single entity).
These two opposite entities "play" the trading game on trading platforms/exchanges (crypto), which are neutral to the game.
Market makers are liquidity providers, and make profits either by charging a spread between buy and sell prices, and (also) by trapping retail traders into specific positions.
Trading is a "zero sum" game in the sense that it generates a transfer of resources between these two specific players, which are indeed the Market Maker and Retail Traders. If Retail Traders are in profit, Market Maker is (temporarily) in loss, and viceversa. Market Maker goal is to squeeze profits out of Retail Traders, by inducing them to take wrong positions.
The Market Maker Method Indicator executes the following:
1) Identifies and plots candles that are generated by the Market Maker's moves (called "Shift Candles"); shift candles are "artificial" price/volumes moves, generated to induce retail traders into specific zones which are, essentially, traps. They are called Shift Candles as they generate abnormal (and mostly unexpected) price movements in either direction. They move the price from one zone to the next to execute the Market Maker strategy. Observe how often sudden (apparent) prices increases are followed by price crashes (stop hunt rise, drop); and observe how often sudden (apparent) price collapses are followed by price uptrends (stop hunt low, rise); sometimes these movements are made in progressive steps (generally, 3).
2) Fires open long/open short alerts based on the assumption that when Market Maker plots upwards shift candles, vivid green color, they are preparing for an upcoming price reversal (down); same, but opposite sign, for downwards shift candles. This is a counterintuitive logic for Retail Traders, that generally open long when price is rising, and open shorts when price is falling - jumping into Market Makers traps.
3) Plots the areas where price is expected to return (upwards or downwards) based on previous shift candles (called "Recovery Zones")
The script will be further developed to prevent early open long/open short alerts, trying to catch the Market Makers cycles in a more detailed way (to account for situations where artificial price moves are executed in consecutive steps, instead of single candles).
You can use this indicator on any timeframe and for any asset.
You can connect the open long/open short alerts to trading bots to execute automatic trades.
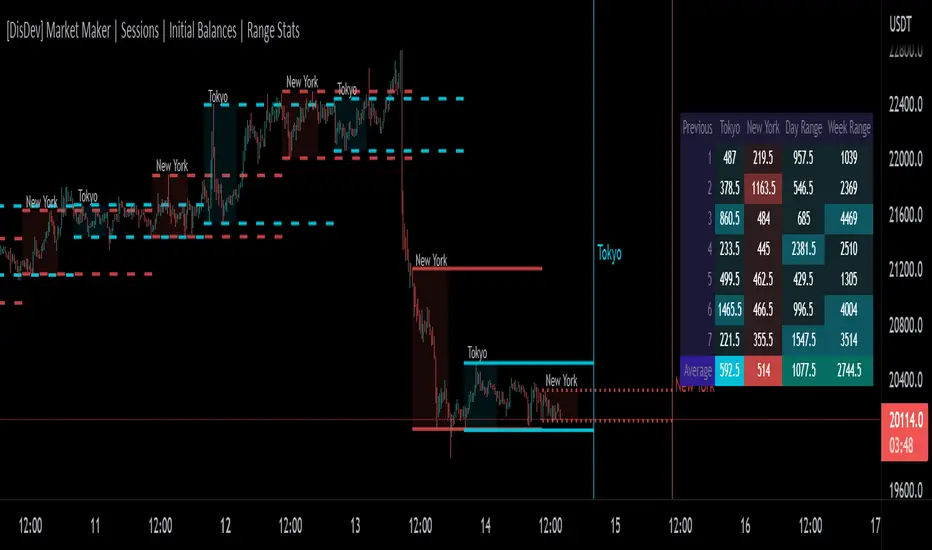
[DisDev] Market Maker | Sessions | Initial Balance | Range StatsThis indicator has two main components: Time-Specific Sessions and High/Low Statistics . There are also several subcomponents: Day of Week Separators, Specific Session High/Low Extenders, Day Range Statistics, Week Range Statistics, User Input Session Titles, etc.
Each component is explained and demonstrated how it could be utilized as a trading tool.
The basis of this indicator is to analyze session-specific price movements through automatic display and statistics.
Key:
Dotted lines = Developing Session
Solid Line = Session complete
Dashed lines = Past Session
1) The primary function is the five manual time-session inputs. These sessions could be based on a full market period, such as London Open to Close (0800 UTC to 1630 UTC), the Initial Balance of the day (0000 UTC to 0100 UTC), or a session Initial Balance New York (1430 UTC to 1530 UTC). The user can update settings input text to reflect this on the chart.
The following shows the example noted above, with the added subcomponents of:
• Shaded areas to define each session
• Extension of the Sessions highs and lows (extension 24/48/72-hour options)
• Future line projection (provides a reminder of when the market opens)
This allows you to see potential levels of resistance and support and market open volatility.
The below example shows the input sessions configured for five Session Initial Balances. You can see that the Sessions Initial Balances were in a tight price range. A range breakout occurred with price move of $1400 visualized.
2) The secondary function is the Range statistics. Range statistics can be used to track the volatility of each session, day or week and can be selected for up to 31 days. This helps the user to determine overbought or oversold conditions as well as pattern recognition.
Trade Example 1
Settings: New York Session Open to Session Close.
The colored boxes are manually drawn to emphasize how the New York Lows and Highs can act as a confluence for support and resistance areas.
Trade Example 2a
Settings: London Session Open to Session Close and New York Session Open to Session Close.
This chart shows how the Session Open (in this case, the New York Open) reminder notifies you that there could be volatility when a new session opens.
Trade Example 2b
Notice how price breaks to the upside at the opening of the New York session. In this instance it was a $2,250 or 5.17% increase in the opening hour.
3. Once London closes New York has control of the market; one push-up stops out the shorts that placed stop losses at the London high, then brings price back down to the mean.
By having the reminder lines and shaded sessions, the user is prepared and can anticipate some price reaction, often a reversal if price has been steadily moving in one direction.
[DisDev] Market Maker - High Volume RecoveryThis indicator has many components; below, each component is explained and how it can be used as a trading tool.
The indicator analyzes past volume movements, allowing you to visualize selected volume percentages above and below candles and to visualize live recovery of High-Volume Candles.
1) The High-Volume Candles project to the current time to show how much of the High-Volume Candle has been recovered and how much remains unrecovered.
a. The indicator can be customized to a user-defined volume percentage; this allows you to focus on candles with volume over a given percentage (e.g., 500%.)
b. You can customize the candle colors and volume percentage thresholds.
2) You can select the option to display percentages above the candles, allowing you to research and back-test theories.
a. For example, the chart below shows High-Volume Candles above 500%. Throughout 2021, 92% of the 500%-plus candles have been recovered, leaving only four high volume zones yet to be recovered, one below and three above the current price.
For a further breakdown of the statistics click on the below chart image.
3) There is also the option to show the volume percentage within the unrecovered High-Volume Zone.
a. This allows you to instantly assess how strong the price movement was of that particular High-Volume Zone.
4) Lookback periods can also be adjusted to fine-tune the indicator.
Below is the indicator in full operation.
DISCLAIMER
When pressing the play button in the chart above it does not display the recovery. A TV "HOW TO" idea will be published soon, to demonstrate the indicator in full action or for more info please read "Author's instructions".

[DisDev] Market Maker | Technical Time AnalysisThis indicator has three main components: Days of Week Separators , User-Customized Reminder Notes , and Projected Lines . Each component is explained and demonstrated how it could be used as a trading tool.
The basis of this indicator is to analyze past price movements and then project them as a reminder for traders that previously, at that particular time, there was a price increase/decrease.
1) Vertical lines and labels separate days of the week.
a. The vertical lines allow you to quickly see what day of the week the price movement occurred. For example, if a notable price move happens on Monday, you can use the “Reminder Notes” input to enter a note directly on the chart, as explained below.
b. You can select different colors and styles for the lines or background.
2) Vertical lines can be customized to be displayed in the past and future.
a. This allows you to select a specific time when price has increased/decreased, see how often this has occurred, then notate it as a reminder in the future.
3) User-customized reminder notes for future projected lines.
a. This allows you to input notes to be displayed with the future projected lines.
b. Example: You notice that at 06:45, there had previously been significant price action. Your notes can be updated directly on the chart to remind you of them just before 06:45 on the following days.
Below is the indicator in full use.
You can adjust each line's style, width, color, and reminder notes.

[DisDev] 12 Candle|Round#|Future SessionsThis indicator has many components; below, each component is explained and how it can be used as a trading tool.
1) Future Lines
a. Vertical lines are projected into the future to mark the beginning of each of the three major markets, Tokyo, London, and New York.
b. When major markets open, this can cause an increase in price action. So this component provides the trader with a reminder of when the next major market opens.
c. Also, the days of the week are displayed to allow the user to backtest price reaction for certain days of the week easily (e.g., Major Markets reopening after the weekend).
2) 12 Hour Candle Sessions High and Low
a. As price intersects with the beginning of the session, the vertical line disappears, and two corresponding horizontal lines begin. These horizontal lines dynamically adjust to mark each session's high and low, and a semi-transparent box fills the space between the high and low lines.
b. The duration of each session is a three-hour window, which each consists of 12 Fifteen-Minute Candles. This marks the hour prior to equity markets open, the opening hour, and the post-open hour.
c. The sessions highs and lows can be selected within the settings show for a 24 hour period. This assists the trader with session range breakouts; three examples of how this could be traded are below.
Example 1
d. The Tokyo and London session high kept the price action within a range. Once it broke the range, the Tokyo and London session highs were used as support, resulting in a range breakout.
Example 2
e. The below picture shows price action failing to break London Session Low and New York Session High; this is followed by Tokyo Low acting as resistance and price moving down 9%.
Example 3
f. Below price action with an increased volume of 323% (based on the average of the last 10 bar) fails to break the Tokyo High on the 1st attempt. The second attempt fails on 241% volume. The third attempt at 475% breaks the range, completing the range breakout seeing a move of 3.4% in price.
4) High of Day (HOD) and Low of Day (LOD)
a. As the trading day unfolds, we mark the HOD (d-High) and LOD (d-Low) with blue dotted horizontal lines. Then at the start of the next trading day, the former High and Low become the Previous Day High (pd-High) and Low (pd-Low) and are changed to dashes.
b. These high and low levels add extra confluence with the session high and lows for Swing Failure Patterns (SFP) and confirmation of trends.
5) Round Numbers
a. As humans, it's hard to use just any number to make sense of things. We prefer to use round numbers. This is important for trading as many traders will automatically use round numbers as their stop losses.
b. This indicator component reminds users of this fact and displays round numbers such as 00, 25, 50, and 75. The indicator automatically calculates and displays lines for the round numbers for as many as twelve levels above and below the current price.
c. Below are examples of how round numbers are broken to trigger stop losses; you may want to break the habit of using round numbers as your stop losses.
Below is the indicator in full swing, displaying all the elements described above.

Imbalance, ADR Daily Target & ADR > 3X1 x ADR Movement Calculated on the Asian Session - Times can be altered to suit your parameters
Daily Target is set High from low of Asian Range and Low from High of Asian Range
0-3X ADR Calculated and Displayed from a point you select for the following days targets - can be set Bearish or Bullish and ADR parameters can be altered
Imbalance Finder - Can be switched on or off to show imbalance on current time frame - default is off

Spread InformerThe goal of this study is to produce information about the average size of candles in the given time frame. This can be used to help dial in your market making bot spreads.

PVA Volume - DataCrypto Analytics
The PVA Volume indicator (Price Volume Analysis) is a technical indicator that transforms the accumulated historical data.
The PVA Volume Indicator displays a color-coded volume histogram based on Price Volume Analysis (PVA). It is plotted on a separate panel below the price chart of the underlying asset and colors the candles according to the PVA. The indicator represents four market states by means of four different colored histogram bars:
Green : Extreme volume on a bullish candle
Red : Extreme volume on a bearish candle
Silver : Neutral Volume, increasing more than the average
Gray : Neutral Volume
The PVA Volume indicator can be applied to confirm the action of the high or low price of any financial instrument.
Market Makers (PVSRA) - DataCrypto Analytics
Script to track market makers.
Colors candles with higher trading volumes, demonstrating that a lot of smart money is happening.
Exponential moving averages of 100, 200 and 233 periods with VWMAP 25 and DRAGON.
To use this indicator, it is necessary to understand PVSRA strategy.
You can read our PVSRA study on our profile.
//////////////////////////////////////////////////////////////////////////////////////////////////////
// PORTUGUES
//////////////////////////////////////////////////////////////////////////////////////////////////////
Script para rastrear Formadores de Mercado.
Colore velas com volumes de negociação mais altos, demonstrando que muito dinheiro inteligente está acontecendo.
Médias móveis exponenciais de 100, 200 e 233 períodos com VWMAP 25 e DRAGON.
Para usar este indicador, é necessário entender a estratégia PVSRA.
Você pode ler sobre estudo PVSRA em nosso perfil.

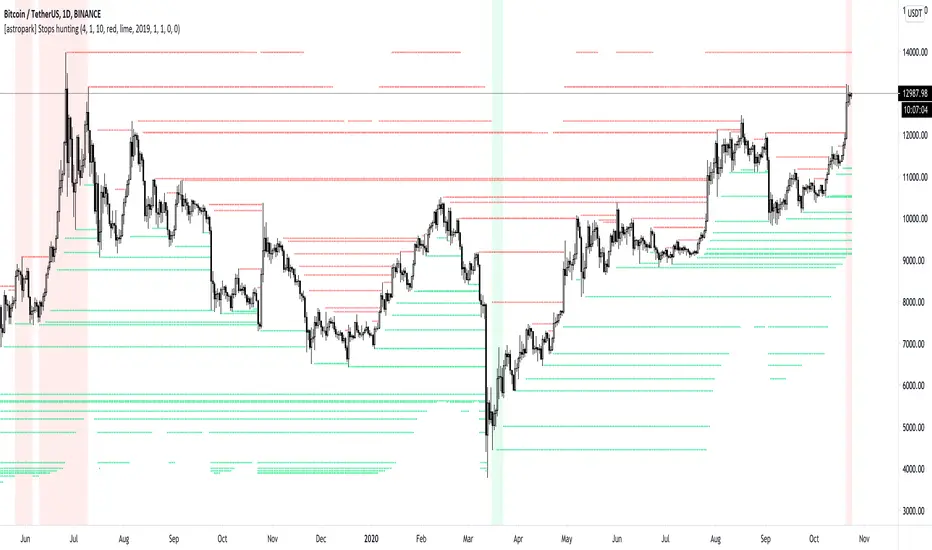
[astropark] Stops huntingDear Followers,
today I'm happy to share with you my Stops Hunting indicator.
This indicators draws lines on important levels, where traders are supposed to set their own stop loss orders .
As per default values you will see
sellers (short) stoploss prices as red lines
buyers (long) stoploss prices as green lines
Market maker move prices towards liquidity, so to hit common traders stoplosses.
Why it acts this way? because stoplosses become fuel for market maker to move price where it wants to, and after latest stoplosses were triggered, then it uses this fuels to make trend reverse to the opposite direction.
To highlight this mechanism, the indicator plots:
red background when there are (almost) no-more sellers' stop losses still to be hit, so the trader can start thinking about opening a sell/short position ,
green background when there are (almost) no-more buyers' stop losses still to be hit, so the trader can start thinking about opening a buy/long position .
This indicator:
works on every timeframe , so it can be used for both swing and scalping trades
has a bias filter to increase or decrease the bullish/bearish backgrounded ranges (the higher the value, the less the width of ranges)
lets you change colours as you like
lets you enable/disable plotting of lines
lets you change lines' thickness and transparency
lets you enable/disable plotting of circles whenever a stoploss is hit
lets you set a starting date/time from which you want the indicator to start its analysis and collecting data for stops hunting
lets you set alerts when a stoploss has been hit/hunted
lets you set alerts when background starting be coloured as explained above
A gentle reminder: always consider setting a stoploss in trades and use a proper money and risk management strategies .
Here there are some examples how the indicator works on many timeframes and markets:
BTC/USDT 1h
LINK/BTC 1h
ETH/BTC 1h
EUR/USD 15m
GBP/USD
Brent Crude Oil 15m
GOLD (XAU/USD) 15m
FaceBook (FB) 15m
Microsoft Corp (MSFT) 15m
This is a premium indicator , so send me a private message in order to get access to this script .
MMP Indicator 4-step WeeklyFading levels using martingale (limit orders, rebate venue) with no stop-loss orders, long the wings at the end of Support and Resist levels from prior week Friday right before the close. Re-hedge the order book units when there is a breakout.

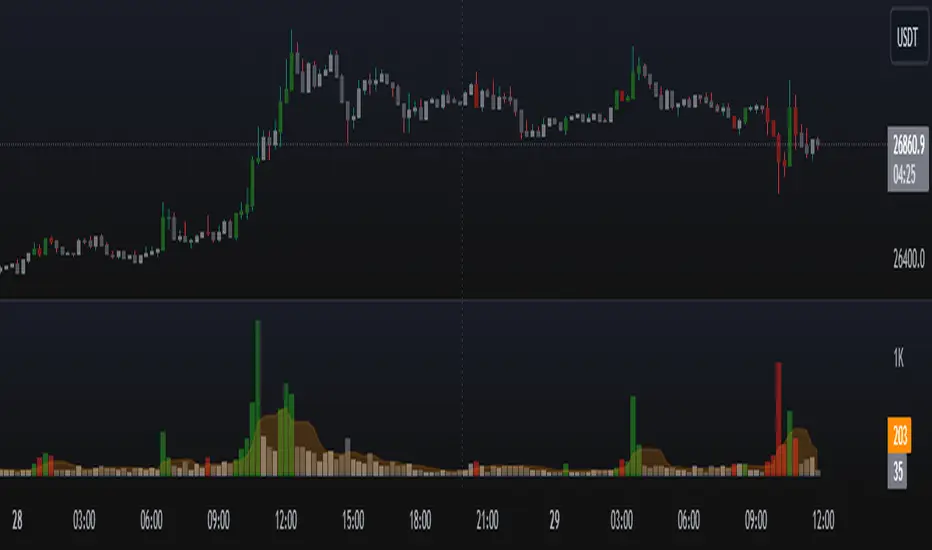
Detect Sequential Trading - Bot DetectorDetect Sequential Trading - Bot Detector.
This tool requires access to volume data .
There are many trading bots out there, that trade 24/7 .
The detector can be used to understand how the bots are configured - to push the market up or down .
Alerts can be set to fire whenever a bot pattern is detected .
They must be configured to run Once per Bar .
It works well with range charts (1R) .
It would work best on 1 second charts or tick charts (currently, TradingView's alert system doesn't work with second charts).
The alternative would be 1 minute charts .
It can be used on higher timeframes but may be less effective.

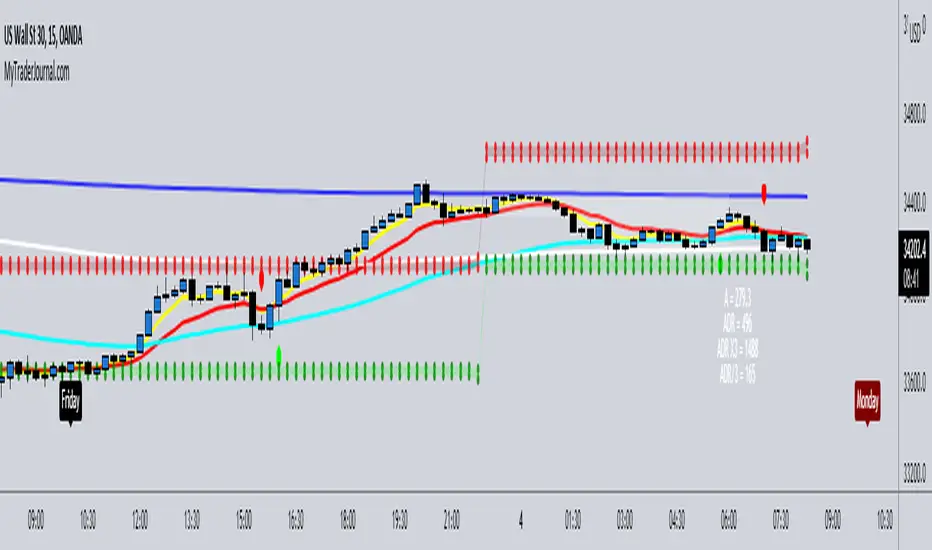
Market Maker Matrx by Jusimen V2.0Compilations of various indicators that will help with the Market Maker Method Strategy.
This has been modified to suit the Market Maker Matrx iteration of the strategy.
It contains:
5 Emas - 5, 13, 50, 200, 800, Shifts
A-Range - Shows Pips
ADR - Shows Pips, Gives ADR High and ADR Low Boxes (10 & 20 Days)
Killzone
Week Days - Named
______________________________________________
Jusimen
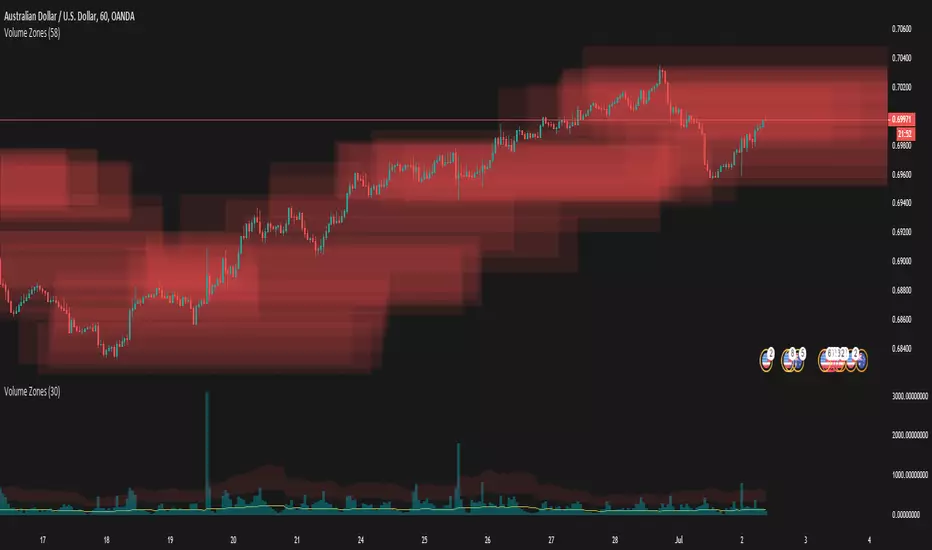
Volume ZonesThis a script that shows where price is trapped in the market based on the volume traded
The plots uses pixels. To correctly see the zones, adjust your zoom and set your level density appropriately
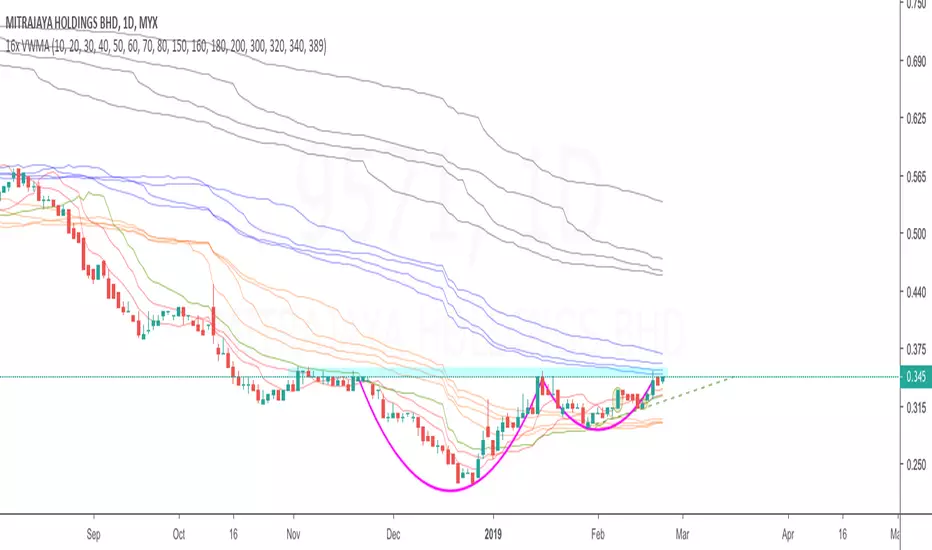
16x VWMACombination of 16 VWMAs to find out where the market makers are.
vwma 10/20/30 - red
vwma 40 - green
vwma 50/60/70/80 - orange
vwma 150/160/180/200 - blue
vwma 300/320/340/389 - black
Forex Insight Pro 6.0Forex Insight Pro 6.0 for TradingView gives you abilities to see the stories hiding in the graphs of the markets. It marks and reminds you about important parameters that are happening on the graph so that you will not forget to consider them before placing orders. These parameters include:
Automatic CC(X) counting that compare the close of the right price bar to that of left price bar in a group of X consecutive bars such as CC(5,9) of a group of 5 bars will compare the close price of the right bar to the left bar (ignoring 3 bars in the middle). If the right bar closed higher, the count number would be printed above the bar. If the left bar closed higher, the count number would be printed below the bar. Nine consecutive series of up counts will define the lowest price as CC(5,9) support line and nine consecutive series of down counts will define the highest price as CC(5,9) resistance line. The count numbers and support / resistance lines are automatically printed on the graph if enabled.
Show a set of simple moving average lines such as SMA5, SMA13, SMA50, SMA200, SMA800, if enabled. The color of SMA50 line (which is the same as the the middle line of Bollinger band (50,2) can be set to change based on increasing/decreasing values of itself, or of the MACD(12,26,9).
Show Bollinger bands (50,2), if enabled.
Show the high and low levels of the previous day, if enabled.
Show the important time areas for Forex trading during Asian, London, and New York sessions, if enabled.
Automatic printing of the events happening in the graph to remind the readers of parameters under considerations (if enabled) including:
- Print "SMA5>13" and "SMA5<13" for SMA5 crossed above and below SMA13.
- Print "SMA50>200" and SMA50<200" for SMA50 crossed above and below SMA200.
- Print "Max" and "Min" for local maximum and local minimum bars.
- Print "C75" and "C25" for the bars that closed above 75% and closed below 25% of its ranges.
- Print "C>SMA5" and "C30" and "RSI<70" for RSI(14) that crossed above 30 % and below 70 %.
- Print "MACD>0" and "MACD<0" for MACD(12,26,9) that crossed above and below zero.
- Print "MACD>Sig" and "MACD

Forex Insight Pro 5.0Forex Insight Pro 5.0 for TradingView gives you abilities to see the stories hiding in the graphs of the markets. It marks and reminds you about important parameters that are happening on the graph so that you will not forget to consider them before placing orders. These parameters include:
Automatic CC(X) counting that compare the close of the right price bar to that of left price bar in a group of X consecutive bars such as CC(5,9) of a group of 5 bars will compare the close price of the right bar to the left bar (ignoring 3 bars in the middle). If the right bar closed higher, the count number would be printed above the bar. If the left bar closed higher, the count number would be printed below the bar. Nine consecutive series of up counts will define the lowest price as CC(5,9) support line and nine consecutive series of down counts will define the highest price as CC(5,9) resistance line. The count numbers and support / resistance lines are automatically printed on the graph if enabled.
Show a set of simple moving average lines such as SMA5, SMA13, SMA50, SMA200, SMA800, if enabled. The color of SMA50 line (which is the same as the the middle line of Bollinger band (50,2) can be set to change based on increasing/decreasing values of itself, or of the MACD(12,26,9).
Show Bollinger bands (50,2), if enabled.
Show the high and low levels of the previous day, if enabled.
Show the important time areas for Forex trading during Asian, London, and New York sessions, if enabled.
Automatic printing of the events happening in the graph to remind the readers of parameters under considerations (if enabled) including:
- Print SMA5>13 and SMA5<13 for SMA5 crossed above and below SMA13.
- Print Max and Min for local maximum and local minimum bars.
- Print C75 and C25 for the bars that closed above 75% and closed below 25% of its ranges.
- Print C>SMA5 and C30 and RSI<70 for RSI(14) that crossed above 30 % and below 70 %.
- Print MACD>0 and MACD<0 for MACD(12,26,9) that crossed above and below zero.
- Print MACD>Sig and MACD

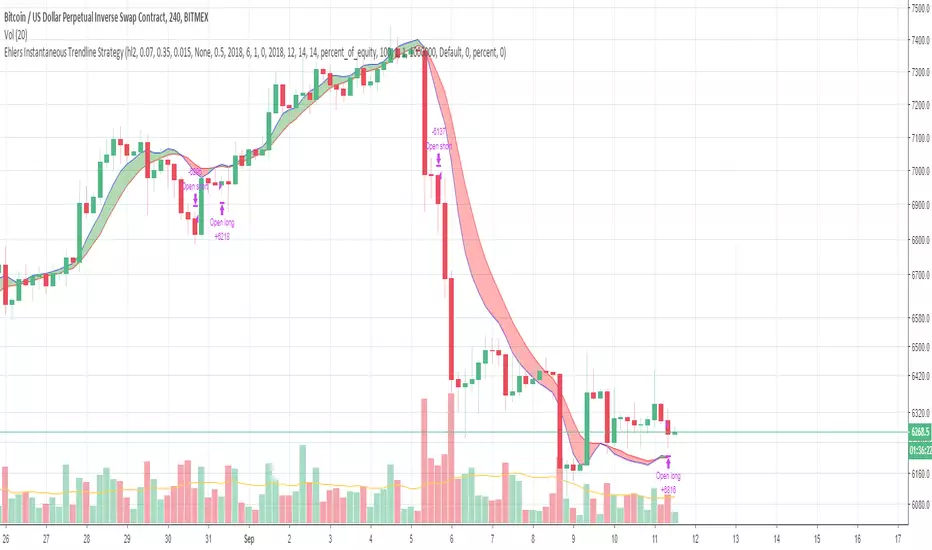
Ehlers Instantaneous Trendline StrategyInstantaneous Trendline Strategy by John Ehlers from his book "Cybernetic Analysis for Stocks and Futures".
You can choose implementation of stop-loss. Don't forget to define correct spread for your instrument.