Mass Thrust OscillatorThis is a custom indicator that turns my Mass Thrust Indicator into an oscillator which is loosely based on Tushar S. Chande's Market Thrust Oscillator (Stocks & Commodities V. 10:8 (347-350))
Let me know if you would like a custom script or if you want to see me publish any other indicators!
Market

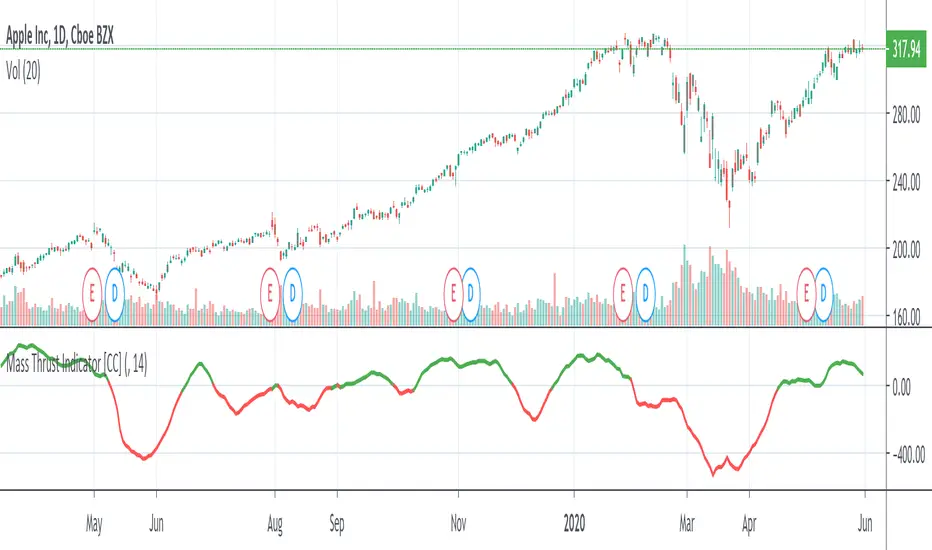
Mass Thrust IndicatorThis is a custom indicator of mine that I based loosely on Tushar S. Chande's Market Thrust Indicator (Stocks & Commodities V. 10:8 (347-350)). Buy the stock if the indicator is green and sell when it turns red.
Let me know if you would like to see more scripts or if you have custom requests!
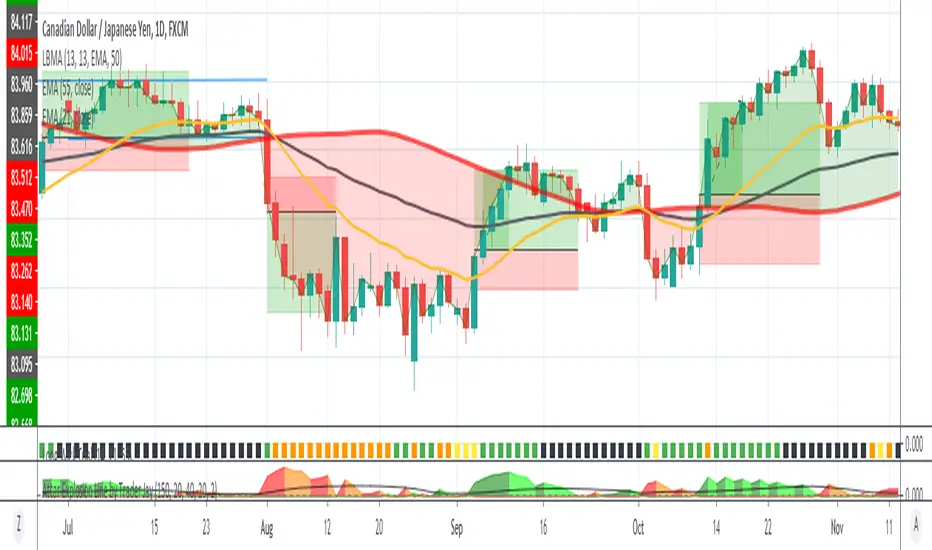
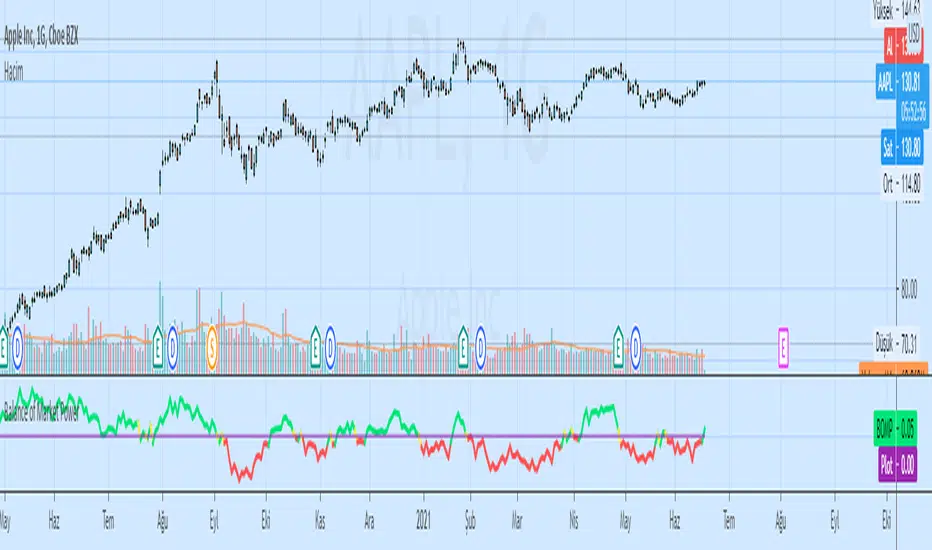
Long Wick TrialI've created this as a confirmation indicator to help know when market conditions are favorable to enter a trade. It measures volume, volatility, and ATR. It is not intended to tell you when to enter/exit the market, but use it with another indicator such as the mirror macd to filter out many losses and avoid entering the market during low volume or excessive volatility that may trip your stop loss.
Green = Favorable Market conditions
Yellow = Enter with caution, the market is moving sideways but is slightly trending
Orange = Enter with caution, the market is trending but extremely volatile and may trip stop loss early
Black = Shouldn't enter market here, market is moving sideways and volume is also low.
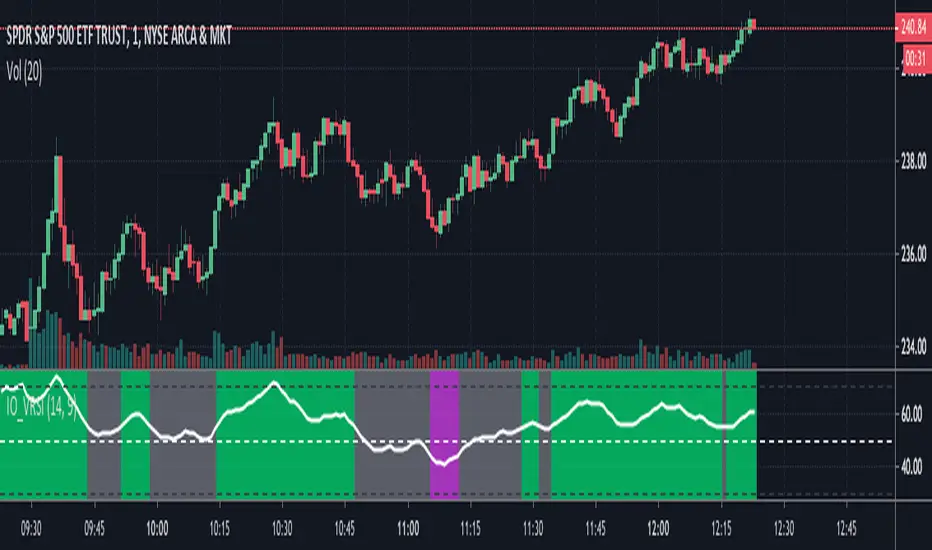
IO_VRSIOriginal Idea by Invsto
In this indicator, I explore the core concepts of RSI and extend it with smoothening to determine volatility.
Usage:
LIME/GREEN : High Volatility and BULLISH trend
RED/FUCHSIA : High Volatility and BEARISH trend
GRAY: Low volatility/Potential Chop Zone
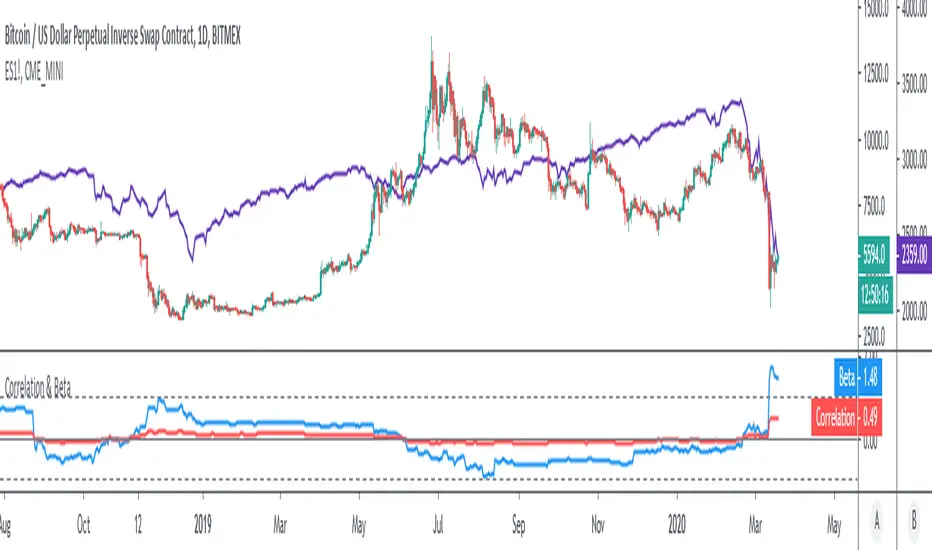
Correlation & BetaDisplay the correlation coefficient and/or Beta of an asset to a specified market.
Options to:
- Specify market (S&P500 futures by default)
- Display one or other metrics
- Modify assessment period (200 bars by default)
- Calculate on price, returns or log-returns
Yield Curve Inversion MonitorIdentifies when the US Treasury Yield Curve inverts (2 and 10 year bond rates).
When they ‘invert’ long-term bonds have a lower interest rate than short-term bonds. In other words, the bond market is pricing in a significant drop in future interest rates (which might be caused by the US Fed fighting off a recession in the future).
In the last 50 years, every time the US treasury yield curve inverted a recession followed within 3 years. On average the S&P500 gained 19.1% following the inversion and peaked 13 months later. In other words, as far as investors are concerned, the recession began roughly one year later.
However, once the market peaks, it then drops 37.6% on average, wiping out all those gains and more.
...Looks like 2020 is shaping up to be another prime example.

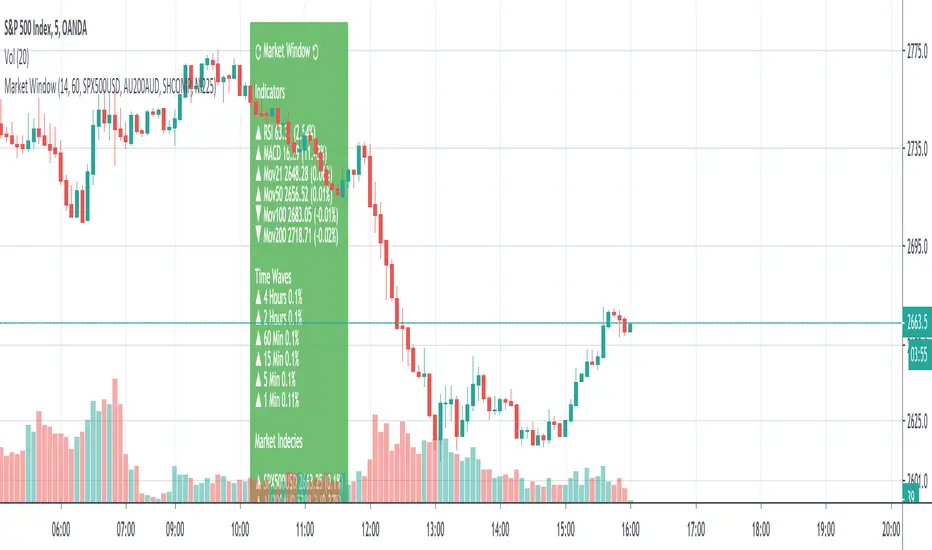
SMU Market Window with Price WavesSMU Market Window is a standalone panel of major indices, indicators, and, most importantly, the status of all timeframes 1 minute, 5 minutes, etc. all in one window.
Market window can be used on its own or in conjunction with the new version of Quantum Thermoballs Turbo Charged (to be released soon).
Since this scripts queries multiple time frames and multiple incendies, it takes 1-2 seconds to load. Once loaded it works like a clock.
Enjoy and always share knowledge so our Pine TV community can grow and reac a new high.
Zahorchak MeasureCreator: Michael G. Zahorchak.
References:
The Art of Low Risk Investing by Michael G. Zahorchak, 1977. Unfortunately, it's all but impossible to find a copy these days.
The Complete Guide to Market Breadth Indicators by Gregory L. Morris, 2006. A fantastic resource for those interested in Technical Analysis or creating their own trend based system.
Two articles by Greg Morris on the Zahorchak Measure. I can't link to them under the House Rules, but they are easily searchable.
The Zahorchak Measure (ZM) is designed to give you a market bias (either uptrend or downtrend) which you can use to determine a trade bias for ETF's or stocks.
ZM works by taking multiple moving averages of the NYSE Composite, a moving average of the NYSE advance decline line, and examining the relationship between those elements. Broadly, the market is considered to be in a uptrend when ZM is above zero, and a downtrend when below. However, there are many ways to interpret the indicator.
The version created by Greg Morris is more akin to a binary indicator in that ZM jumps from number to number. This version is smoothed to create an oscillator as it reduces whipsaws (at the expense of lag). You can set the EMA Length to 1 to go back to the original.
Some notes:
Michael Zahorchak called it the "Zahorchak Method", whereas Greg Morris uses the term "Measure". I'm not totally clear on the change, but Mr. Morris made some changes (covered below), so that may explain the altered name.
The original indicator used moving averages of 5, 15, and 40 weeks. I have converted these to daily numbers as that's the time frame I most commonly trade. You can convert the numbers back by dividing by 5.
The original indicator used the Dow Industrials for the moving averages, however Greg Morris switched to the NYSE Composite due to the advance decline line being based on the NYSE.
Greg Morris removed the 5 period moving average of the NYSE Composite, as it created increased volatility at market tops and bottoms. I tested ZM with the 5 period MA added back in, and I believe removing it creates a superior indicator.
I've added both Multi Time Frame functionality, and the ability to alter moving average lengths. Play around and see what you can come up with.
ZM oscillates between -10 and +10. There are some interesting levels creating between these two numbers (apart from the obvious zero level) - see what you can come up with.
All credit goes to Michael Zahorchak and Greg Morris for the indicator creation. I have simply reproduced their work for the TradingView community as this great indicator wasn't available.
Any queries let me know in the comments or PM me.
DD.

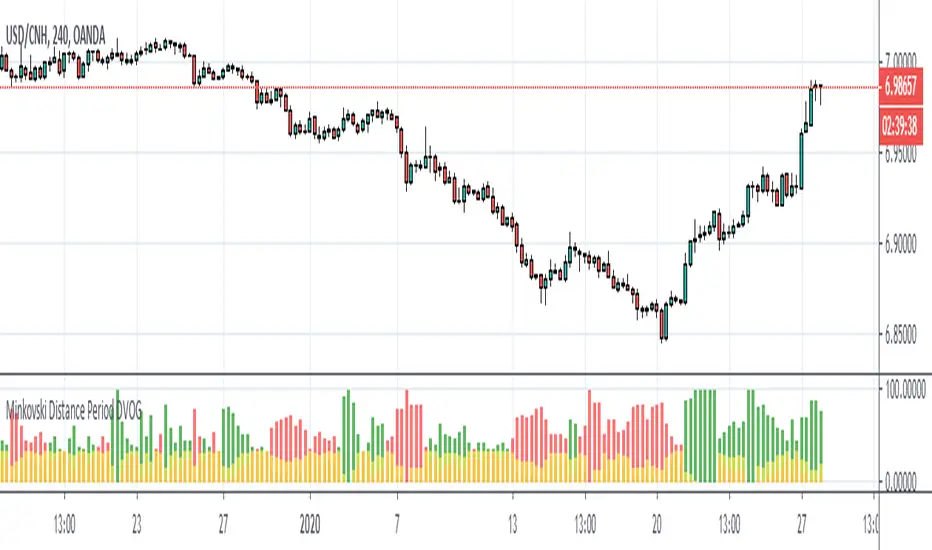
Minkovski Distance Period DVOGThis script was created by building my Dependent Variable Odd Generator script on the Minkovski Distance Adaptive Period.
I have tried this on MACD before.
Script related to MACD :
I used an older version that does not use Dow Factor to suit multi timeframe analysis.
In this way, market situations provide the opportunity to see histograms in an adaptive period as a Multi Timeframe.
Minkowski Distance Function Original Script by RicardoSantos :
Regards.
Market Thrust IndicatorThe Market Thrust indicator is a powerful measure of the stock market's internal strength or weakness. There are four components to this indicator:
1-Advancing Issues on the New York Stock Exchange (NYSE) – $ADV
2-Advancing Volume on the NYSE – $UVOL
3-Declining Issues on the NYSE – $DECL
4-Declining Volume on the NYSE – $DVOL
The formula for Market Thrust is given below:
($ADV x $UVOL)-($DECL x $DVOL)
When used for day-trading, the trend of the Market Thrust indicator is what is most important.
Rising Market Thrust Indicator: Considered a bullish sign; can act as a confirmation signal when combined with a rising stock, index ETF, or stock index future's price.
Falling Market Thrust Indicator: Considered a bearish sign; can act as a confirmation signal of a decreasing market price.
The Market Thrust indicator could be used for detecting divergences in trends. Divergences occur when:
- Price is trending higher, but the Market Thrust indicator is not moving higher or is even going down.
- Price is trending lower, however, the Market Thrust technical analysis tool is not trending lower, it is either not trending or is trending higher.
Add a fully configurable trend line over MTI.
Read more at: commodity.com

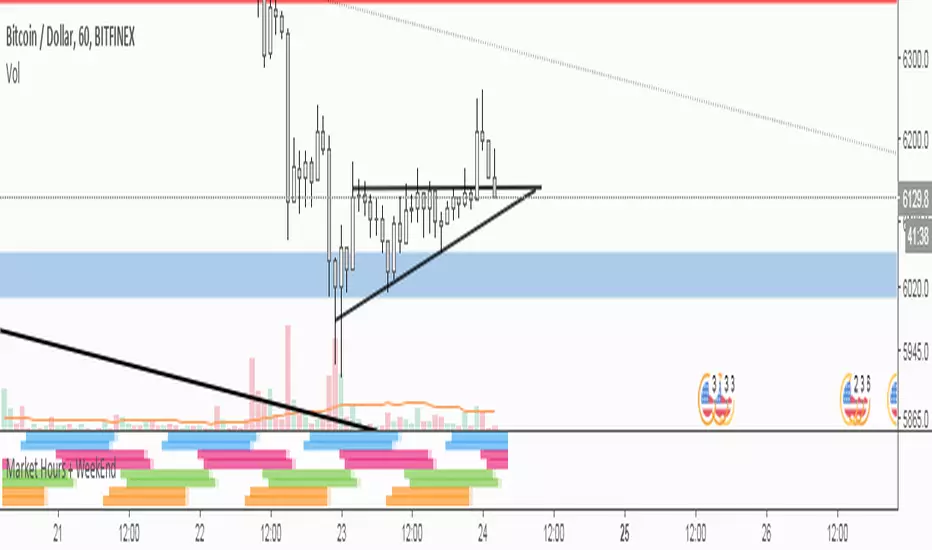
Market Profile for Futures with Session and After Hours SplitAdapted existing Market Profile scripts to be move suitable for Futures Markets with Session and After Hours split
Script Provides split Market Profiles for Session and After Hours
Users can customize the Session and AH hours inputs to suit any ticker and their interpretation of prime and non-prime hours

BTC Bear Market Identifier [ChuckBanger]I have never find a use case for Line Break chart before. But I stumbled on the fact that if bitcoin dumps below the low of a big down move. It is very likely Bitcoin is heading for a new bear market. So this script is based on that idea and developed to this. It is intended to be used as a bear market identifier only with Line Break daily or higher time frame chart. If someone find a different use case for this script let me know
2014:
2018:

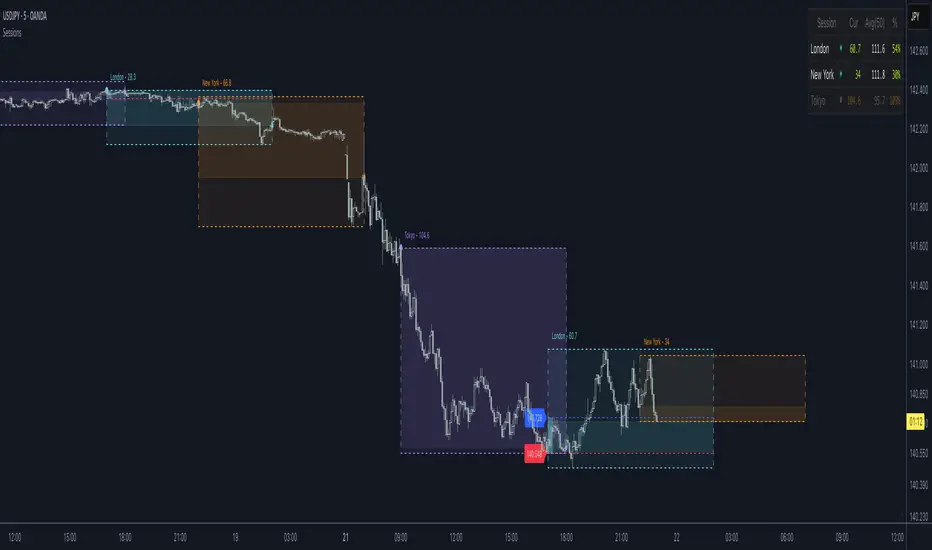
Fx220 Market Sessions IndicatorFx220 NATION! Welcome. Here's a script to add the Market Sessions without altering any settings! Enjoy - Brian

Market Type IdentifierHelps to evaluate if a market is crypto, forex or stocks. Useful if you want to use specific Ichimoku settings or certain moving averages without having to manually change the settings. This is mostly provided for other Pinescript coders, so will not be useful as a standalone indicator

IO_EMA_Delta_OscillatorThis is a EMA Delta Oscillator: An attempt to show ranging markets based on the slope of the EMA.
Green = Bullish Market
Blue = Ranging Market
Red = Bearish Market
The EMA Slope is normalized to make it work like an oscillator with values between 0 and 1.
Bar colors show the oscillator colors, bar borders show the actual candle colors.
- Invsto
(sarangab)

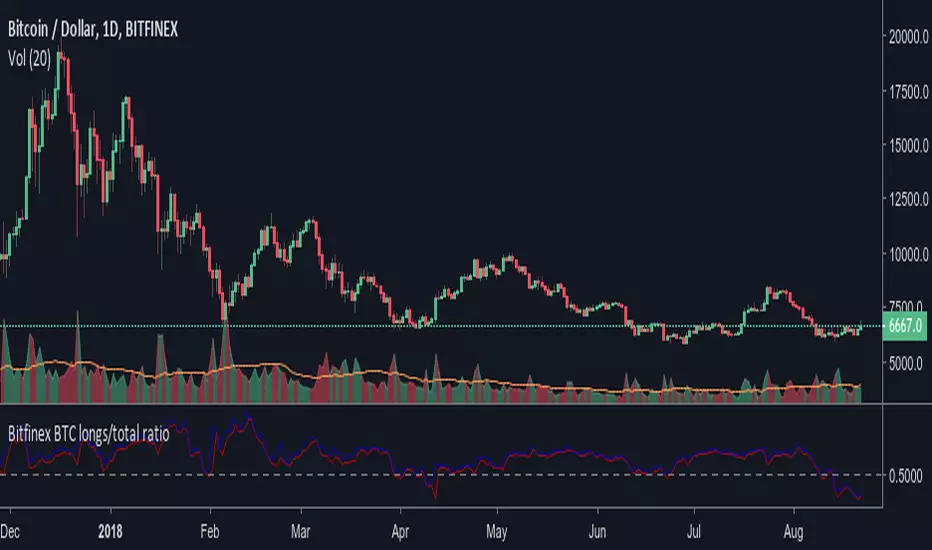
Bitfinex BTC longs/total ratioRatio of bitfinex longs versus the total btc in positions. Maybe a good indicator of market sentiment. It allows you to see too where were people taking profit or closing positions. Remember that ratio going up doesn't necesarily mean more longs positions are being added. It could mean shorts are closing position massively. The conversely is also true.
The rate above 0.5 doesn't necesarily bullish, though, and the indicator is "timeframe" agnostic. So take into account that there could be tons of longs positions that were opened since back before summer 2017, It seems to be too of positions opened at prices below 4.000$. That's why the average seems to be around 0.6.
The blue lines indicates current ratio (or on close for past bars). The red line is the max ratio (higher shorts versus lowest longs).
40 DOMINANT ALTCOINS BINANCEThis indicator is a combination of 40 different altcoins which are found on Binance exchange.
I have listed all Binance altcoins in the order of the oldest listed and the newest.
Due to limitations on TV for calling only 40 securities at the same time, I have limited myself with adding only the oldest ones (9+ months) and some 8+ to make up at least 40 for more data.
I have excluded BTC, BCC, ETH, USDT, BNB from list as these are the trading pairs.
I have some updates in mind and will try to add more options in coming months
Regularly updating 40 altcoins list by sorting them by market cap and available historical data from Binance
Adding Bitfinex, Bittrex and other exchanges separetly, as there is only 40 security call limit
Adding ETH; USDT pairs for all above exchanges.
You can add any indicator to this indicator - such as MACD, RSI, EMA and so on to help you analyse it more deeper
When you load this indicator, it takes about 1 min wait as it takes and calculates a lot of data. After it is loaded, it works perfectly.
Currently there is only 40 oldest altcoins to gather enough data, but as time passes, I will change some of them to create better picture of alt coins.
Please report any problems and give feedback.
Any idea of improvement is welcome and I will try my best.
Please support me an consider to give a small tip to addresses bellow. It would greatly help me to free more time for improvements as I am working to support family and my time is limited for markets.
ETH: 0xac290B4A721f5ef75b0971F1102e01E1942A4578
BTC: 39p3rKuJYKGqph1Qs35yEfNWoPvpUJBBcy
This will greatly help me to keep update this indicator and give me more time to analyse and sort out all altcoins my their market cap, volume and influence.

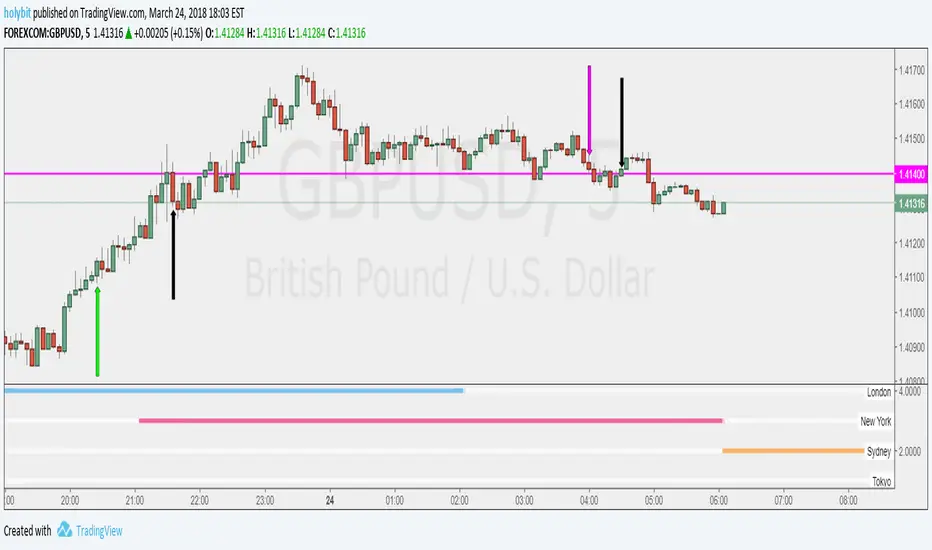
Market Hours PSTI modified following script for PST time users.
And also, it has only major 4 time zones (London/NewYork/Sydney/Tokyo), and supports 4H/1H/30M/15M/5M scales.
Gazzaahh~ TechFXC :-b
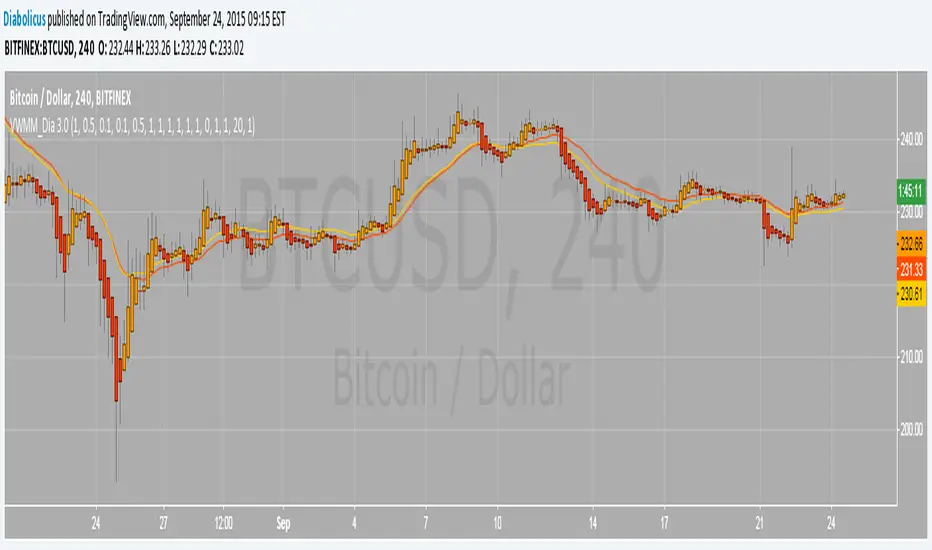
Volume Weighted Market Mean 3.0 [Dia]150924 - v3.0
This script is a complete rewrite of the previous version here .
It gathers market data from up to 8 different Bitcoin exchange pairs (8 is maximum due to script limitations).The influence of each single exchange can be customized individually, default is 50% for 0-fee exchanges, 10% for futures and 100% for all others. For each single exchange a standard deviation from the composite mean price and a average price range are determined. To make data from exchanges with different liquidity comparable, all single exchange price ranges are normalized to the range of the composite mean price. To make data from exchanges with different fee structure (= exchanges that constantly trade at a premium / discount) comparable, all single exchange prices are corrected by their respective standard deviations. To account for trade volume, all price data is weighted by the current candles volume.
- optional Heikin Ashi candle display
- optional EMAs
- lots of switches to play around with ;-)