Easy Entry/Exit Trend Colors (With Alerts)This is an updated version of user Algokid's script called 'AK MACD BB INDICATOR V 1.00'. You can find that original script here:
I added many alerts along with the Bullish and Bearish alerts when the MACD crosses over the Upperband or crosses down on the Lowerband.
I personally use this indicator with Crypto charts (Bitcoin on a 15min, 1hour, and 4 hour timeframe) as one of many confirmations that it's a good time to enter a trade. This script was made to be easy to follow with the colors of GREEN triangles being a good uptrend or entry confirmation, and RED being a confirmation to sell/short or exit your trade.
It's important to use this indicator in combination with other indicators that can give you more confirmations to enter or exit a trade, and make sure you are on normal candles and not HA or any other candles as you can get wildly inaccurate results.
This script also has the Death & Golden crosses, which is the slow and fast moving averages crossing over each other. I don't use this as an additional confirmation, it's just nice to know where the cross happens.
Divergência / Convergência de Médias Moveis (MACD)

Hopper Trigger - Free Cryptohopper WidgetWelcome to our Tradingview cryptohopper trigger widget.
We designed this script to give Cryptohopper users the possibility to set up an alarm when btc is trending down. Cause of the BTCs behavior as the supertrend coin for the market it is better to turn your hopper off or be extremly careful when BTC is trending down. We implemented to types of alarms, because atm its not possible to automate using them to deactivate your hopper. On Alarm setup could be used to send signals every minute to trigger a push notification on your App or to trigger your Alexa. The other type of alarm only sends one single signal for normal purposes.
We recommend using this indicator in the 30 minute or 1 hour timeframe and to deactivate your hopper and deleting all positions when a alarm is signaling. The risk of a larger drop is very high in this marketphase. Never take an drop again using this approach. Little drawdown in bearish or ranging times but high reward in bullish times.
Smartgrow-Trading is a community project with the aim of developing the best and most successful trading strategies and sharing them with the community.
The basic idea of this script is to calculate how far an coin is away from its ATH , to gave warning signals for deactivating coins after they reached there ATH . So it could also be used for other coins and pairs.
If there are questions, write them into the comments or contact us directly over the direct message or social media. Happy Trading!

Triple Exponential MACDA modification of the classic MACD to use Triple EMAs which tends to have less lag than the standard indicator. (I also have a Double Exp MACD indicator, I tend to use both simultaneously)
Alert conditions are pre-configured for simple line crosses and you can enable/disable the histogram from the indicator options menu.
Enjoy!

Double Exponential MACDA modification of the classic MACD to use Double EMAs which tends to have less lag than the standard indicator.
Alert conditions are pre-configured for simple line crosses and you can enable/disable the histogram from the indicator options menu.
Enjoy!

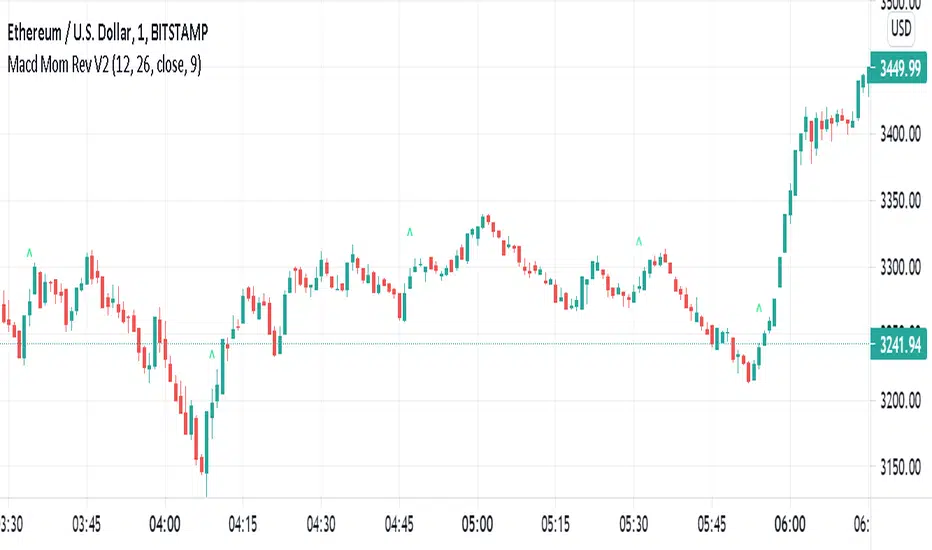
Simple Macd Momentum Reversal IndicatorThis Simple indicator uses the MACD history to check trend reversals. It primarily check if the histogram has moved up from a downtrend above a certain margin. If it has, it places a green B on the chart. If you were to use/improve this indicator, please use it with other indicators to confirm your position. This is NOT an indicator that can be well used alone.
Price Acceleration Convergence Divergence V2This is a fork of the previous PACD indicator i made by working out the RSI another two times. it works the exact same but is more leading in trend reversals and divergences.
this indicator plots 4x the RSI of the RSI of the price using the derivatives of RSI. Data is plotted just like the MACD.
points 5 and -5 are very strong support/resistance points and should be very important points to take note of.
use this indicator like the MACD essentially with the assistance of a 4x RSI momentum. enjoy

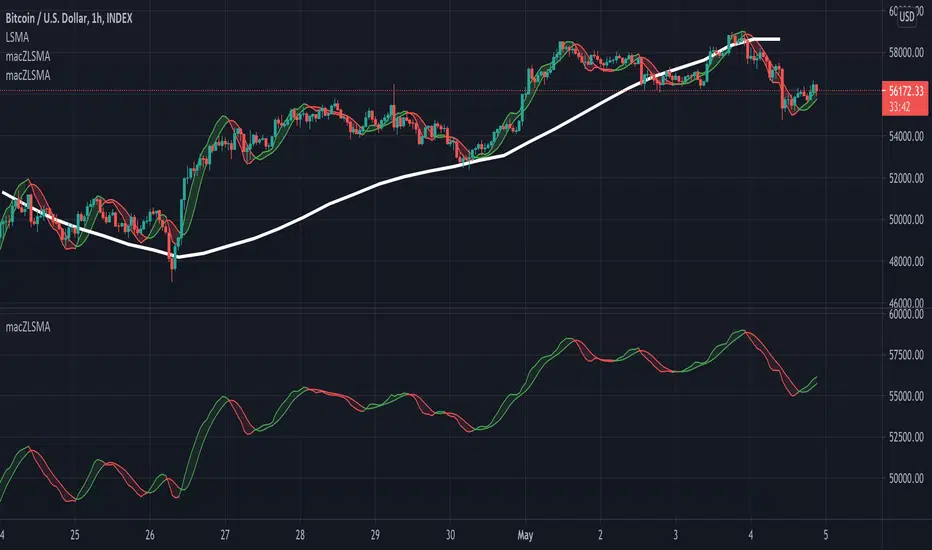
macZLSMA - Overlay**Overlay Version** Macd that shows instantaneous trend using ZLSMA. This crossover has the ability to reveal trend directions before it happens. With multi time frame option.
Above image shows 1 hour timeframe using 12hour setting on indicator
Example with 1 hour timeframe:
Example with 1 hour timeframe using daily setting on indicator:
Non overlay version available here:
macZLSMAMacd that shows instantaneous trend using ZLSMA. This crossover has the ability to reveal trend directions before it happens.

Price Acceleration Convergence Divergence [PACD]this indicator plots the acceleration of the price using the derivatives of RSI. Data is plotted just like the MACD. use this indicator like the MACD. enjoy
RSI & MACDThis indicator presents standart RSI and MACD indicators in a single indicator. The appearances of these indicators have been modified a little bit and squeezed into one window. To overcome the scale problem the MACD values has expanded with 1000 and divided by the current price to use both indicators in the same scale. Original values could be determined from there. Original Tradingview codes have been used to get full control of graphs.
Bu indikatör RSI ve MACD gösterfgelerini tek bir indikatörde sunuyor. İndikatörlerin görünüşleri bir miktar modifiye edilip iki indikatörğn tek bir pencereden takip edilmesine olanak sağlanmıştır. İki indikatördeki farklı ölçek kullanımından ortaya çıkan ölçek sorunu MACD değerlerinin 1000 ile genişletilip, ürünün güncel fiyatına bölünmesiyle giderilmiştir. Her iki indikatiör için de orjinal Tradingview kodları kullanılmıştır.

CCI Breakout TraderWorks well on Bitcoin or most altcoins on a 15min chart or higher.
What is this exactly?
This is an indicator that uses horizontal RSI + EMA lines with a CCI line on top of it to provide optimal entry and exit positions for trading. There is also a breakout indicator based on the width of Bollinger Bands.
How to use:
If the blue stream passes upwards on the red heading to the white - it's heading towards a good BUY signal. To be safe you wait until it passes above the white line, then BUY LONG. Another signal to buy long is when the blue stream passes above the white and green lines.
Selling is essentially the opposite, if the blue stream is passing down from the green or white lines, then it's time to sell and exit your trade.
If you need help knowing when to enter and exit a trade the indicator will draw a grey candle on your chart to signal it's time to exit a long trade and it will draw a purple candle when it's time to enter a long.
--
Breakout alert:
If you see a green vertical bar it's a warning that there is a potential breakout in price coming for whichever coin you are looking at. The price breakout could go either direction, so make sure you watch the blue stream.
--
Important tips:
The direction of the green/white/red lines are important - if they are heading down that means it might not be the best time to enter your trade, even if the blue stream crosses up on the red and/or white lines.
The colored horizontal lines are there to let you know if the blue stream is near the bottom of those lines (anywhere from hline 15 to 50) and heading upwards, you will more likely have a longer positive trade. If the blue stream is above 60 hline and it looks like a good trade (passing up on the red and white lines), expect to have a shorter trade.
I use this for swing trading various crypto currencies, once you learn how to read it, you can catch amazing uptrends really early and you can exit trades before some big drops happen.

MACD Moving Average Convergence/Divergence - DurbtradeDurbtrade MACD - macd line changes color based on vertical direction. This makes it easier to see and discern movements and also helps the indicator to retain maximum functionality when taking up less chart real estate (also, having the color change really helps me see charts on small screens... such as when it's bright outside and I'm driving in my car and glancing at a chart on my phone... it helps having the info pop visually). A fill option is included to fill the space between the macd and signal lines, though I personally prefer to disable this function. Also, you get a zero line if you want it, and it doesn't extend past the current time, removing unnecessary info and keeping your chart looking a bit cleaner. Finally, there are color-coded, cross-over and cross-under background fills, signaling when the macd line crosses the signal line.
This is my 2nd published script, and 2nd script ever. If you like this style, see my 1st published script: Durbtrade Bollinger Bands Width.
Hope you find this useful.
Feel free to comment.

Multiple Screeners with AlertsI already published few version of my custom screeners. Unfortunately, because of TradingView's security function call limit you can't use more than 40 stocks in 1 screener.
Fortunately, you can compute multiple values in your function and screen few indicators at once.
In this script I show how you can compute 5 indicators at the same time for 40 instruments. I display then in different labels.
Every label consist of list of instruments satisfying current indicator conditions and a value for it. It can be absolute value as for RSI or -1/1 representing Bullish/Bearish event.
Also you can create 1 alert with result of all screeners inside.
In this example I took 5 indicators with following conditions:
RSI - "RSI < 30" or "RSI > 70"
TSI - "TSI < -30" or "RSI >30"
ADX - "ADX > 40"
MACD - "MACD Bullish Cross" or "MACD Bearish Cross" (1 and -1 in screener)
AO - "AO Crosses 0 UP" or "AO Crosses 0 DOWN" (1 and -1 in screener)
Params
- bars_apart - this parameter define how may bars apart you labels are on your chart. If you see labels overlapping, increase this number.
- Parameters for all used indicators
- 40 symbol inputs for instruments you want to use in this screener
Alerts
You can create an alert from it easily by selecting screener name from the list and then selecting "Any alert() function call".
No additional configuration is required, message and alert on close is generated in the code.
You should better change default name for your alert. Sometimes because of big amount of inputs you might receive an error.
Disclaimer
Please remember that past performance may not be indicative of future results.
Due to various factors, including changing market conditions, the strategy may no longer perform as good as in historical backtesting.
This post and the script don’t provide any financial advice.

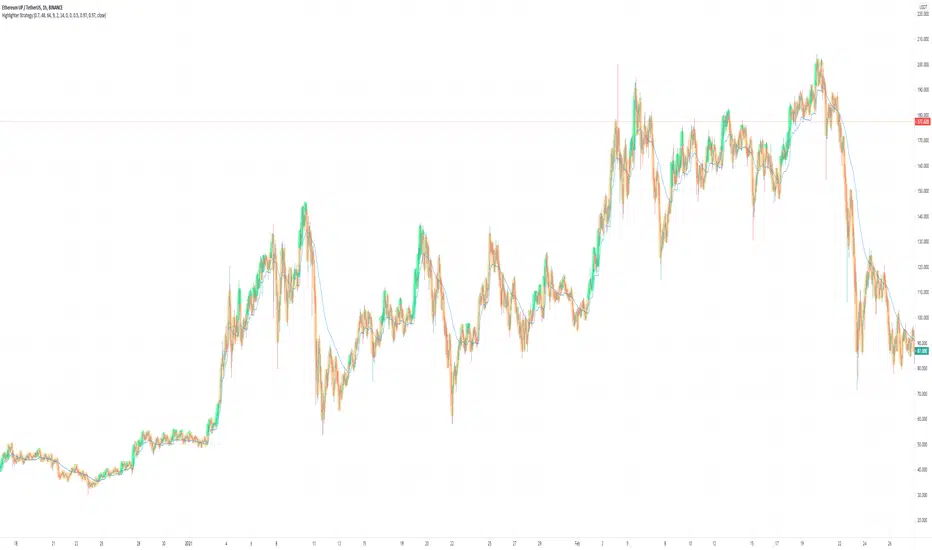
Highlighter Strategy V2// Based on Normalized Smoothed MACD by Dreadblitz
Old one was just an oscillator, I changed a few things
1) It now paints the line green/orange
2) The trigger (green/red) is now based on a signal
3) The signal is basically isUp, but with some additional controls, e.g.
4) (new) There is an embedded stoploss. This is a growth/decay function that decays slower than it grows.
5) Signal is filtered additionally by the stoploss (no green under the decaying line)
Highlighter StrategyOG COINBASE:BTCUSD
Based on Normalized Smoothed MACD by Dreadblitz
Updated slightly the rules about when it'll take a signal, and made it an overlay so that you see "green" and "red" on the price bar.
Things you might want to do when using it.
- Add a stoploss/trailing stop probably a MA of your choosing.
- Check different time frames to confirm a strong entry

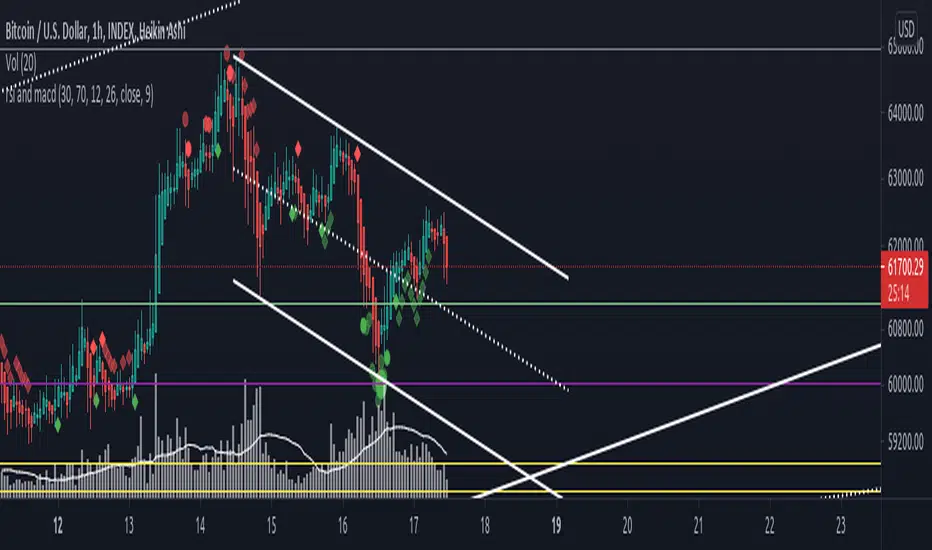
rsi and macdRSI and MACD in the chart:
- small circles -> oversold/overbought
- big circles -> oversold/overbought rising/falling
- small diamonds -> macd over/under signal with macd over/under zero
Please comment if you have an idea to improve it ;)
GSO + RSI + MACD + MFI + Bollinger BandsThis script uses a Gann Swing Oscillator , RSI , MACD , MFI and Bollinger Bands to generate long and short signals for cryptocurrencies on the 5 minute chart.
The Gann Swing Oscillator was inspired by HPotter's GSO.
This script is for educational purposes only. This script is NOT to be used as financial advice. I will not accept liability for any losses which may occur as a result of using this script.

MACD oscillator with EMA alert version 4HThis is the study/indicator alert version of the macd + ema strategy.
The strategy details are the following :
Is a simple, yet efficient strategy, which is made from a combination of an oscillator and a moving average.
Its setup for 4h candles with the current settings, however it can be adapted to other different timeframes.
It works nicely ,beating the buy and hold for both BTC and ETH over the last 3 years.
As well with some optimizations and modifications it can be adapted to futures market, indexes(NASDAQ, NIFTY etc), forex( GBPUSD ), stocks and so on.
Components:
MACD
EMA
Time condition
Long/short option
For long/exit short we enter when we are above the ema , histogram is positive and current candle is higher than previous.
For short /exit long , when close below ema , histo negative and current candles smaller than previous
If you have any questions please let me know !

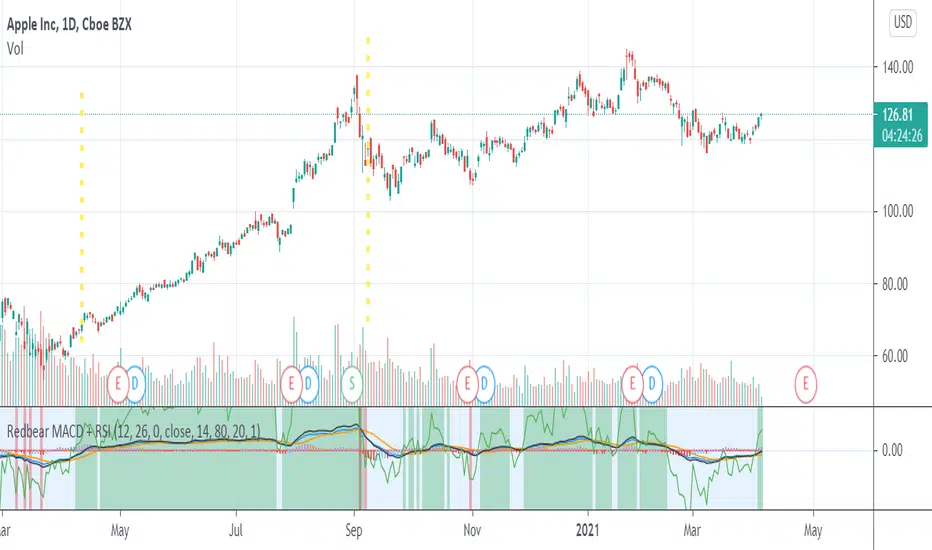
Redbear MACD + RSIHello . I make script that combine MACD and RSI
Green area is BUY SELL signal when rsi >45
you can custom parameter .
Log MACDThis is just a MACD indicator using the log of the closing price rather than the normal closing price. Useful for exponentially growing stocks and cryptocurrency.

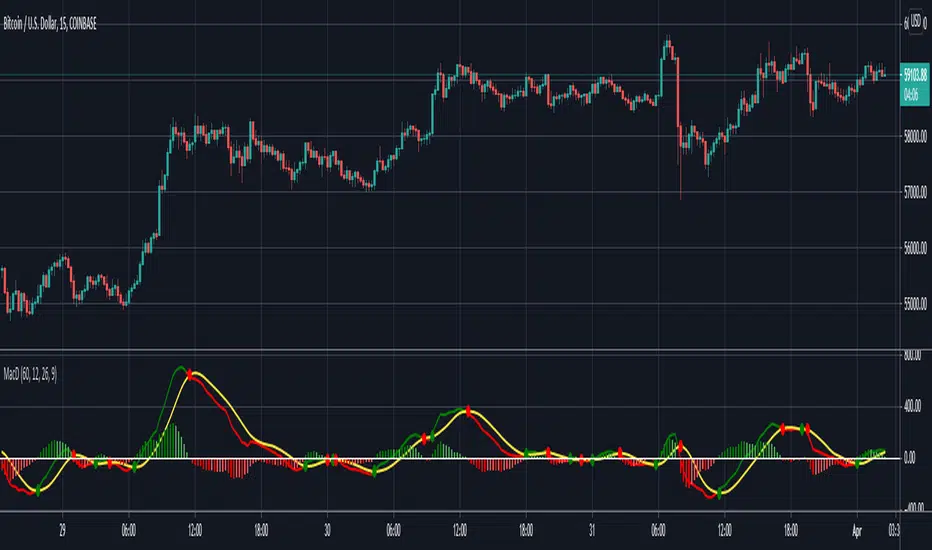
MACD Multi-Timeframe IndicatorHello everyone, this is indicator has always been my go-to MACD indicator for many years. It is such a beautiful easy to understand indicator. You can also view different timeframe resolutions which is helpful. When the MACD crosses up the signal line it is green, and when it crosses below the signal line it is red. The signal line is the constant yellow line. MACD histogram is dark green when increasing buying momentum, and you'll see the green get lighter when buy momentum is decreasing. As well, MACD histogram is dark red when increasing sell momentum, and you'll see the red get lighter when sell momentum is decreasing. I hope you guys love this macd design. Happy trading!
The MACD indicator can be used in many ways but my favorite way to use MACD by itself is by going long when macd < 0 & macd crosses above signal line, and going short when macd > 0 & macd crosses below signal line. I added those alerts for anyone interested.
MACD + PSAR SetupThis indicator combines 3 elements:-
1. MACD which will act as a source of potential Buy Signal
2. PSAR which provides the confirmation for buy signal and for potential Buy on Dip Strategy
3. Breakout candles which provides the confirmation signal for Buy on Breakout strategy
4. The direction of the trend is provided by the Exponential Moving Average
The strategy is to have any counters which has triggered the MACD Golden Cross signal. These counters are to be out under watchlist for further confirmation.
The Buy Signal is confirmed when:-
1. Price is above EMA Direction(standard is set at 200)
2. PSAR has given the Buy Signal OR a Breakout Candle occurs.
Buy Signal is shown with a Green Diamond symbol whilst the Sell Signal is shown in Red Diamond Symbol.
The bullish and bearish condition is set via a green and red background
The MACD and PSAR codes are derived from the standard codes which is available in tradingview.

ADX Momentum cross + MacD + HH LL + Buy/Sell Signals and alerts Hello, This is the first indicator I have made and would like to contribute to the community.
This strategy came from trying to replicate a previous ADX Cross Indicator that I loved on MT4 which I used successfully on EUR/USD on high and low time frames. Through the process of trying to replicate it I failed, I decided to take what I had written so far and create my own ADX cross strategy using the combination of 3 ADX's, their lag. Then also using Higher highs and lower lows with the MacD to further filter the signals.
There are two buy and two sell conditions , the difference between these are just the order in which the ADX crossing determines the entry. The MacD and higher highs and lower lows are the same for filtering the signal.
You can change the look back for HH and LL look back range, along with the DI Length & ADX Smoothing for all ADX's. The lag used for either the buy or sell strategy with the Lag_Buy/Lag_Sell inputs. Lag_mid setting will affect all 4 conditions.
From testing and based on the ADX cross logic you should follow this structure when changing the inputs for:
DI Length: Lowest DI value (I.E. 1)
DI Lengtha: Middle DI value (I.E. 2)
DI Lengthb: Highest DI value (I.E. 3)
ADX Smoothing: Lowest Smoothing value (I.E. 1)
ADX Smoothinga: Middle Smoothing value (I.E. 2)
ADX Smoothingb: Highest Smoothing value (I.E. 3)
I tested this on the EUR/USD, but mainly I have been using it on BTC/USDT(binance) and BTC/USDT Perpetual futures(binance) with the 5 minute chart. I suggest playing around with the settings depending on the Symbol and timeframe you use because the default settings are what I last found to be optimal for my self on the 5min BTC/USDT Perpetual futures(binance) chart.
A good starting point I found when using the indicator on other charts is to use the below values:
DI Length: 7
DI Lengtha: 14
DI Lengthb: 21
ADX Smoothing: 7
ADX Smoothinga: 14
ADX Smoothingb: 21
If you have any questions, suggestions, or requests for this indicator feel free contact me. You can either comment on here or Message me
If you like this indicator please like and comment where you found it useful.
