Apex Edge - RSI Trend LinesThe Apex Edge - RSI Trend Lines indicator is a precision tool that automatically draws real-time trendlines on the RSI oscillator using confirmed pivot highs and lows. These dynamic trendlines track RSI structure in motion, helping you anticipate breakout zones, reversals, and hidden divergences.
Every time a new pivot forms, the indicator automatically re-draws the RSI trendline between the two most recent pivots — giving you an always-current view of momentum structure. You’ll instantly see when RSI begins compressing or expanding, long before price reacts.
Key Features: • Dynamic RSI trendlines drawn from the last 2 pivots
• Auto re-draws in real-time as new pivots form
• Optional "Full Extend" or "Pivot Only" modes
• Slope color-coded: green = support, red = resistance
• Built-in dotted RSI levels (30/70 default)
• Alert conditions for RSI trendline breakout signals
• Ideal for spotting divergence, compression, and early SMC confluence
This is not your average RSI — it’s a fully reactive momentum edge overlay designed to give you clarity, structure, and timing from within the oscillator itself. Perfect for traders using Smart Money Concepts, divergence setups, or algorithmic trend tracking.
⚔️ Built for precision. Built for edge. Built for Apex.
M-oscillator

52SIGNAL RECIPE Market Structure Reversal Signals═══ 52SIGNAL RECIPE Market Structure Reversal Signals ═══
◆ Overview
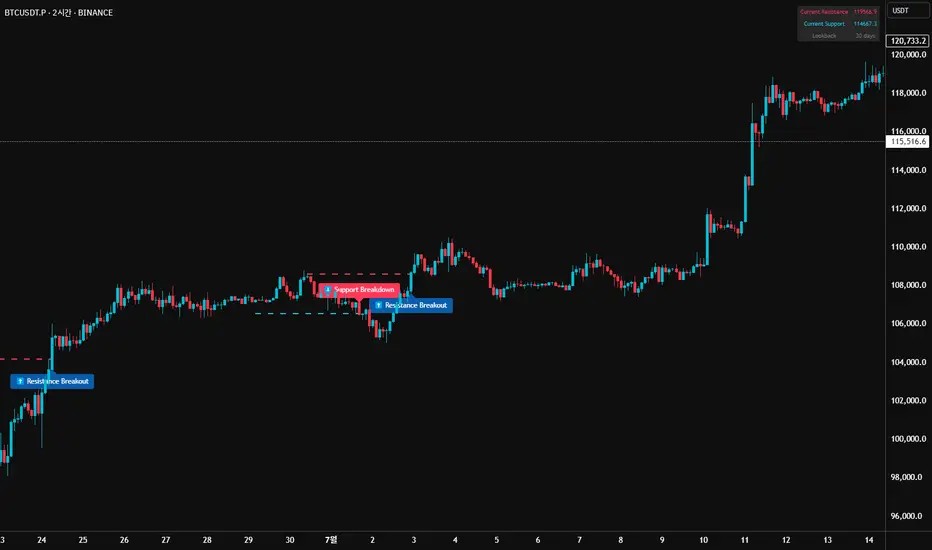
52SIGNAL RECIPE Market Structure Reversal Signals is a technical indicator designed to detect structural changes in price charts and identify potential trend reversals. By tracking highs and lows over a specified period, this indicator provides clear visual signals when significant price breakouts occur, helping traders capture directional changes in the market early.
─────────────────────────────────────
◆ Key Features
• Structural Reversal Detection: Provides potential trend change signals when price breaks through recent N-day highs/lows
• Duplicate Signal Prevention: Filters out consecutive signals in the same direction
• Intuitive Visualization: Clearly distinguishes bullish/bearish reversal signals by color and position on the chart
• Confirmed Bar Based: Generates signals only after bars are completely closed, enhancing reliability
• Customizable Settings: Adjustable tracking period to optimize for various market environments and timeframes
─────────────────────────────────────
◆ Technical Foundation
■ Market Structure Analysis Principle
• High/Low Tracking: Identifies previous highs (LH) and lows (HL) over the specified period
• Structural Breakout: Interprets as structural change when closing price breaks above previous high or below previous low
• Confirmed Bar Verification: Minimizes false signals by generating signals only after the current bar has completely closed
■ Signal Filtering Mechanism
• Signal State Tracking: Prevents duplicate signals by tracking the direction of the last generated signal
• Directional Change Focus: Suppresses signals in the same direction until an opposite signal occurs
• Noise Reduction: Focuses only on important level breakouts, eliminating unnecessary signals
─────────────────────────────────────
◆ Practical Applications
■ Trend Reversal Point Identification
• Bullish Trend Starting Point:
▶ When bullish reversal signal occurs after a downtrend
▶ When upward momentum is confirmed by breaking previous high
• Bearish Trend Starting Point:
▶ When bearish reversal signal occurs after an uptrend
▶ When downward momentum is confirmed by breaking below previous low
• Range Breakout Detection:
▶ Potential trend formation signals when breaking upper/lower boundaries in a ranging market
■ Trading Strategy Application
• Trend Following Strategy:
▶ Consider buy entry when bullish reversal signal occurs
▶ Consider sell entry when bearish reversal signal occurs
• Reversal Trading:
▶ Signals occurring at support/resistance levels provide high-probability entry points
▶ Reversal signals in overbought/oversold conditions strengthen trend reversal possibility
• Risk Management:
▶ Consider closing or reducing positions when opposite signals occur
▶ Set precise stop-loss points by combining with key technical levels
─────────────────────────────────────
◆ Advanced Setting Options
■ Tracking Period (N-day) Adjustment
• Short-term Setting: 10-15 days (sensitive signals, quick reaction, suitable for short-term trading)
• Medium-term Setting: 20-30 days (balanced signals, general trend detection, recommended default)
• Long-term Setting: 40-50 days (strong filtering, detects only major trend reversals, suitable for long-term investment)
■ Timeframe Optimization
• Daily Chart: 20-30 day setting (medium-term trend change detection)
• 4-Hour Chart: 30-40 setting (short-term swing trading signals)
• Hourly Chart: 40-50 setting (intraday trend change detection)
• Intraday Chart: 10-20 setting (scalping and short-term trading)
■ Market Type Adjustment
• High Volatility Markets: Higher N values (30-50) to filter noise
• Trending Markets: Medium N values (20-30) to capture only major reversals
• Ranging Markets: Lower N values (10-20) to capture range-bound movements
─────────────────────────────────────
◆ Synergy with Other Indicators
• Moving Averages: Signal strength enhanced when Market Structure Reversal Signals align with key moving average crossovers
• RSI: Market Structure Reversal Signals occurring at overbought/oversold levels increase reversal probability
• Volume Indicators: Market Structure Reversal Signals accompanied by high volume enhance reliability
• Fibonacci Levels: Market Structure Reversal Signals occurring at key Fibonacci levels provide important turning points
• Channel Indicators: Powerful breakout confirmation when price channel upper/lower breakthroughs coincide with Market Structure Reversal Signals
─────────────────────────────────────
◆ Conclusion
52SIGNAL RECIPE Market Structure Reversal Signals objectively identifies structural changes in the market and clearly visualizes potential trend reversal points. Its simple yet powerful approach of detecting directional changes through recent N-day high/low breakouts provides flexibility applicable to various market environments and trading styles. The duplicate signal prevention mechanism and confirmed bar-based signal generation greatly enhance signal quality and reliability. When combined with other technical indicators, synergy effects can be maximized, providing traders with a valuable tool to capture market turning points early.
─────────────────────────────────────
※ Disclaimer: Past performance does not guarantee future results. Always use appropriate risk management strategies.
═══ 52SIGNAL RECIPE Market Structure Reversal Signals ═══
◆ 개요
52SIGNAL RECIPE Market Structure Reversal Signals는 가격 차트의 구조적 변화를 감지하여 잠재적인 추세 반전을 식별하는 기술적 지표입니다. 이 지표는 최근 N일 동안의 고점과 저점을 추적하여 의미 있는 가격 돌파가 발생할 때 명확한 시각적 신호를 제공함으로써, 트레이더가 시장의 방향성 변화를 조기에 포착할 수 있도록 도와줍니다.
─────────────────────────────────────
◆ 주요 특징
• 구조적 반전 탐지: 가격이 최근 N일 고점/저점을 돌파할 때 잠재적 추세 변화 신호 제공
• 중복 신호 방지: 동일한 방향의 신호가 연속으로 반복되지 않도록 필터링
• 직관적인 시각화: 상승/하락 반전 신호를 차트 상에서 색상과 위치로 명확히 구분
• 확정 봉 기반: 봉이 완전히 종료된 후에만 신호 생성하여 신뢰도 향상
• 사용자 정의 설정: 추적 기간을 조정하여 다양한 시장 환경과 타임프레임에 최적화 가능
─────────────────────────────────────
◆ 기술적 기반
■ 시장 구조 분석 원리
• 고점/저점 추적: 지정된 기간 동안의 이전 고점(LH)과 저점(HL) 식별
• 구조적 돌파: 종가가 이전 고점을 상향 돌파하거나 이전 저점을 하향 돌파할 때 구조적 변화로 해석
• 확정 봉 검증: 현재 봉이 완전히 종료된 후에만 신호 생성하여 오신호 최소화
■ 신호 필터링 메커니즘
• 신호 상태 저장: 마지막 생성된 신호의 방향을 추적하여 동일 방향 신호 중복 방지
• 방향성 전환 초점: 반대 방향 신호가 발생할 때까지 동일 방향 신호 억제
• 노이즈 감소: 중요 수준 돌파에만 집중하여 불필요한 신호 제거
─────────────────────────────────────
◆ 실용적 응용
■ 추세 전환점 식별
• 상승 추세 시작점:
▶ 하락 추세 후 상승 반전 신호 발생 시
▶ 이전 고점 돌파로 상승 모멘텀 확인 시
• 하락 추세 시작점:
▶ 상승 추세 후 하락 반전 신호 발생 시
▶ 이전 저점 이탈로 하락 모멘텀 확인 시
• 범위 돌파 감지:
▶ 횡보 시장에서 상/하 경계 돌파 시 잠재적 추세 형성 신호
■ 트레이딩 전략 적용
• 추세 추종 전략:
▶ 상승 반전 신호 발생 시 매수 진입 고려
▶ 하락 반전 신호 발생 시 매도 진입 고려
• 반전 트레이딩:
▶ 지지/저항 수준에서 반전 신호 발생 시 높은 확률의 진입점 제공
▶ 과매수/과매도 상태에서의 반전 신호는 추세 전환 가능성 강화
• 리스크 관리:
▶ 반대 방향 신호 발생 시 포지션 종료 또는 축소 고려
▶ 주요 기술적 수준과 결합하여 정밀한 손절점 설정 가능
─────────────────────────────────────
◆ 고급 설정 옵션
■ 추적 기간(N일) 조정
• 단기 설정: 10-15일 (민감한 신호, 빠른 반응, 단기 트레이딩에 적합)
• 중기 설정: 20-30일 (균형 잡힌 신호, 일반적 추세 감지, 기본 권장)
• 장기 설정: 40-50일 (강한 필터링, 주요 추세 전환만 감지, 장기 투자에 적합)
■ 타임프레임별 최적화
• 일봉 차트: 20-30일 설정 (중기 추세 변화 감지)
• 4시간 차트: 30-40 설정 (단기 스윙 트레이딩 신호)
• 시간봉 차트: 40-50 설정 (일중 추세 변화 감지)
• 일중 차트: 10-20 설정 (스캘핑 및 단기 거래)
■ 시장 유형별 조정
• 변동성 높은 시장: 높은 N값 (30-50) 설정으로 노이즈 필터링
• 추세 시장: 중간 N값 (20-30) 설정으로 주요 반전만 포착
• 횡보 시장: 낮은 N값 (10-20) 설정으로 범위 내 움직임 포착
─────────────────────────────────────
◆ 다른 지표와의 시너지
• 이동평균선: Market Structure Reversal Signals 신호와 주요 이동평균선 교차 지점이 일치할 때 신호 강화
• RSI: 과매수/과매도 수준에서의 Market Structure Reversal Signals 신호는 반전 가능성 높임
• 볼륨 지표: 높은 볼륨과 함께 발생하는 Market Structure Reversal Signals 신호는 신뢰도 향상
• 피보나치 레벨: 주요 피보나치 레벨에서 발생하는 Market Structure Reversal Signals 신호는 중요한 전환점 제공
• 채널 지표: 가격 채널의 상단/하단 돌파와 Market Structure Reversal Signals 신호 일치 시 강력한 돌파 확인
─────────────────────────────────────
◆ 결론
52SIGNAL RECIPE Market Structure Reversal Signals는 시장의 구조적 변화를 객관적으로 식별하여 잠재적인 추세 전환점을 명확하게 시각화합니다. 최근 N일 고점/저점 돌파를 통해 방향성 변화를 감지하는 단순하면서도 강력한 접근 방식은 다양한 시장 환경과 트레이딩 스타일에 적용할 수 있는 유연성을 제공합니다. 중복 신호 방지 메커니즘과 확정 봉 기반 신호 생성은 신호의 품질과 신뢰성을 크게 향상시킵니다. 다른 기술적 지표와 결합하여 사용할 때 시너지 효과를 극대화할 수 있으며, 트레이더에게 시장의 전환점을 조기에 포착할 수 있는 귀중한 도구를 제공합니다.
─────────────────────────────────────
※ 면책 조항: 과거 성과가 미래 결과를 보장하지 않습니다. 항상 적절한 리스크 관리 전략을 사용하세요.
TZanalyserTZanalyser (Trend Zone Monitor With Trend Strength, Volume Focus And -Events Markers)
Before I used TrendZones to manage my portfolio I used Fibonacci Zone Oscillator as my favorite in the sub panel, accompanied with another subpanel indicator which I never published called IncliValue and also REVE Cohorts.
TZanalyser inherits Ideas and code from all three of them: The visual and the idea of using a channel as the basis for an oscillator depicted as a histogram, is taken from the FibZone Oscillator. The idea of providing a number to evaluate the trend is taken from IncliValue. The idea to create a horizontal line which indicates high and low volume focus completed with markers for volume events, is taken from REVE-cohorts.
These ideas are combined in one sleek visual called TZanalyser. TZ stand for TrendZones, because the histogram is based on it.
The histogram.
Depicted is the distance of the price from COG as percent. The distance between Upper Curve and Lower Curve is used as 100%. The values may reach between 300 and -300. The colors indicate in which zone the candle lives, blue in the blue zone, green in the green zone etc. Despite the absence of a gray zone, there are gray bars. These depict candles that wrap around COG. Because hl2 is used as price, some gray bars point up and others down. The orange and red bars point down because the orange and red downtrend zones are below COG.
Use of the histogram.
Sometimes I need to create a list of stocks which are in uptrend in monthly, weekly and daily charts from the stocks I follow in my universe. This job is done fast and easy by looking at the last bar of the histogram. The histogram also gives a quick evaluation of how the stock fared in the past.
The number.
Suppose I need to allocate some money to another stock, selected a few, looked into news and gurus and they look equally good. Then it is nice to be able to find out which has the best charts. Which one has the strongest uptrend. For this purpose this number can be consulted, because it indicates somehow the strength of the trend. It is an integer between 20 and -20, the closer to 20 the stronger the uptrend, closer to -20 indicates a stronger downtrend. The color of the background is the same as the last column of the histogram.
Volume focus and events
The horizontal lines depict volume focus, the line below the focus that comes with the uptrend columns pointing up, the one above the focus for the downtrend columns pointing down. Thes line have tree colors: maroon for high volume focus, green for normal volume and gray for low volume situations. Between the lines and the histogram triangles appear at volume events, a green triangle when the candle comes with high volume, i.e. 120-200 percent of normal, maroon when extreme volume, i.e. more than 200 percent of normal.
The direction of these triangles is that of the histogram, i.e. when the price is higher, direction is up and vice versa.
Take care and have fun.

Pure Price Action Momentum OscillatorComplete Trading Guide: Pure Price Action Momentum Oscillator
1. Script Overview
What It Does
Tracks real-time momentum strength (bullish/bearish acceleration)
Identifies dynamic support/resistance zones for momentum (not price)
Alerts when momentum breaks or holds critical levels
What It Doesn’t Do
Predict long-term trends (use with trend indicators)
Replace price-based S/R levels (use alongside them)
Work well in extreme choppiness (adjust settings or avoid)
2. Key Features & Components
Feature Purpose Visual Cue
Momentum Histogram Shows strength/direction of price acceleration Color-coded bars
Zero Line Bullish/bearish momentum baseline Gray line (0 level)
Support Zone (Blue) Momentum floor where bounces happen Blue horizontal line
Resistance Zone (Orange) Momentum ceiling where pullbacks start Orange horizontal line
Stateful Alerts Persistent signals until conditions reverse Green/Red labels
3. Best Timeframes & Markets
Market Recommended Timeframe Notes
Stocks 5min - 1H Works best with high liquidity
Forex 15min - 4H Avoid during major news spikes
Crypto 1H - 4H Use with volume confirmation
Futures 5min - 1H Ideal for intraday momentum trades
❌ Avoid: Tick charts, <1min (too noisy), >Daily (loses sensitivity).
4. Confirmation Tools (Must-Use Combos)
A. Trend Confirmation
200 EMA (Price Chart)
Only trade longs if price > 200 EMA + momentum supports
Only trade shorts if price < 200 EMA + momentum confirms
ADX (14)
Use when ADX > 25 (strong trend) + momentum aligns
B. Volume Confirmation
Volume Profile
Enter longs only if momentum breaks resistance at high-volume nodes
VWAP
Buy pullbacks when momentum holds support and price is above VWAP
C. Price Structure
Fibonacci Retracements
Look for momentum breaks at 61.8% Fib levels for high-probability trades
Market Structure (Higher Lows/Lower Highs)
Momentum breakouts work best when price confirms trend
5. Trading Signals & Execution Rules
A. Breakout Trades (High Momentum)
Signal Conditions Action
Resistance Broken Histogram > Orange Zone + Price > Key S/R Enter Long
Support Broken Histogram < Blue Zone + Price < Key S/R Enter Short
Stop Loss:
Longs: 1 tick below nearest swing low
Shorts: 1 tick above nearest swing high
Take Profit:
Trail using the opposite zone (exit long when momentum drops below support)
B. Reversal Trades (Momentum Exhaustion)
Signal Conditions Action
Resistance Holding Histogram rejects Orange Zone + Bearish candle Short Entry
Support Holding Histogram bounces off Blue Zone + Bullish candle Long Entry
Stop Loss:
Beyond the recent swing high/low
Take Profit:
At next key S/R level
6. Advanced Interpretation
A. Divergence Trading
Hidden Bullish Divergence:
Price makes higher low, but momentum makes lower low → Potential reversal up
Hidden Bearish Divergence:
Price makes lower high, but momentum makes higher high → Potential reversal down
B. Session-Based Trading
London Open (3 AM EST): Watch for momentum breaks with volume surge
NY Midday (10 AM - 12 PM EST): Best for trend continuation
Crypto (UTC Midnight): Often sees volatility spikes
7. Risk Management & Position Sizing
Risk per trade: 1-2% of account
Leverage: ≤5x for intraday, ≤2x for swing
Avoid trading:
First 15 mins after major news
Low-volume periods (e.g., forex after 5 PM EST)
8. Pro Tips for Consistency
✅ Wait for Close: Don’t trade wicks, wait for candle close beyond zones.
✅ Combine with Price Action: Only trade if momentum aligns with candlestick patterns (e.g., pin bars, engulfing).
✅ Adjust Lookback: Increase in choppy markets, decrease in trends.
9. Limitations & Fixes
Issue Solution
Whipsaws in choppy markets Increase Min Lookback to 30+
Slow reaction in trends Reduce Max Lookback to 50
False breakouts Require volume confirmation
Final Verdict
This script is best used as a momentum filter – not a standalone system. Combine with:
✔ Trend indicators (200 EMA, ADX)
✔ Volume analysis (VWAP, Volume Profile)
✔ Price structure (S/R, Fibs)

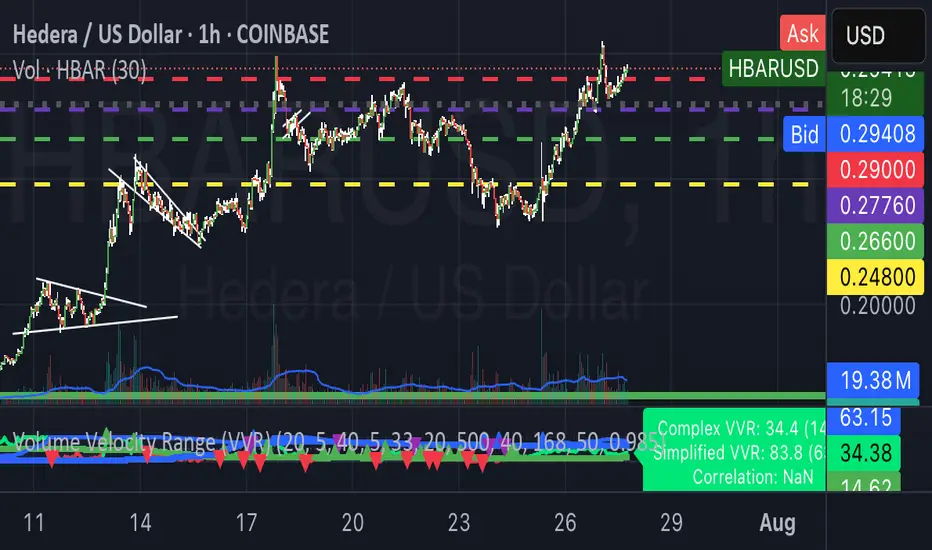
Volume Velocity Range (VVR)Overview
The Volume Velocity Range (VVR) is an advanced momentum oscillator that combines price movement, volume dynamics, and statistical analysis to identify potential trend changes and market extremes. Operating on a 0-100 scale, VVR provides traders with a sophisticated view of market momentum that goes beyond traditional indicators.
Key Components
1. VVR Main Oscillator (0-100)
Measures the velocity of price movement weighted by volume participation
Incorporates advanced normalization techniques to maintain consistency across different market conditions
Green when above the 33rd percentile line (bullish momentum)
Red when below the 33rd percentile line (bearish momentum)
Smoothed calculation reduces noise while maintaining responsiveness
2. Dynamic 33rd Percentile Baseline
Adaptive reference line that adjusts to recent market behavior
Acts as the key threshold for color changes and momentum assessment
Automatically switches calculation method based on:
Crypto (Hourly): 168-period rolling window (7 days)
Stocks (Hourly): Expanding window (all available history)
Daily Timeframe: 20-period rolling for all assets
Three visual styles: Dotted, Step, or Thin line
Triangle markers indicate crossover points
3. Bottom Finder Indicator
Purple line analyzing volume absorption patterns
Measures the relationship between buying/selling pressure and price movement
Helps identify potential accumulation zones and market bottoms
Particularly useful during downtrends and consolidation periods
Visual Features
Trend Status Label
Real-time trend classification from "Strong Accel Up" to "Strong Accel Down"
Color-coded for quick visual reference
Updates dynamically as market conditions change
Fill Zones
Optional transparent fill between VVR and percentile line
Green when VVR is above the 33rd percentile (bullish bias)
Red when below (bearish bias)
Optional Components
VVR Slope indicator (hidden by default) for momentum rate analysis
Symbol type debugging label
ROC calculations available but hidden for advanced users
Trading Applications
Trend Identification
VVR above 33rd percentile (green) suggests bullish momentum
VVR below 33rd percentile (red) indicates bearish pressure
The 50 level serves as a general equilibrium point
Distance from percentile line indicates momentum strength
Reversal Signals
Crossovers of the 33rd percentile line are primary trend change signals
Green-to-red color changes warn of weakening momentum
Extreme readings (>80 or <20) may indicate overbought/oversold conditions
Bottom Finder divergences can signal accumulation
Risk Management
Use 33rd percentile line as dynamic support/resistance
Color changes provide immediate visual momentum shifts
Multiple timeframe analysis for confirmation
Alert Conditions
VVR crossing 50 (midline equilibrium)
VVR crossing 33rd percentile (primary signal)
Trend direction changes
Extreme level alerts (70/30)
Best Practices
For Crypto Trading
Utilizes 7-day rolling window on hourly charts
Adapts to 24/7 market dynamics
Particularly effective for momentum-based strategies
For Stock Trading
Expanding window captures long-term market character
Ideal for swing trading and position entries
Works well with volume-based strategies
Timeframe Considerations
Hourly: Best for short-term momentum trades
Daily: Optimal for swing trading positions
Automatically adjusts calculations based on timeframe
Customization Options
Adjust calculation periods for different trading styles
Toggle visual components based on preference
Color scheme fully customizable
Line styles and fills can be modified
Advanced Features
Intelligent asset detection (crypto vs stocks)
Automatic timeframe optimization
Statistical normalization for consistency
Safety mechanisms prevent extreme readings
This indicator represents a comprehensive approach to momentum analysis, combining traditional technical analysis concepts with modern statistical methods and adaptive calculations. It's designed for traders who need reliable signals across different market conditions and asset classes.
QQE + Signals RNEdited this to do away with larged signals of long and short to small triangles labeld only with QQE text

RSI Multi-Frame Multi-Asset
✅ Key Features:
Multi-Asset: Simultaneously analyze Bitcoin, SP500, Nasdaq, DXY, Gold, Oil, VIX and more
Multi-Timeframe: Configure any timeframe for all RSI calculations
Smart Average RSI: Automatically calculates the mean of all active RSI values
Special Data: Includes Bitcoin Hashrate, 10Y-2Y Spread, and US Interest Rates
Built-in Alerts: Automatic notifications on overbought/oversold crossovers
🎯 Why is it Unique?
Instead of looking at 10 different charts, you get an instant macro view of the market. The average RSI shows you the overall strength/weakness of global markets, while individual RSI values let you identify divergences and specific opportunities.
🚀 Perfect For:
Traders seeking correlations between assets
Global markets macro analysis
Identifying divergences between Bitcoin and traditional markets
Multi-timeframe breakout trading

Inflection PointInflection Point - The Adaptive Confluence Reversal Engine
This is not just another peak and valley indicator; it is a complete and total reimagining of how market turning points are detected, qualified, and acted upon. Born from the foundational concepts explored in systems like my earlier creation, DAFE - Turning Point, Inflection Point is a ground-up engineering feat designed for the modern trader. It moves beyond static rules and simple pattern recognition into the realm of dynamic, multi-factor confluence analysis and adaptive machine learning.
Where other indicators provide a guess, Inflection Point provides a probability. It meticulously analyzes the market's deepest currents—momentum, exhaustion, and reversal velocity—and fuses them into a single, unified "Confluence Score." This is not a simple combination of indicators; it is an intelligent, weighted system where each component works in concert, creating an analytical engine that is orders of magnitude more sophisticated and reliable than any standard reversal tool.
Furthermore, Inflection Point learns. Through its advanced Adaptive Learning Engine, it constantly monitors its own performance, adjusting its confidence and selectivity in real-time based on its recent success rate. This allows it to adapt its behavior to any security, on any timeframe, with remarkable success.
Theoretical Foundation - Confluence Core
Inflection Point's predictive power does not come from a single, magical formula. It comes from the intelligent synthesis of three critical market phenomena, weighted and scored in real-time to generate a single, high-conviction probability rating.
1. Factor One: Pre-Reversal Momentum State (RSI Analysis)
Instead of reacting to a simple RSI cross, Inflection Point proactively scans for the build-up of momentum that precedes a reversal.
• Formulaic Concept: It measures the highest RSI value over a lookback period for peaks and the lowest RSI for valleys. A signal is only considered valid if significant momentum has been established before the turn, indicating a stretched market condition ripe for reversal.
• Asymmetric Sophistication: The engine uses different, optimized thresholds for bull and bear momentum, recognizing that markets often fall faster than they rise.
2. Factor Two: Volatility Exhaustion (Bollinger Band Analysis)
A true reversal often occurs when price makes a final, exhaustive push into unsustainable territory.
• Formulaic Concept: The engine detects when price has significantly pierced the outer Bollinger Bands. This is not just a touch, but a statistical deviation from the mean that signals volatility exhaustion, where the energy for the current move is likely depleted.
3. Factor Three: Reversal Strength (Rate of Change Analysis)
The character of a reversal matters. A sharp, decisive turn is more significant than a slow, meandering one.
• Formulaic Concept: Using a short-term Rate of Change (ROC), the engine measures the velocity of the reversal itself. A higher ROC score adds significant weight to the final probability, confirming that the new direction has conviction.
4. The Final Calculation: The Adaptive Learning Engine
This is the system's "brain." It maintains a history of its past signals and calculates its real-time win rate. This hitRate is then used to generate an adaptiveMultiplier.
• Self-Correction: In "Quality Control" mode, a high win rate makes the indicator more selective, demanding a higher probability score to issue a signal, thereby protecting streaks. A lower win rate makes it slightly less selective to ensure it continues learning from new market conditions.
• The result is a system that is not static, but a living, breathing tool that adapts its personality to the unique rhythm of any chart.
Why Inflection Point is a Paradigm Shift
Inflection Point is fundamentally different from other reversal indicators for three key reasons:
Confluence Over Isolation: Standard indicators look at one thing (e.g., RSI > 70). Inflection Point simultaneously analyzes momentum, volatility, and velocity, understanding that true reversals are a product of multiple converging factors. It answers not just "if," but "why" a reversal is likely.
Probabilistic Over Binary: Other tools give you a simple "yes" or "no." Inflection Point provides a probability score from 0-100, allowing you to gauge the conviction of every potential signal. This empowers you to differentiate between a weak setup and an A+ opportunity.
Adaptive Over Static: Every other indicator uses the same rules forever. Inflection Point's Adaptive Engine means it is constantly refining its own logic based on what is actually working in the current market, on the specific asset you are trading. It is tailored to the now.
The Inputs Menu - Your Command Center
Every setting is a lever of control, allowing you to tune the engine to your precise trading style and market focus.
🧠 Neural Core Engine
Analysis Depth: This is the primary lookback for the Bollinger Band and other core calculations. A shorter depth makes the indicator faster and more sensitive, ideal for scalping. A longer depth makes it slower and more stable, ideal for swing trading.
Minimum Probability %: This is your master signal filter. It sets the minimum Confluence Score required to plot a signal. Higher values (85-95) will give you only the highest-conviction A+ setups. Lower values (70-80) will show more potential opportunities.
🤖 Adaptive Neural Learning
Enable Adaptive Learning Engine: Toggles the entire learning system. Disabling it will make the indicator's logic static.
Peak/Valley Success Threshold (ATR): This defines what constitutes a "successful" trade for the learning engine. A value of 1.5 means price must move 1.5x the ATR in your favor for the signal to be marked as a win. Adjust this to match your personal take-profit strategy.
Adaptive Mode: This dictates how the engine uses its hitRate. "Quality Control" is recommended for its intelligent filtering. "Aggressive" will always boost signal scores, useful for finding more setups in a known, trending environment.
Asymmetric Balance: Allows you to apply a "boost" to either peak (short) or valley (long) signals. If you find the market you're trading has stronger long reversals, you can increase the "Valley Signal Boost" to catch them more effectively.
🛡️ Elite Filters
Market Noise Filter: An exceptional tool for avoiding choppy markets. It counts the number of directional changes in the last 5 bars. If the market is whipping back and forth too much, it will block the signal. Lower the "Max Direction Changes" to be extremely selective.
Volume Filter: Requires signal confirmation from a significant volume spike. The "Volume Multiplier" dictates how large this spike must be (e.g., 1.2 = 20% above average volume). This is invaluable for filtering out low-conviction moves in stocks and crypto.
The Dashboard - Your Analytical Co-Pilot
The dashboard is not just a set of numbers; it is a holistic overview of the market's health and the engine's current state.
Unified AI Score: This section provides the most critical, at-a-glance information. "Total Score" is the current probability reading, while "Quality" gives you a human-readable interpretation. "Win Rate" shows the real-time performance of the Adaptive Engine.
Order Flow (OFPI): This measures the "weight" of money behind recent price moves by analyzing price change relative to volume. A high positive OFPI suggests strong buying pressure, while a high negative value suggests strong selling pressure. It gives you a peek into the market's underlying flow.
Component Analysis: This allows you to see the individual "Peak" and "Valley" confidence scores before they are filtered, giving you insight into building momentum before a signal forms.
Market Structure: This panel assesses the broader environment. "HTF Trend" tells you the direction of the larger trend (based on EMAs), while "Vol Regime" tells you if the market is in a high, medium, or low volatility state. Use this to align your signals with the broader market context.
Filter & Engine Statistics: Available on the "Large" dashboard, this provides deep insight into how many signals are being blocked by your filters and the current status of the Adaptive Engine's multiplier.
The Visual Interface - A Symphony of Data
Every visual element on the chart is designed for instant interpretation and insight.
Signal Markers: Simple, clean triangles mark the exact bar of a valid signal. A box is drawn around the high/low of the signal bar to highlight the precise point of inflection.
Dynamic Support/Resistance Zones: These are the glowing lines on your chart. They are not static lines; they are dynamic levels that represent the current battlefield between buyers and sellers.
Cyber Cyan (Valley Blue): This is the current Support Zone. This is the price level the market is currently trying to defend.
Neural Pink (Peak Red): This is the current Resistance Zone. This is the price level the market is currently trying to break through.
Grey (Next Level): This line is a projection, based on the current momentum and the size of the S/R range, of where the next major level of conflict will likely be. It acts as a potential price target.
Development & Philosophy
Inflection Point was not assembled; it was engineered. It represents hundreds of hours of research into market dynamics, statistical analysis, and machine learning principles. The goal was to create a tool that moves beyond the limitations of traditional technical analysis, which often fails in modern, algorithm-driven markets. By building a system based on multi-factor confluence and self-adaptive logic, Inflection Point provides a quantifiable, statistical edge that is simply unattainable with simpler tools. This is the result of a relentless pursuit of a better, more intelligent way to trade.
Universal Applicability
The principles of momentum, exhaustion, and velocity are universal to all freely traded markets. Because of its adaptive core and robust filtering options, Inflection Point has proven to be exceptionally effective on any security (stocks, crypto, forex, indices, futures) and on any timeframe (from 1-minute scalping charts to daily swing trading charts).
" Markets are constantly in a state of uncertainty and flux and money is made by discounting the obvious and betting on the unexpected. "
— George Soros
Trade with insight. Trade with anticipation.
— Dskyz, for DAFE Trading Systems

Ehlers Two-Pole StochasticThis indicator implements John Ehlers' Two-Pole Stochastic Filter, a smoother alternative to the traditional stochastic oscillator. Instead of relying on raw %K values, it applies a second-order IIR filter (recursive smoothing) to reduce noise and improve trend clarity.
It outputs a single line oscillating between 0 and 1, with less lag and false signals compared to standard stochastic implementations.
Key Features:
Uses a two-pole filter to smooth the normalized stochastic (%K).
Ideal for detecting clean reversals and trend continuations.
Designed for minimal visual noise and greater signal confidence.
Interpretation:
Values near 1.0 may suggest overbought conditions.
Values near 0.0 may suggest oversold conditions.
Crosses above 0.5 can signal bullish shifts, and below 0.5 bearish shifts.
Recommended Settings:
Default smoothing factor (alpha) is 0.7 — higher values make the output more responsive, while lower values smooth further.
Inspired by concepts from Cybernetic Analysis for Stocks and Futures by John F. Ehlers.
Quantum Harmonic Oscillator Overlay🧪 Quantum Harmonic Oscillator Overlay
A visual model of price behavior using quantum harmonic oscillation principles
📜 Indicator Overview
The Quantum Harmonic Oscillator Overlay applies concepts from both classical physics (harmonic motion) and quantum mechanics (energy states) to model and visualize how price orbits around a central trend line. It overlays a Linear Regression line (representing the “mean position” or ground state of price) and calculates surrounding energy levels (σ-zones) akin to quantum shells that price can "jump" between.
This indicator is particularly useful for visualizing mean reversion, volatility compression/expansion, and momentum-driven price breakthroughs.
🧠 Core Concepts
Linear Regression Line (LSR): This is the calculated center of gravity or equilibrium path of price over a user-defined period. Think of it like the lowest energy state or central axis around which price vibrates.
Standard Deviation Zones (σ-levels):
1σ: The majority of normal price activity; within this range, price tends to fluctuate if in balance.
2σ: Indicates volatility or possible breakout pressure.
3σ: Represents extreme movement — a phase shift in energy, potentially leading to reversal or continuation with higher momentum.
Quantum Analogy: Just like in a quantum harmonic oscillator, particles (here, prices) move probabilistically between discrete energy states. The further the price moves from the center, the more "energy" (momentum, volume, volatility) is implied.
⚙️ Input Parameters
Setting Description
Linear Regression Length The number of bars used to calculate the regression trend (default 100). Affects the central path and responsiveness.
σ Multipliers (1σ, 2σ, 3σ) Determine how far each band is from the regression line. Adjusting these can highlight different price behaviors.
Show Energy Level Zones Toggle visibility of the colored bands around the regression line.
Show LSR Center Line Toggles visibility of the white Linear Regression line itself.
🎨 Visual Components
Color Zone Interpretation
✅ Green ±1σ Normal oscillation / mean reversion area. Ideal for range-bound strategies.
🟧 Orange ±2σ Warning zone; price may be gaining momentum or volatility.
🔴 Red ±3σ High-momentum state or anomaly. These regions may imply trend exhaustion, reversals, or breakouts.
White Line: The LSR — the average trajectory of the price movement.
Pink Dots: Appear when price exceeds Zone 3 (outside ±3σ) — a signal of extreme behavior or a possible regime shift.
📈 How to Use This Indicator
1. Detect Overextensions
When price touches or breaches the 3σ zone, it is likely overextended. This can be used to anticipate potential snapbacks or strong breakout trends.
2. Identify Mean Reversion Trades
If price exits the 2σ or 3σ zones and returns toward the center line, this signals a likely mean reversion setup.
3. Volatility Compression or Expansion
Flat zones between σ levels suggest calm markets; widening bands suggest expanding volatility.
4. Use with Confirmation Tools
Combine with momentum oscillators (MACD, RSI) or volume-based signals to confirm reversals or continuation outside Zone 3.
🔮 Philosophical Note
This indicator embodies the metaphor that the market behaves like a quantum oscillator — price particles exist in a probabilistic field and jump between discrete zones of volatility and energy. Tracking these transitions allows the trader to see price behavior as rhythmic, wave-like, and multidimensional rather than purely linear.

Trend Strength Oscillator📌 Trend Strength Oscillator
📄 Description
Trend Strength Oscillator measures the directional strength of price relative to an adaptive dynamic trend band. It evaluates how far the current price is from the midpoint of a trend channel and normalizes this value by recent volatility range, allowing traders to detect trend strength, direction, and potential exhaustion in any market condition.
📌 Features
🔹 Adaptive Trend Band Logic: Uses a modified ATR and time-dependent spread formula to dynamically adjust upper and lower trend bands.
🔹 Trendline Midpoint Calculation: The central trendline is defined as the average between upper and lower bands.
🔹 Relative Positioning: Measures how far the close is from the center of the band as a percentage.
🔹 Range Normalization: Uses a normalized range to account for recent volatility, reducing noise in the oscillator reading.
🔹 Oscillator Output (±100 scale):
+100 indicates strong bullish momentum
-100 indicates strong bearish momentum
0 is the neutral centerline
🛠️ How to Use
✅ Trend Strength > +50: Indicates a strong bullish phase.
✅ Trend Strength < -50: Indicates a strong bearish phase.
⚠️ Crossing above 0: Potential bullish trend initiation.
⚠️ Crossing below 0: Potential bearish trend initiation.
📉 Values near 0: Suggest trend weakness or ranging conditions.
Best suited timeframes: 1H, 4H, Daily
Ideal combination with: RSI, MACD, volume-based oscillators, moving average crosses
✅ TradingView House Rules Compliance
This indicator is written in Pine Script v5 and fully open-source.
The script does not repaint, does not generate false alerts, and does not access external or private data.
It is intended strictly as a technical analysis tool, and not a buy/sell signal generator.
Users are encouraged to combine this tool with other confirmations and independent judgment in trading decisions.
=========================================================
📌 Trend Strength Oscillator
📄 설명 (Description)
Trend Strength Oscillator는 가격이 동적 추세 밴드 내 어디에 위치해 있는지를 정량적으로 분석하여, 추세의 방향성과 강도를 시각적으로 보여주는 오실레이터 지표입니다. 최근 변동성을 반영한 밴드를 기반으로 가격 위치를 정규화하여, 과매수·과매도 상태나 추세의 소멸 가능성까지 탐지할 수 있도록 설계되었습니다.
📌 주요 특징 (Features)
🔹 적응형 추세 밴드 계산: ATR과 시간 경과를 기반으로 상단/하단 밴드를 동적으로 조정
🔹 중심 추세선 산출: 상단과 하단 밴드의 평균값을 중심선으로 활용하여 기준 축 제공
🔹 상대 위치 계산: 현재 종가가 중심선에서 얼마나 떨어져 있는지를 정규화하여 추세 강도 계산
🔹 변동성 기반 정규화: 최근 밴드 범위를 기준으로 상대 거리를 0~100 사이 값으로 변환
🔹 오실레이터 출력 (범위: ±100):
+100에 가까울수록 강한 상승 추세
-100에 가까울수록 강한 하락 추세
0에 가까울수록 횡보 구간 가능성
🛠️ 사용법 (How to Use)
✅ +50 이상: 강한 상승 추세 지속 중
✅ -50 이하: 강한 하락 추세 지속 중
⚠️ 0선 돌파 상향: 상승 추세 시작 가능성
⚠️ 0선 돌파 하향: 하락 추세 시작 가능성
🟡 0 근처 유지: 추세 약화 또는 횡보장 가능성
추천 시간대: 1시간봉, 4시간봉, 일봉
보조 지표로 추천: RSI, MACD, OBV, 이동평균 크로스 등과 함께 활용 시 효과적
✅ 트레이딩뷰 하우스룰 준수사항 (TradingView House Rules Compliance)
본 지표는 Pine Script v5로 작성된 오픈소스 공개용 스크립트입니다.
리페인트(Repaint) 현상이 없으며, **허위 경고(Spam Alerts)**나 성능 저하 요소도 없습니다.
외부 데이터 접근 없이 완전히 자체 계산으로 동작합니다.
이 지표는 투자 판단을 돕기 위한 분석용 도구이며, 직접적인 매수·매도 신호로 사용해서는 안 됩니다.
모든 트레이딩은 사용자의 독립적인 판단과 책임 하에 이루어져야 합니다.

Mongoose Capital: BTC ETF DriftScope ProMongoose Capital: BTC ETF DriftScope Pro
A proprietary indicator for monitoring drift between Bitcoin Spot (BTCUSD) and Bitcoin Spot ETFs (such as IBIT). Designed to detect ETF premium/discount zones and generate actionable Fade or Long bias signals.
What it Does
Tracks IBIT and BTCUSD spread to highlight ETF price deviations.
Calculates correlation Z-Score for ETF/Spot alignment.
Outputs numeric bias signals: Fade (1), Long (1), Neutral (1).
How to Use
Apply to a BTCUSD chart (4H, 1D, or higher recommended).
Open the Data Window to view:
IBIT Spread %
Correlation Z-Score
Correlation %
Bias Flags (Fade, Long, Neutral)
Configure alerts for Fade and Long Bias conditions.
Confirm all signals with your trade plan and risk management.
Methodology
This tool calculates the percentage spread between IBIT and BTC Spot. A rolling Z-Score of the correlation is used to detect periods of significant divergence.
Fade Bias suggests potential short setups in premium zones with high Z-Scores.
Long Bias suggests potential long setups in discount zones with low Z-Scores.
Disclaimer
This indicator is for educational purposes only. It is not financial advice. Use at your own risk and verify signals independently.

Zero-Lag RSI DivergenceZero-Lag RSI Divergence
Overview
This indicator identifies RSI divergences in real-time without delay, providing immediate signals as price-momentum discrepancies develop. The indicator analyzes price action against RSI momentum across dual configurable periods, enabling traders to detect potential reversal opportunities with zero lag.
Key Features
Instant Divergence Detection : Identifies bullish and bearish divergences immediately upon formation without waiting for candle confirmation or historical validation. This eliminates signal delay but may increase false signals due to higher sensitivity.
Dual Period Analysis : Configure detection across two independent cycles - Short Period (default 15) and Long Period (default 50) - allowing for multi-timeframe divergence analysis and enhanced signal validation across different market conditions.
Visual Divergence Lines : Automatically draws dashed lines connecting divergence points between price highs/lows and corresponding RSI peaks/troughs, clearly illustrating the momentum-price relationship.
Customizable RSI Parameters : Adjustable RSI length (default 14) allows optimization for different market volatility and trading timeframes.
How It Works
The indicator continuously monitors price action patterns and RSI momentum:
- Bullish Divergence : Detected when price makes lower lows while RSI makes higher lows, suggesting potential upward momentum
- Bearish Divergence : Identified when price makes higher highs while RSI makes lower highs, indicating potential downward momentum
The algorithm uses candle color transitions and immediate RSI comparisons to trigger signals without historical repainting , ensuring backtesting accuracy and real-time reliability.
How To Read
Important Notes
Higher Signal Frequency : The zero-lag approach increases signal sensitivity, generating more frequent alerts that may include false signals. Consider using additional confirmation methods for trade entries.
Non-Repainting : All signals are generated and maintained without historical modification, ensuring consistent backtesting and forward-testing results.
Input Parameters
RSI Length: Period for RSI calculation (default: 14)
Short/Long Periods: Lookback periods for divergence detection (default: 15/50)
Line Colors: Customizable colors for short and long period divergence lines
Label Settings: Optional divergence labels with custom text
This indicator is designed for traders seeking immediate divergence identification across multiple timeframes while maintaining signal integrity and backtesting reliability.

RSI PotentialRSI Potential
This indicator does more than just track RSI; it measures the "energy" or "fuel" left in a trend. It answers a critical question: how much further can the price move before momentum is exhausted?
The key insight is that high momentum often means low potential, and vice versa. This inverse relationship is what allows the indicator to provide powerful, forward-looking signals about trend health and potential reversals.
Think of it like a race car:
Momentum is the car's current speed.
Potential is the amount of fuel left in the tank.
A car at top speed (high momentum) is burning fuel rapidly (potential is decreasing). A car just starting (low momentum) has a full tank of fuel (high potential). This indicator helps you see the fuel gauge, not just the speedometer.
This indicator plots three distinct components in a separate pane below your chart:
1. Upside Potential (Green Line)
What it shows: The percentage price increase required to hit the Overbought RSI Level. In other words, how much "fuel" is left for the upward trend.
How to interpret it:
Low Value (Approaching Zero): This is a warning sign. It means the price is already in high gear, and there is very little room left to run before hitting overbought exhaustion. Even if the price is rocketing up (high momentum), low potential signals the rally is likely on its last legs.
High Value: This indicates the market has a full tank of fuel for a rally. Even if the price is moving sideways or slowly (low momentum), the high potential suggests that if a new uptrend starts, it has the energy to be sustainable and significant.
2. Downside Potential (Red Line)
What it shows: The percentage price decrease required to hit the Oversold RSI Level—the "fuel" for a downtrend.
How to interpret it:
Low Value (Approaching Zero): A warning for bears. The price may be dropping fast (high momentum), but it's running out of energy to fall further. This signals seller exhaustion and increases the probability of a bounce or reversal.
High Value: The market has significant room to fall before becoming oversold. This can confirm the health of a new downtrend or suggest that a current downtrend has more to go.
3. Net Potential (Columns / Histogram)
What it shows: The net balance of energy: Upside Potential - Downside Potential. It answers, "Which side has more fuel in the tank?"

Intelligent Top & Bottom Finder v9.8 Keyvankh📈 Intelligent Top & Bottom Finder v9.8 Keyvankh
A next-generation all-in-one trading system for precise tops, bottoms, and reversals across all timeframes.
---
🟢 Overview
This indicator is a powerful and intelligent solution for detecting market tops and bottoms, key reversals, and S/R zones with institutional-grade accuracy. Designed for traders seeking an edge in any market (crypto, forex, stocks), it combines advanced candlestick recognition, multi-indicator confirmation, smart support/resistance clustering, and strict signal filtering into one seamless tool.
---
🔎 How Does It Work?
1. Advanced Support & Resistance Clustering
Automatically detects and draws high-probability support and resistance zones using dynamic ATR-based pivot clustering.
Highlights breakouts and retest (flip) zones in real-time, adapting to changing market structure.
2. Full Candlestick Pattern Recognition
Scans for 15+ classic and advanced patterns: Engulfing, Pin Bar, Doji, Three Bar, Marubozu, Hammer, Shooting Star, Three White Soldiers, Three Black Crows, Tweezer, Morning/Evening Star, Kicker, Belt Hold, and more.
Scores each pattern’s strength based on location (S/R zone, retest, breakout), volume context, and confirmation signals.
3. Multi-Indicator Confirmation Engine**
Integrates and scores confirmation from up to five additional sources:
RSI Games 1.2** (smoothed LTF momentum shifts)
MACD Divergence** (bullish/bearish momentum reversal)
QQE+ v7 Advanced** (dynamic volatility filter)
OBV Trend Filter** (volume-backed trend validation)
Volume Game** (net volume spike and reversal detection)
Each module can be enabled or disabled to fit your personal trading style.
4. Institutional S/R and Retest Logic
Real-time recognition of major trendline breaks, retest zones, and price flips.
Automatic labeling and coloring of S/R zones, retest boxes, and confirmation candles.
5. Smart Buy & Sell Signal Generation**
Combines all scoring modules with strict logical filters and “failsafe override” logic (guaranteeing signal on confirmed hammers, engulfings, etc. even if other filters disagree).
Plots clear “BUY” and “SELL” labels only when a strong, multi-factor signal appears—minimizing noise and maximizing reliability.
Built-in fallback logic (optional) for edge cases.
6. Alerts & Automation Ready
TradingView alerts for all BUY, SELL, or ANY signal conditions—perfect for auto-trading or notification setups.
---
*⚙️ Customizable Inputs
Enable/Disable any module (RSI Games, MACD, OBV, QQE+, Candlestick Scanner, Volume Game)
Minimum Confirmations** required for a signal (1–10)
Pivot/Zone Sensitivity:** ATR multiplier, pivots per cluster, retest bar duration
LTF (Lower Timeframe) Confirmation:** Fully configurable
---
📊 How To Use**
Apply on any timeframe and symbol**—crypto, stocks, forex, indices.
Use as a **standalone reversal/entry tool** or to confirm your own technical setups.
Combine with your favorite momentum, trend, or volume indicators for advanced confluence.
Set up **TradingView alerts** for auto-trading, Telegram/email notifications, or trade journaling.
---
🟢 What Makes This Unique?
All-in-one multi-indicator fusion:** No more juggling a dozen scripts.
Institutional logic:** Goes beyond basic signals with true S/R, retest, and volume logic.
Full transparency:** Source code is clear and commented (if published open-source).
Fast and reliable:** Optimized for minimal lag and maximum accuracy.
---
⚠️ Disclaimer**
This indicator is a tool to assist with trade timing and risk management. **No system is 100% accurate.** Always use in conjunction with your own analysis and risk management practices.
---
📚 Credits & License**
Created by Keyvan Khodakhah.
You may use, modify, or share this script under the (mozilla.org).
Please credit the original author if you fork or reuse in public.
---
Questions, feedback, or collaboration? Contact: Keyvankh
---
Precision in technical analysis comes from layers of confluence and discipline. This tool brings that precision to your chart.

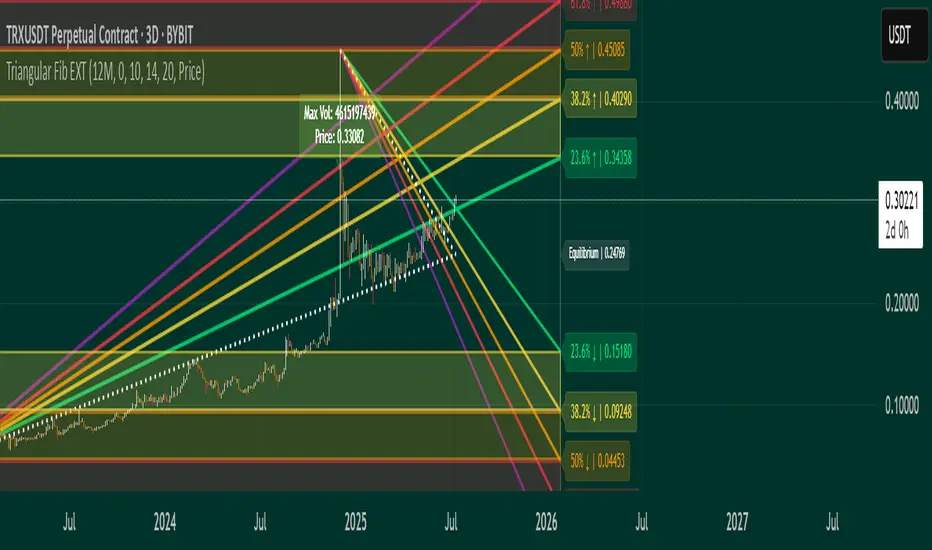
Triangular Fib🔍 Features
- Dynamic Lookback & Projection: Automatically adjusts the range and projection horizon based on timeframe changes.
- Triangular Fibonacci Arms: Projects fib levels upward and downward from high/low extremes to highlight potential price inflections.
- Volatility-Shaded Equilibrium: Visual zone highlights areas of consolidation or energy buildup before breakouts.
- Breakout Alerts: Detects and signals bullish/bearish breakouts from triangular fib thresholds.
- Auto-Traced Triangle Wedge: Dotted wedge lines visually represent narrowing price action from range extremes to midpoint.
Ideal for traders who seek visual clarity, price symmetry, and alert-driven decision-making across multiple timeframes. Whether you're swing trading or intraday scouting, this script provides a richly layered roadmap of market potential.
Not financial advice.