[astropark] Nova Bands V2Dear followers,
today an upgraded version of Nova Bands indicator, here below the previous V1
This is a great analysis and scalping tool for day trading on low timeframes (5-15 minutes) or to plan swing trades on hourly timeframes. It can be used also on high timeframes just for analysis current market trend.
The indicator plots a series of levels which create a nice bands flow.
The slope of levels make you easily understand when price is in consolidation, in uptrend or in downtrend.
The golden rule is always the same: buy low and sell high .
This indicator plots:
3 "price is low here" levels (from dark green to light green)
3 "price is average here" levels
3 "price is high here" levels (from purple to orange)
You can find more details on how to use the indicator in the description of V1.
Please, always remember that:
when bands are flat, price is in consolidation and this is best condition to trade with nova bands
when bands get nearer and nearer is called "Bands Squeeze": price is next to a main breakout move, volatility is coming!
The basic improvement in V2 is a different way to calculate the bands based on different timeframe resolution, default is setup to daily timeframe for example.
A trader who wants to be a winner must understand that money and risk management are very important, so manage your position size and always have a stop loss in your trades.
This is a premium indicator , so send me a private message in order to get access to this script.
COMPRA
Long Short | Buy Sell IndicatorThis indicator is based on an adaptive RSI. You can change one setting, the period. The period means, how many past bars are included in the calculation of the indicator. Be aware, that the period needs to be the same or less than the available past bars of your trading pair. The indicator works on every timeframe. The past data bars are repainted, but the real time indicator should just give you valid buy and sell alarms.
The indicator includes:
- buy / long signals
- sell / short signals
- buy and sell prices
- results of trades
- alarms for buy and sell
Please try it out at first with no money or something. Just set alerts for buy and sell and check the performance of the indicator afterwards, maybe it is a good strategy for you with your settings.
Greetings,
snurk
Long RSIThe RSI is a technical indicator generally used with the general setting being 14 days, and often shorter.
The accepted view is that a level of 70 indicates overbought conditions, and 30 indicates oversold conditions.
A short RSI setting will give signals quite often, and they might sometimes contradict each other.
As a individual investor, perhaps with a background in fundamental analysis, the RSI might be overlooked for other fundamental metrics.
But the idea here is that longer RSI settings can be used for investing.
The problem that arises is how to know when the indicator has reached a level that is either overbought or oversold.
This script solves that by using a specific look back period (selectable, but the standard is 1 year), and plotting the highest/lowest value that the RSI has had for that time period.
The idea is that a buy signal occurs when the indicator is at a 'historic' low, and a sell signal occurs when it at its 'historic' high.
Since you generally want to buy when the indicator is at its low, and has stopped decreasing, the script comes with a function that shows you when yesterdays value reached a historic low, but todays value is higher than yesterday.
This is shown by a color change of the background to green. The same is true, but opposite, for sell signals and then the background turns red.
THIS IS NOT TRADING ADVICE, AND YOU SHOULD ALWAYS DO YOUR OWN RESEARCH
GOOD LUCK AND HAPPY TRADING

TM24_INVESTMENT_TOOLTM24_INVESTMENT_TOOL helps to identify following Things for Intraday Position on 60 Minutes + timeframe along with Buy or sell signal.
1. Market Trend (Different Timeframe)
2. Price Direction
3. Area of Support & Resistance
4. Price Momentum
Terminology Use ==> Black from Bottom for - Buy, Red from Top for - Sale Signal, and Numbers are to show time frame indication there is presence of buyer or seller like 30 for buy signal on 30 minute time frame etc.
Display and Interpretation ==> Buy Sale Signal in Digit with 15-30-60-D-W-M for different time frames.
any value signal ending with * shows breakout of support/ resistance and value signal starting with * shows entry to a momentum zone.
Green Mark with Triangle Up shows trend of that timeframe in positive and value shows upside possible direction on that timeframe vice versa for red signal with down triangle
Use market structure, chart pattern, trend lines for more support..
Time frame ==> Use proper Signal with 60 minute, 120 minute time frame
What to Identify ==> Overall Trend for the Swing
How to Use ==>
See how and order buildup is seen and current order position. Also area for volatility and expected movement in price direction
Note: - Use market structure, chart pattern, trend lines and price action parameter for more confirmation.
Entry ==>
Let’s wait the proper area of support or resistance ( Area of Value in case of trend pattern use)
Exit ==>
SL of swing high/low out of market structure with proper risk management and target with proper Risk/ Reward Ratio
Use the Below Contacts to Access this Indicator

Low volatility Buy w/ TP & SL (Coinrule)The compression of volatility usually leads to expansion. When the breakout comes, it can ignite strong trends. One way to catch a coin trading in an accumulation area is to spot three moving averages with values close to each other. The strategy uses a combination of Moving Averages to spot the best time to buy a coin before its breakout.
Buy Condition
The MA200 is greater than the MA100
The MA50 is greater than the MA100
According to backtesting results, the 1-hour time frame is the best to run this strategy.
Sell Condition
Take Profit: the price increases 8% from the entry price
Stop Loss: the price drops 4% from the entry price
The strategy has a profitability of 40-60% (depending on the market conditions). Having a ratio of two between Take profit and Stop Loss helps keeping the strategy profitable in the long term.

Wilder's Volatility Trailing Stop Strategy with various MA'sFor Educational Purposes. Results can differ on different markets and can fail at any time. Profit is not guaranteed.
This only works in a few markets and in certain situations. Changing the settings can give better or worse results for other markets. This strategy is based on Wilder's Volatility System. It is an ATR trailing stop that is used for long term trends. This strategy focuses on the trailing stop alone and goes long and short only when it goes above or below the trailing line. It is similar to Donchian channels except it does not include the certain period channel breakout, only the trailing signal. This is only the trailing stop and an attempt to show how well it works standalone as Wilder described.
In his book, Wilder recommends a multiplier of 2.8-3.1 and an ATR lookback of 7 periods along with a running moving average or otherwise known as Wilder's moving average. The calculation and programming part for the trailing stop varies everywhere. I opted to keep it as simple and accurate as I could think of and interpret from the book. The variations to these types of indicators are numerous unfortunately, but Wilder seems to be the original author of ATR and this ATR-based trailing stop. In his book he says to use the significant closing price or highest/lowest closing price for the calculation part but I also included the option of choosing the highest high and lowest low, and the option to choose various moving averages in case anyone wants to experiment.
Comparing this and Donchian channels, it seems that a 2.5 multiplier is somewhat similar to the middle band of DCs and a 3.0 multiplier is somewhat similar to a double length middle band of DCs. It's hard to say which is the better trailing stop for a long term strategy. It's hard to beat the simplicity of DCs but maybe some might find a need for more inputs in a trailing stop or maybe an ATR based one like Wilder's can work better depending on what setting or strategy it's used in.

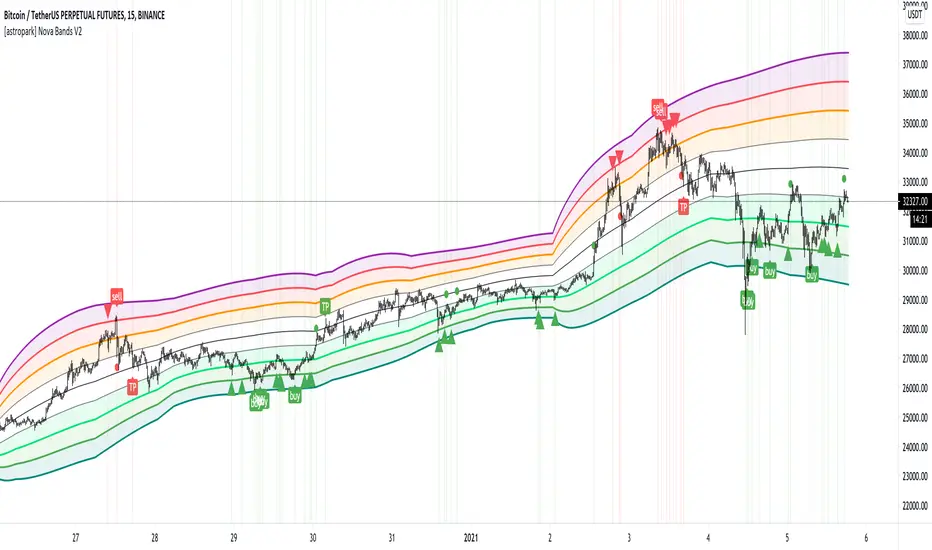
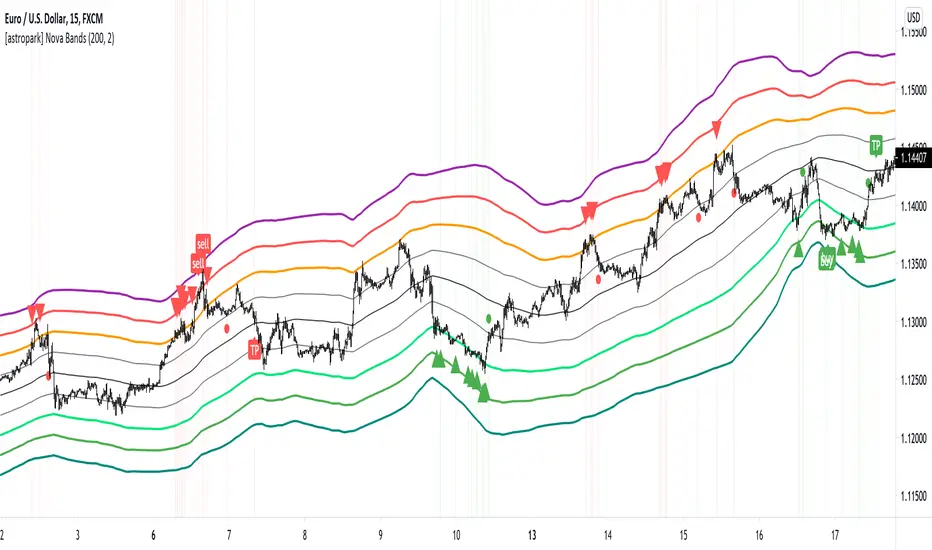
[astropark] Nova BandsDear followers,
today a new analysis and scalping tool for day trading on low timeframes (5-15 minutes) or to plan swing trades on hourly timeframes. It can be used also on high timeframes just for analysis current market trend.
The indicator plots a series of levels which create a nice bands flow.
The slope of levels make you easily understand when price is in consolidation, in uptrend or in downtrend.
The golden rule is always the same: buy low and sell high .
This indicator plots:
3 "price is low here" levels (from dark green to light green)
3 "price is average here" levels
3 "price is high here" levels (from purple to orange)
When bands are flat, price is in consolidation and this is best condition to trade with nova bands.
When price reaches higher bands, you will open a short position with targets below levels, fully closing your position when price hits the average level (black).
Here an example on Bitcoin on 15m using 1h resolution:
The same applies when price reaches lower bands, you will open a long position with targets above levels, fully closing your position when price hits the average level (black).
When bands get nearer and nearer is called "Bands Squeeze": price is next to a main breakout move, volatility is coming!
Here an example of SPX500: after long consolidation and bands getting nearer and neared, we had the breakout, downwards in this case.
In this screenshot you can see what signals algorithm provided:
Our suggestion is to play safe these kind of scenarios, no reason to FOMO buy/sell. Just wait for price consolidation / getting back inside the bands.
For example you would have skip first three buy signals, while you would have longed the last two as price came back inside bands after the big volatility which made price went below bands.
Another example is TSLA stock on 15m with 1h resolution:
Price touched the first bullish level and made a big move upwards, breaking bands with a +90% move.
In this case, you would have skipper first 2 sell signals, while you would have accepted next two with stoploss above recent high.
Acceptable also the other two sell signals, which you may have closed when price retraced to lower levels:
You can of course run trends like this buying on price hitting bullish/lower levels after a long consolidation and sell on price hitting middle and higher levels:
A trader who wants to be a winner must understand that money and risk management are very important, so manage your position size and always have a stop loss in your trades.
Here some examples how the indicator works on different markets:
EURUSD 15m with standard settings and 1h resolution
GOLD (XAUUSD) 15m with standard settings and 1h resolution
Facebook (FB) 15m with standard settings and 1h resolution
This is a premium indicator , so send me a private message in order to get access to this script.
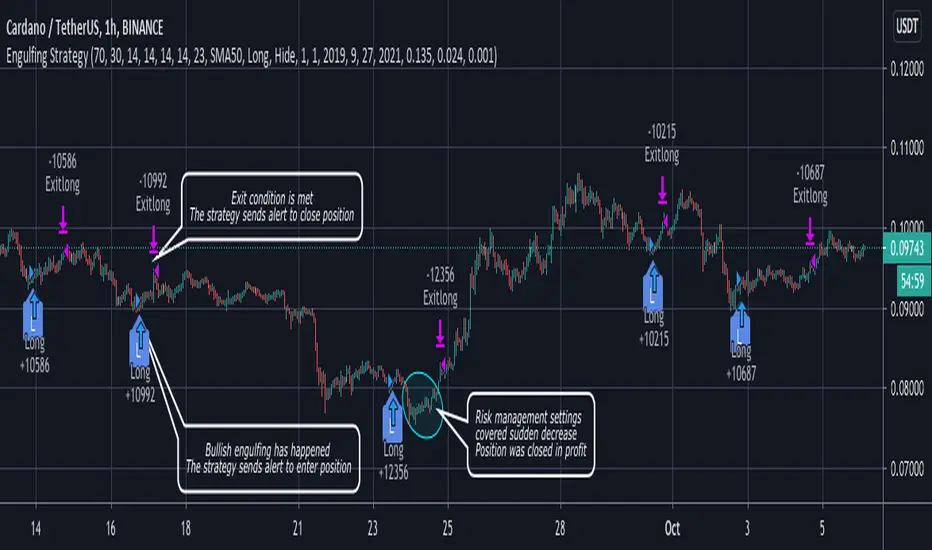
Engulfing strategy with DMI confirmationThe strategy contains Bearish and Bullish Engulfing trend reverse alerts with entry and closure notifications. Entries are enforced by Directional Movement Index (DMI) indicator levels combination. The strategy can be applied to spot, futures and marginal trading exchanges. It is suitable for both long and short positions and works accurately with BTC, USDT, ETH and BNB quote currencies. Best to use with 1H timeframe charts
Strategy elements can be configured at your own desire with user interface settings, no programming skills required:
1. Choose signals type: Long, Short or Both
2. Choose trend detection pattern rule:
SMA50 - provides a higher number of positions
SMA50 + SMA200 provides a higher accuracy
3. Change risk management settings to make the most accurate and efficient configuration. You can set up unique stop loss, take profit and trailing offset for different assets
4. Configure strategy periods
DMI and ADX lengths
ADX Smoothing
Key level
EMA and SMA lengths
5. Configure backtest dates
6. Show or hide RSI support and resistance bands
Engulfing strategy provides information for traders to enter the market in anticipation of a possible reversal in trend. Engulfing candles tend to signal a reversal of the current trend in the market. This specific pattern involves two candles with the latter candle "engulfing" the entire body of the candle before it. The engulfing candle can be bullish or bearish depending on where it forms in relation to the existing trend. The script calculates and compares values of the price action candles to define is there an engulfing and what type it is: bullish or bearish
If there is a bullish engulfing the indicator fills price action candle with yellow color
If there is a bearish engulfing the indicator fills price action candle with purple color
Advantages of the script:
1. The script detects presence of both types of engulfing: Bullish and Bearish
2. Weak engulfment signals and market noises are filtered by RSI bands and DMI confirmations. This allows to receive only strong and confirmed engulfment signals
3. This script has configurable risk management settings (order size, commission, take profit, stop loss and trailing). This provides you opportunity of direct broker connection and allows to conduct backtests before applying the strategy to real account. You also can set up strategy actions alerts
At the chart you can see the historical price action of ADAUSDT at Binance exchange from the January 1st 2019 till current date. The strategy is set up to receive only long signals because it is a spot market. Moments when the strategy triggered to enter a position are shown as L label while position entries are shown as "Long" messages. Moments when a certain position should be closed are shown as "Exitlong" messages
The strategy demonstrate high backtest results:
Mathematical expectation of risk management settings is positive = 1.34%
Percent profitable = 93.33%
Profit factor = 3.253
Quantity of entries = 75
Net profit = 15.22%
How to use?
Long signals:
1. Apply indicator to a trading pair your are interested in.
2. Click Settings button and select Alert Positions Type Long
3. Once bullish engulfing and confirmation conditions are met price action candle will be colored yellow and script strategy will enter a position.
4. Check Strategy Tester to set up optimal Risk management settings: stop loss, trailing profit activation point, trailing offset
5. Set up the strategy alert to be notified when a position should be opened or closed
Short signals:
1. Apply indicator to a trading pair your are interested in.
2. Click Settings button and select Alert Positions Type Short
3. Once bearish engulfing and confirmation conditions are met price action candle will be colored purple and script strategy will enter a position.
4. Check Strategy Tester to set up optimal Risk management settings: stop loss, trailing profit activation point, trailing offset
5. Set up the strategy alert to be notified when a position should be opened or closed
Best regards,
SkyRock Signals team
If you want to receive access to the strategy please contact us in personal message!
PWTPROv5 TrendIndicator with LONG/SHORT BTC ETH alerts
This PWTPRO indicator is based on VWAP , MACD and EMAs
Best fits for BTC /USDT and ETH/USDT trading for 1H timeframe for positional trading (3-5 trades per week)
15min TF is good for intraday scalping. 4H is good for longterm. Fits for any coin, forex, metals, oil and bonds.
There are 4 types of entries, 1,3 and 4 are on by default. It's more accurate. Rest you can test.
Warning. Not yet works with huge trend continuation. Use it manually with you own risk management, don't forget stop-losses.
Show take profits and stop-loss (It's off by defaults)
You can now add 3 take-profit and 1 stop-loss labels on chart in %
Use 0 values to remove any of them from the charts.
New option: Show entering position price as label
Minor visual improvements with price labels (y position is now correctly above/below bars)
+added new option to round prices for integer values (i.e. 9251 for btc instead of 9251.35) off by defaults and now fits for altcoins and any asses that has price below 1 (usd, btc etc)
This is invite only script. PM me if you want to test it.

Value investingwhen this indicator goes under value 8 it means it's stock or index at her best value.
condition is stock in strong up trend.
it not provide buy or sell signal or any direction of trend.
if you are looking for investing for long term and your are confusing were to enter it provide best value of stock or index for investing.
use bigger time frame.
recommended time frame is 1 month for best result.

Gap Down Reversal StrategyA "Gap down Reversal" is when the current days candle, opens, below the prior days close, and "finishes up" on the day with the close greater than the open. This type of price action can provide traders with favorable entry points to trade long, as anyone who was short the prior day, can get squeezed or panic out of the trade as they would see profits erode quickly from the gap down at the open.
Strategy results are shown on SHOP with 10k starting capital and 10k per trade. The strategy enters at next days close after the gap down reversal fires off, and a 5% trailing stop order is also executed. This is important to understand when experimenting with different trailing stops on different symbols and observing results to find the most viable strategy. The discretionary trader may choose to enter at the close, or at the next days open, so understand results are not calculated for those entry points.
You also may alter the start date of the strategy, so you can include, or exclude certain dates.
Experiment with different stops and symbols! More volatile symbols most likely will need looser stops and Vice Versa. Concentrate on symbols in up trends, as "the dips" usually get consistently bought in these names, but hard reversals in downtrends can happen as well.
Any questions/concerns please let me know and happy trading.

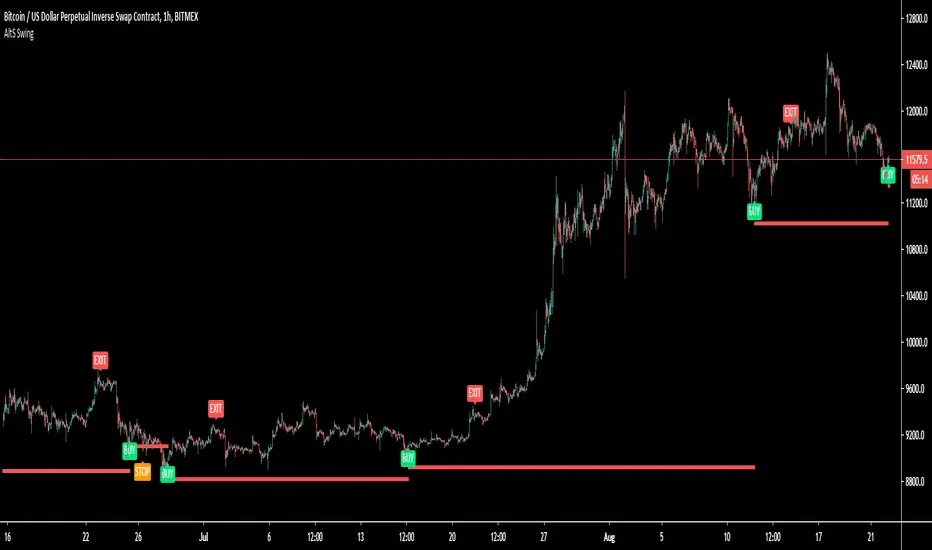
AltS Swing (INV)
PLEASE READ THIS DESCRIPTION TO SAVE TIME AND UNDERSTAND WHAT THIS INDICATOR DOES
This is a official version of AltSignals Long/Short Reverse Indicator
Description:
This indicator uses various indicators in combination with each other, some of the key ones to mention is Hulls, EMA , MA. Along with that it uses EMA crossovers to get the precise entries and exits.
The recommended time frames with this indictor are shorter ones, for example 5m,10m,15m work well, along with that I have found that some of the more unique time frames also work well such as 20m,45m,2hr and so on.
This indicator is not super advanced but it's still very powerful, with only 130 lines of code.
This indicator works on every chart, time, and candle type but you must play with the settings to find what is best, the same setting will not work on every pair etc.
With AltSignals Swing Indicator it trades one way, that means it gives 3 pieces of information. BUY/TakeProfit/StopLoss.
Unlike most indicators which Buy and Sell both ways this one focuses on one direction of trading so please take into account when using this.
I have added in a reverse strategy which basically shows the opposite values of of the buy, so if you select the box in the settings and un-tick it, then it will show opposite directions so sells only.
This feature is very useful especially in general bear markets when buying is difficult.
I have also added in the option for no stop losses to be used, if you set the stop loss value = 100 then it will show no stop losses.
I suggest a stop loss somewhere in the region of 1-2-3%, please note that you can use decimal stop losses too so for example 0.1 or 0.5.
This indicator is NOT a once size fits all, every chart is different, time frame and candles also, so i would suggest spending some time going through and playing with the channel length settings, which will change the EMA numbers.
Using this along with the back script to find the ideal settings is the best way to use this script, once you have done that make sure to save those values somewhere.
Its important to remember that the Regular script and the back testing script values should be the same for them to match up on the chart, so the channel lengths, stop losses and so on values should be the same.
Side note
This is not financial advice.
We will continue making updates as time goes on.
If you would like to try this script for free please visit our website or message us on Tradingview live chat.
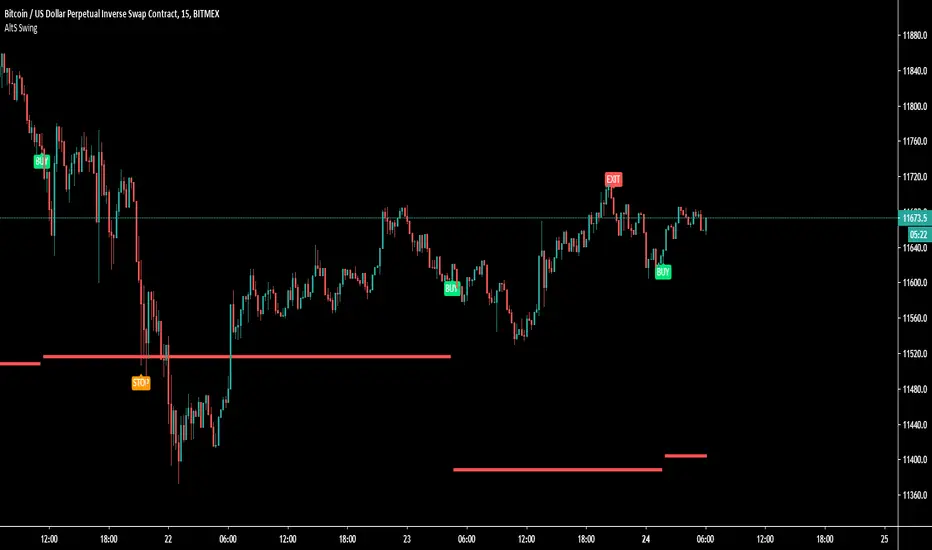
AltS Swing
PLEASE READ THIS DESCRIPTION TO SAVE TIME AND UNDERSTAND WHAT THIS INDICATOR DOES
This is a official version of AltSignals Long/Short Reverse Indicator
Description:
This indicator uses various indicators in combination with each other, some of the key ones to mention is Hulls, EMA, MA. Along with that it uses EMA crossovers to get the precise entries and exits.
The recommended time frames with this indictor are shorter ones, for example 5m,10m,15m work well, along with that I have found that some of the more unique time frames also work well such as 20m,45m,2hr and so on.
This indicator is not super advanced but it's still very powerful, with only 130 lines of code.
With AltSignals Swing Indicator it trades one way, that means it gives 3 pieces of information. BUY/TakeProfit/StopLoss.
Unlike most indicators which Buy and Sell both ways this one focuses on one direction of trading so please take into account when using this.
I have added in a reverse strategy which basically shows the opposite values of of the buy, so if you select the box in the settings and un-tick it, then it will show opposite directions so sells only.
This feature is very useful especially in general bear markets when buying is difficult.
I have also added in the option for no stop losses to be used, if you set the stop loss value = 100 then it will show no stop losses.
I suggest a stop loss somewhere in the region of 1-2-3%, please note that you can use decimal stop losses too so for example 0.1 or 0.5.
This indicator is NOT a once size fits all, every chart is different, time frame and candles also, so i would suggest spending some time going through and playing with the channel length settings, which will change the EMA numbers.
Using this along with the back script to find the ideal settings is the best way to use this script, once you have done that make sure to save those values somewhere.
Its important to remember that the Regular script and the back testing script values should be the same for them to match up on the chart, so the channel lengths, stop losses and so on values should be the same.
Side note
This is not financial advice.
We will continue making updates as time goes on.
If you would like to try this script for free please visit our website or message us on Tradingview live chat.
Shenlong V2.3 - Trend cycleShenlong V2 is a script developed to facilitate the interpretation of long and short entries according to various conditionals that play with the trend.
The use of trend clouds has been implemented, which can be used as dynamic support / resistance . They also allow us to identify the current price cycle according to these guidelines, marking with a LONG or SHORT depending on the cycle in question. The appearance settings are user configurable. You can set alerts (long o short) to be aware of movements.
The use of recommended stop loss has been implemented, this can be used as a trailing stop to ensure profits or give the possibility of catching the trend, since it will move as the price forms its structure.
An information panel on stop prices has been implemented for ease of use.

AltBetaHello Tradingivew!
This is a new script I have been working on for last few weeks, its still in a beta mode version but i want to publish it to get some feedback on it
This script uses a variety of indicators in conjunction with each other
Its unique in a way as it only LONGS and gives the exits rather than shorting too
It uses a percentage of the spread between average of high, low and close with ema crossover
it's uni-directional, picking longs only
Stop losses are wide enough to give the signal room for good results
it works best by backtesting against data to see results before using it on any particular symbol or timeframe
To try it our you may message me directly on tradingview chat
Thanks

TheStratHelper-Long Reversalsbased on the teachings of Rob Smith
1= Inside Candle
2= Break on one side
3= Englufing Candle/Outside Candle
Identifies long setups like 212, 312, 122 and 22
My potential entry is marked with a green line and a label that tells you the price as well. I typically enter 1 or 2 cents above the marked entry.
My potential target (magnitude) is marked with yellow lines and a label that tells you the price as well.
212, 312 and 122 has entry and magnitudes marked. If there are multiple magnitudes, those are marked with yellow lines which has the price written right above them. The program looks at potentially 4 or 5 magnitudes.
No magnitudes marked for a reversal 22.
Most of the colors can be customized
PM me for more info on how to access this indicator

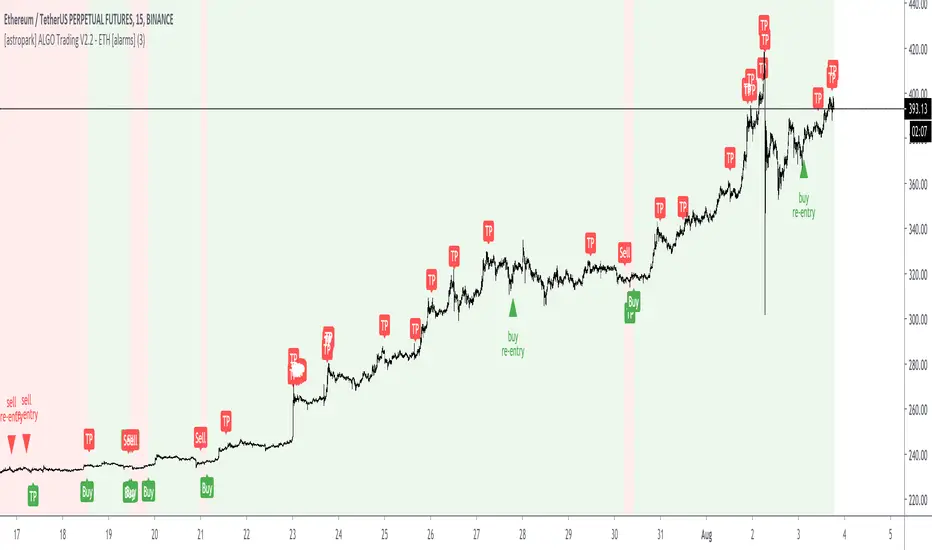
[astropark] ALGO Trading V2.2 - ETH [alarms]Dear Followers,
today another awesome Swing and Scalping Trading Strategy indicator : the upgraded version of ALGO Trading V2 for Binance Ethereum PERP on 15m timeframe!
It is runnable on a bot , just write me in order to help you do it.
If you are a scalper or you are a swing trader, you will love suggested entries for fast and long-lasting profit.
Keep in mind that a proper trailing stop strategy and risk management and money management strategies are very important (DM me if you need any clarification on these points).
This is an upgrade version of ALGO Trading V2 for Ethereum.
You can find ALGO Trading V2 indicator here below:
If you are interested in Bitcoin Trading, you will like for sure ALGO Trading V1.2, which is a customized version for Bitcoin trading:
This strategy has the following options:
enable/disable signals on chart
enable/disable bars and background coloring based on trend
enable/disable a Filter Noise option, which reduces overtrading
enable/disable a Trailing Stop option
enable/disable/config a Take Profit option, with Re-Entry
enable/disable a secret Smart Close Option which may improve profit on your chart (again, check it on you chart if it helps or not)
This strategy only trigger 1 buy (where to start a long trade) or 1 sell (for short trade). If you enable Take Profit / Stop Loss option, consider that many TP can be triggered before trend reversal, so take partial profit on every TP an eventually buy/sell back lower/higher on RE-ENTRY signal to maximize your profit.
This script will let you set all notifications you may need in order to be alerted on each triggered signals.
The one for backtesting purpose can be found by searching for the astropark's "ALGO Trading V2.2" and then choosing the indicator with "strategy" suffix in the name, or you can find here below:
This is not the "Holy Grail", so use proper money and risk management strategies.
This is a premium indicator , so send me a private message in order to get access to this script.
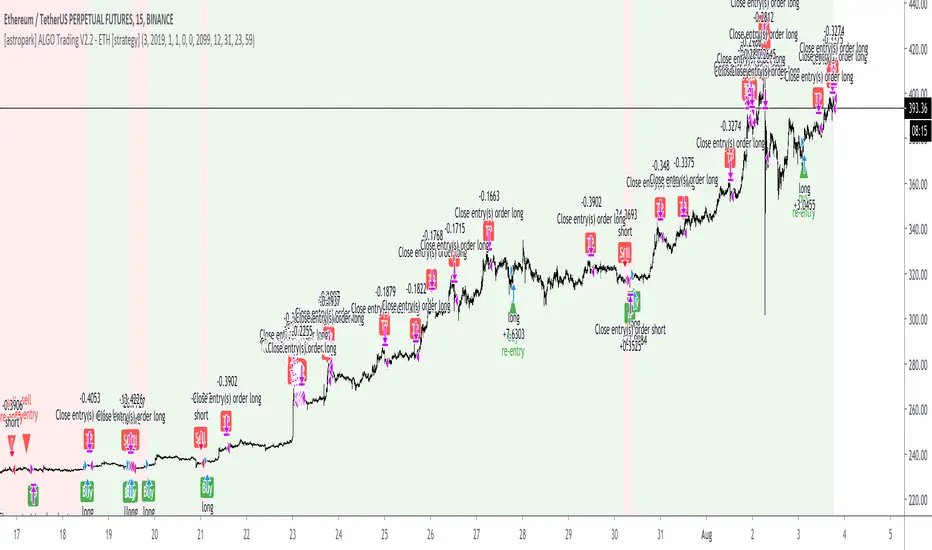
[astropark] ALGO Trading V2.2 - ETH [strategy]Dear Followers,
today another awesome Swing and Scalping Trading Strategy indicator : the upgraded version of ALGO Trading V2 for Binance Ethereum PERP on 15m timeframe!
It is runnable on a bot , just write me in order to help you do it.
If you are a scalper or you are a swing trader, you will love suggested entries for fast and long-lasting profit.
Keep in mind that a proper trailing stop strategy and risk management and money management strategies are very important (DM me if you need any clarification on these points).
This is an upgrade version of ALGO Trading V2 for Ethereum.
You can find ALGO Trading V2 indicator here below:
If you are interested in Bitcoin Trading , you will like for sure ALGO Trading V1.2, which is a customized version for Bitcoin trading:
This strategy has the following options:
enable/disable signals on chart
enable/disable bars and background coloring based on trend
enable/disable a Filter Noise option, which reduces overtrading
enable/disable a Trailing Stop option
enable/disable/config a Take Profit option, with Re-Entry
enable/disable a secret Smart Close Option which may improve profit on your chart (again, check it on you chart if it helps or not)
This strategy only trigger 1 buy (where to start a long trade) or 1 sell (for short trade). If you enable Take Profit / Stop Loss option, consider that many TP can be triggered before trend reversal, so take partial profit on every TP an eventually buy/sell back lower/higher on RE-ENTRY signal to maximize your profit.
Strategy results are calculated on the time window from December 2019 to now, so on more than 7 months, using 1000$ as initial capital and working at 1x leverage (so no leverage at all! If you like to use leverage, be sure to use a safe option, like 3x or 5x at most in order to have liquidation price very far).
This is not the "Holy Grail", so use proper money and risk management strategies.
In order to get notified when a signal is triggered, you need to use the "alarms" version of this indicator (just search for astropark's "ALGO Trading V2.2 - ETH" indicator and choose the one with "alarms" suffix).
This is a premium indicator , so send me a private message in order to get access to this script.
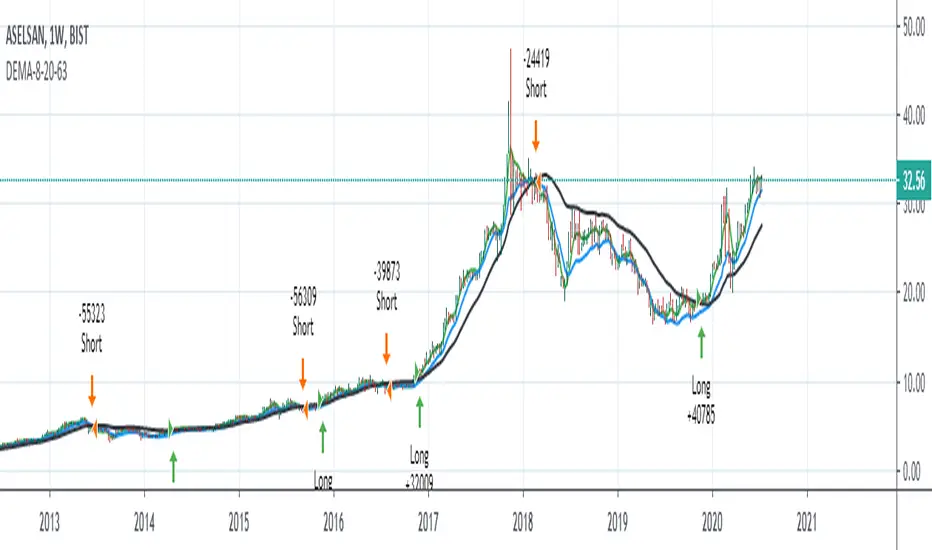
Double Exponential Moving Average 8-20-63 StrategyHello, this script was made upon the request of aliergin63, one of my followers.
I do not know exactly from whom it is quoted. (It may be author HighProfit.)
Long position when 8 dema is over 20 dema and 63 dema,
it opens a short position for the vice versa.
Alarms have been added.
%0.1 comission added.
Regards.
Note : DEMA = Double Exponential Moving Average
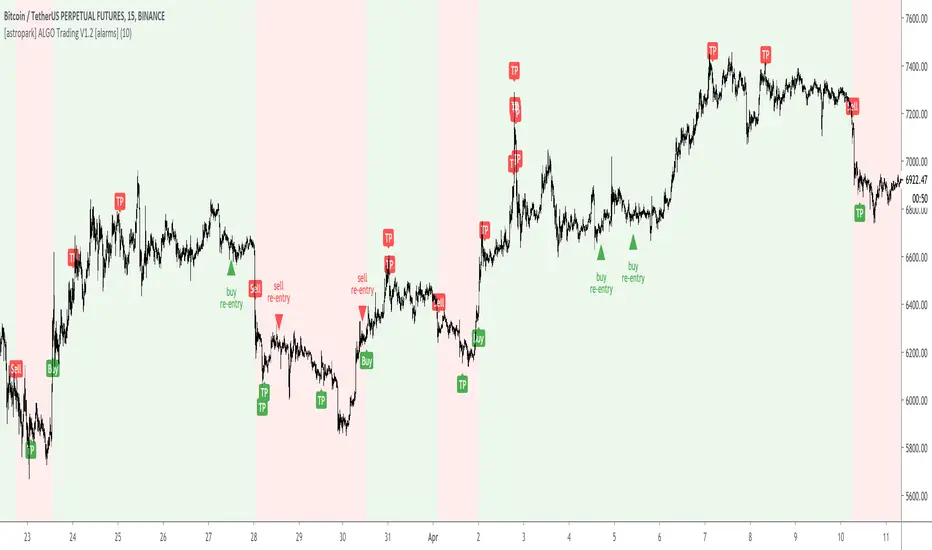
[astropark] ALGO Trading V1.2 [alarms]Dear Followers,
today another awesome Swing and Scalping Trading Strategy indicator : the upgraded version of ALGO Trading V1 for Binance Bitcoin PERP on 15m timeframe!
It is runnable on a bot , just write me in order to help you do it.
If you are a scalper or you are a swing trader, you will love suggested entries for fast and long-lasting profit.
Keep in mind that a proper trailing stop strategy and risk management and money management strategies are very important (DM me if you need any clarification on these points).
This strategy has the following options:
enable/disable signals on chart
enable/disable bars and background coloring based on trend
enable/disable a Filter Noise option, which reduces overtrading
enable/disable a Trailing Stop option
enable/disable/config a Take Profit option, with Re-Entry
enable/disable a secret Smart Close Option which may improve profit on your chart (again, check it on you chart if it helps or not)
This strategy only trigger 1 buy (where to start a long trade) or 1 sell (for short trade). If you enable Take Profit / Stop Loss option, consider that many TP can be triggered before trend reversal, so take partial profit on every TP an eventually buy/sell back lower/higher on RE-ENTRY signal to maximize your profit.
This is not the "Holy Grail", so use proper money and risk management strategies.
This indicator will let you set all alerts you need in order to get notified whenever a new signal is triggered.
To check its backtesting, you should use the strategy version, that you can find by searching for "ALGO Trading V1.2" or here below:
You can check out previous ALGO Trading V1 indicator here below:
This is a premium indicator , so send me a private message in order to get access to this script.
[astropark] ALGO Trading V1.2 [strategy]Dear Followers,
today another awesome Swing and Scalping Trading Strategy indicator : the upgraded version of ALGO Trading V1 for Binance Bitcoin PERP on 15m timeframe!
It is runnable on a bot , just write me in order to help you do it.
If you are a scalper or you are a swing trader, you will love suggested entries for fast and long-lasting profit.
Keep in mind that a proper trailing stop strategy and risk management and money management strategies are very important (DM me if you need any clarification on these points).
This strategy has the following options:
enable/disable signals on chart
enable/disable bars and background coloring based on trend
enable/disable a Filter Noise option, which reduces overtrading
enable/disable a Trailing Stop option
enable/disable/config a Take Profit option, with Re-Entry
enable/disable a secret Smart Close Option which may improve profit on your chart (again, check it on you chart if it helps or not)
This strategy only trigger 1 buy (where to start a long trade) or 1 sell (for short trade). If you enable Take Profit / Stop Loss option, consider that many TP can be triggered before trend reversal, so take partial profit on every TP an eventually buy/sell back lower/higher on RE-ENTRY signal to maximize your profit.
Strategy results are calculated on the time window from December 2019 to now, so on more than 7 months, using 1000$ as initial capital and working at 1x leverage (so no leverage at all! If you like to use leverage, be sure to use a safe option, like 3x or 5x at most in order to have liquidation price very far).
This is not the "Holy Grail", so use proper money and risk management strategies.
In order to get notified when a signal is triggered, you need to use the "alarms" version of this indicator (just search for astropark's "ALGO Trading V1.2" indicator and choose the one with "alarms" suffix).
You can check out previous ALGO Trading V1 indicator here below:
This is a premium indicator , so send me a private message in order to get access to this script.

TSI CCI Hull with profit$$$$ , Alert versionThis is a modified version of @SeaSide420 TSI CCI Hull with profits exit on long and short order with alert as well
original script :
the strategy script:
/// feel free to edit/improve and comment

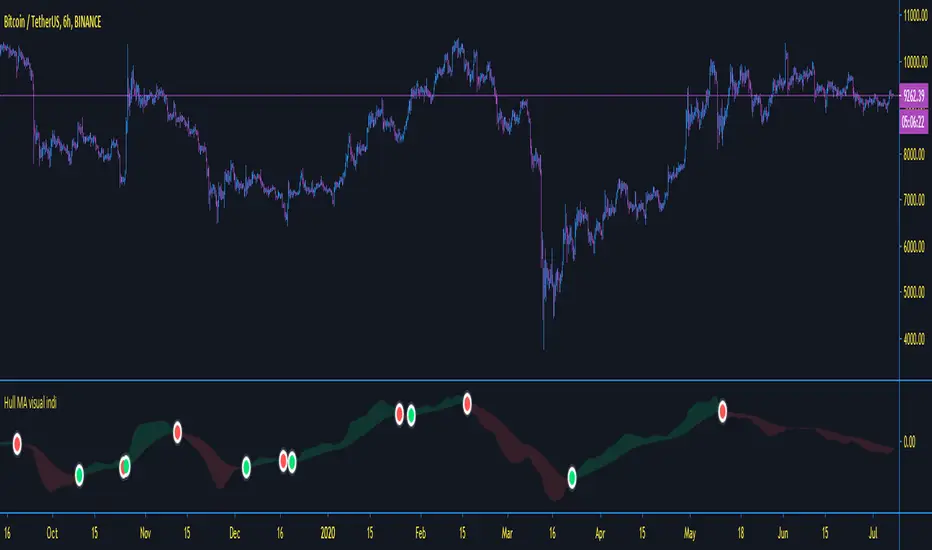
Moving Average Indicator - TradingSargentThis indicator is based on Hull Moving averages, and works best for signals on the 6 hour and above timeframe with standard settings - as always, fully adjustable from settings...
simple to use as another confirmation on your strategies -
Green = buy
red = sell
DM for access rules