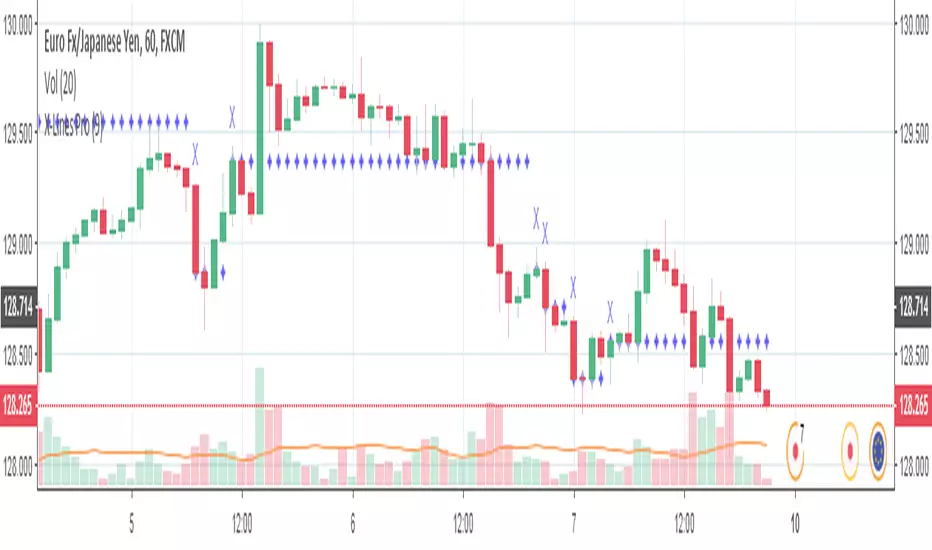
X-Lines ProThe X-lines indicator has been long time known by users of the Metatrader 4 & 5 trading platform. It shows interesting market prices ( support and resistance levels). The indicator works without delay and as soon as the bar is closed at the interesting price, immediately after that the symbol "X" will appear above bar and the level will be drawn to the next important value . The levels (prices) that the indicator showing are truly important for the market process (according to them, a large volume of transactions is processed or was working out in the past). Accordingly, such prices in the future can be the goal of the trading process and can act as support and resistance .
The adjustment of the indicator is extremely simple, it is possible to change the value of only one parameter: Levels Power, which default value is 9. The higher the value, the weaker the levels, the indicator (correspondingly, the levels becomes larger). In the case of low figures, the indicator shows stronger and more important prices (correspondingly, the levels are getting smaller). The work of the indicator is provided by the author's algorithm. The indicator does not build levels at the tops of prices or on edge bars, it automatically and in a timely manner determines the amount of work to be done at the closing price of the bar, thereby providing a nearly 100% level accuracy.
It is important to note that, due to the peculiarities of the cloud-based PINE language, the indicator has lost something, and has acquired something. For a more convenient level markup, simply place the horizontal price levels according to the indicator readings.
Lines
RSI & Volume Based S&R LinesRSI & Volume Based S&R Lines V1.0
Inspired by previous work available on TradingView I wanted to create my own Support & Resistance based indicator to help with confirming signals used with my swing trading tools (also available on TV).
There are two support and resistance lines, one RSI & historic price based and the other based on volume fractals. I've previously used these to help confirm entries previously and the fundamentals behind it are simple but effective.
Access
This indicator is completely free to those part of my discord community
Link: discord.gg

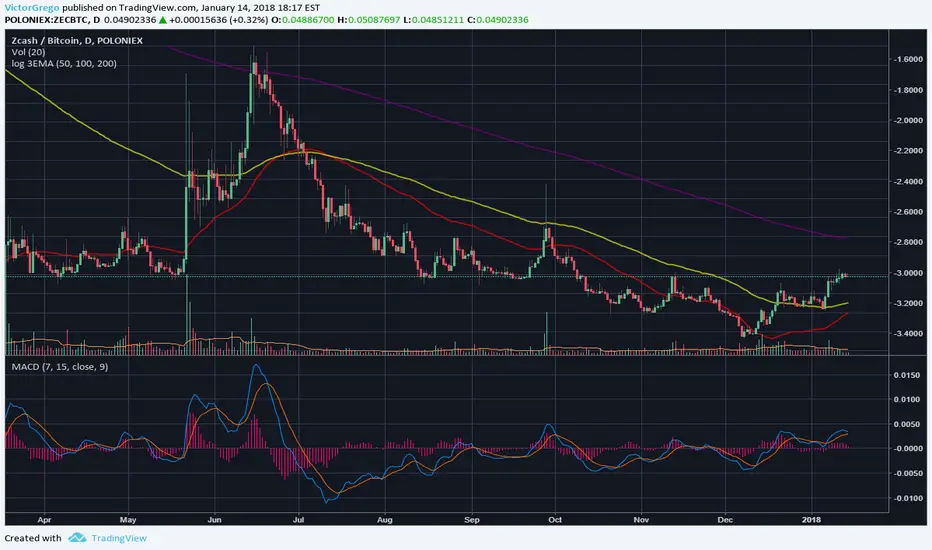
log 3EMAlogarithmic exponential moving average
plots 3 lines instead of 1
default is 50,100,200
use standard scale instead of log, for this to work properly.
BTC tip jar: 1Mv1s7nLaTsRoLai5WXEGg8doisXuiPUXy
ETH tip jar: 0x6113DDD23D0D5aCad3d1f8640A8A571E9Cb86cB8
LTC tip jar: LYvyoqTSWxa22TQw3E7818xy4AfYNi6xcm
BCH tip jar: 1GC7oZ7MhLkamKCDdZFnUfV21SKWq84VdY

X-LinesИндикатор X-lines давно известен для пользователей торговой платформы Metatrader 4 & 5. Он показывает интересные рынку цены (уровни поддержки и сопротивления). Индикатор работает без опоздания и как только бар будет закрыт по интересующей рынок цене, тут же над ним появится символ "X" и начнется прорисовка уровня до следующего важного значения . Уровни (цены) которые указывает индикатор являются истинно важными для рыночного процесса (по ним отрабатывается или отрабатывался в прошлом крупный объем сделок). Соответственно подобные цены в будущем могут быть целью торгового процесса и могут выступать, как поддержкой так и сопротивлением.
Настройка индикатора предельно проста, имеется возможность менять значение только одного параметра: Levels Power (сила уровней), по умолчанию значение равно 9-ти. Чем выше значение тем более слабые уровни показывает индикатор (соответственно уровней становится больше). В случае низких цифр индикатор показывает сильные и более важные цены (соответственно уровней становится меньше). Работу индикатора обеспечивает авторский алгоритм. Индикатор не строит уровни по вершинам цен или по краевым барам он автоматически и своевременно определяет отработку объема по цене закрытия бара тем самым обеспечивая практически 100% точность уровня.
Важно отметить, что в силу особенностей облачного языка PINE индикатор кое что потерял, а кое что приобрел. Для более удобной разметки уровней, просто расставите горизонтальные ценовые уровни соответственно показаниям индикатора.
English
The X-lines indicator has been long time known by users of the Metatrader 4 & 5 trading platform. It shows interesting market prices (support and resistance levels). The indicator works without delay and as soon as the bar is closed at the interesting price, immediately after that the symbol "X" will appear above bar and the level will be drawn to the next important value . The levels (prices) that the indicator showing are truly important for the market process (according to them, a large volume of transactions is processed or was working out in the past). Accordingly, such prices in the future can be the goal of the trading process and can act as support and resistance.
The adjustment of the indicator is extremely simple, it is possible to change the value of only one parameter: Levels Power, which default value is 9. The higher the value, the weaker the levels, the indicator (correspondingly, the levels becomes larger). In the case of low figures, the indicator shows stronger and more important prices (correspondingly, the levels are getting smaller). The work of the indicator is provided by the author's algorithm. The indicator does not build levels at the tops of prices or on edge bars, it automatically and in a timely manner determines the amount of work to be done at the closing price of the bar, thereby providing a nearly 100% level accuracy.
It is important to note that, due to the peculiarities of the cloud-based PINE language, the indicator has lost something, and has acquired something. For a more convenient level markup, simply place the horizontal price levels according to the indicator readings.

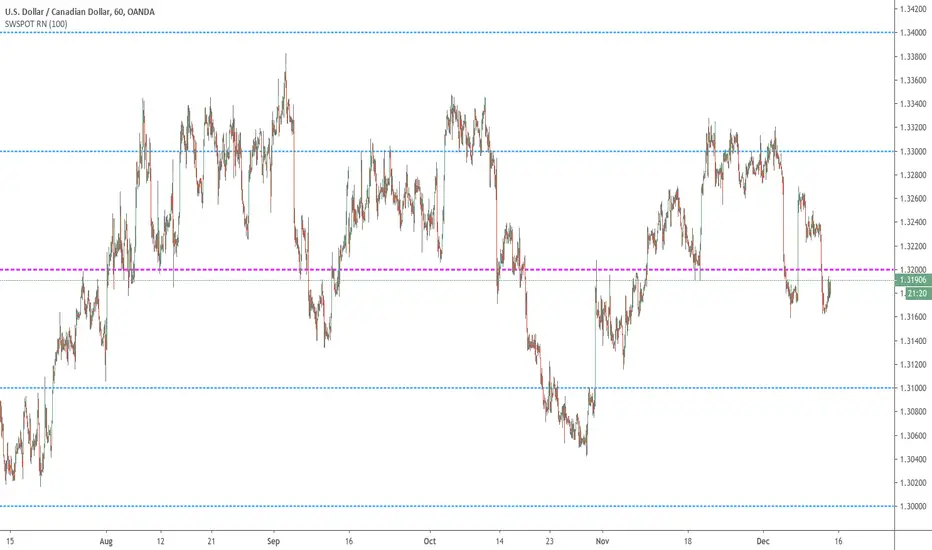
Sweetspot Gold RN - by JustUncleLThis is an alternate version of "Sweetspot Gold R4" that does not use sublevels. Removing the sublevels allows more efficient use of the plots (TV script has a limit of 64 plot calls).
This works well for all currency pairs I've tested, most commodities, and most stocks.
The indicator plots the so called "round price levels" or "00" levels. For example, 1.4000, 1.4400, 1.4500.
It automatically calculates the levels for each chart time frame. Optionally you can manually select main level size (in pips)
Use this indicator as a guidance to a better mapping of Support/Resistance levels on the chart. Next time you draw Support/Resistance lines, if they coincide with round price levels, you have got a excellent S/R level to work with!
Sweetspot Gold R4-22 - by JustUncleLThis upgrade I have attempted to improve the Automatic levels calculation and better automatic levels selections. It should now work better with exotic currencies, indices, commodities, and stocks.
The indicator plots the so called "round price levels" or "00" levels, which end on 00 and 50: for example, 1.4000, 1.4400, 1.4450. It automatically calculates the levels for based on your charts time frame. Alternatively you can manually select main level size (in pips) and/or the number of sub-levels (0, 1, 2, 3, 9). Generally speaking, the program tries to keep to 3 Digit "00" rounding for currencies and non-stocks, and 2 Digit "00" rounding for Stocks.
Use this indicator as a guidance to a better mapping of Support/Resistance levels on the chart. Next time you draw Support/Resistance lines, if they coincide with round price levels, especially "00", you have got a excellent S/R level to work with!
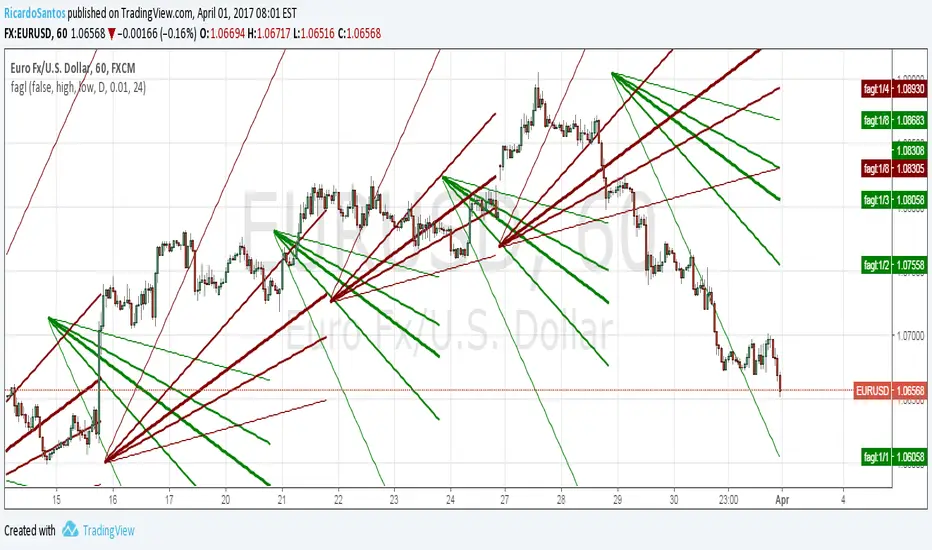
[RS]Fractal Auto Gann LinesEXPERIMENTAL:
GANN lines projection based on zigzag tops/bottoms, use at your own risk.
[RS]Average Advance and Decline Lines V0Method to draw linear regression lines from average price advance&decline range
