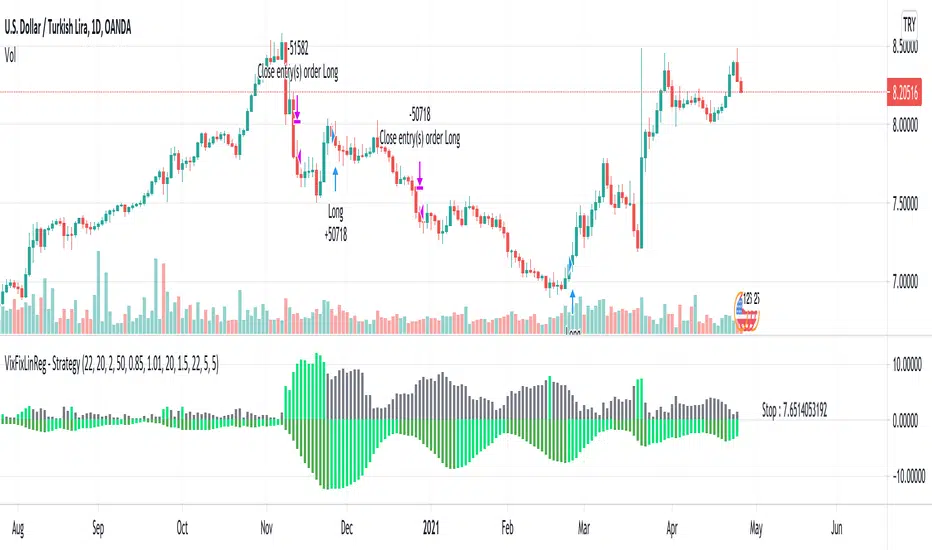
VixFixLinReg-StrategyThis idea came up while discussing about strategies with one of the trading enthusiast from tradingview community.
Strategy basically uses existing script of Vix Fix by Chris Moody:
VixFix is a great indicator for finding the market bottoms. But, sometimes it generates signal too early. But, we can apply linear regression on vix fix to find vix fix top to make timing much better.
Entry condition:
Wait for Vix fix bar to turn lime.
Once vix fix is turned lime, then wait for linear regression (shown below 0) to turn lime from green. This indicates VIX-Fix has started declining.
Go long once above two conditions are satisfied
Exit Condition:
ATR Based Stop
Applied only if linear regression is green - which means VixFix rising.
Note: This is ideal for identifying market bottom. May not yield good results on individual stocks.
Regressão Linear
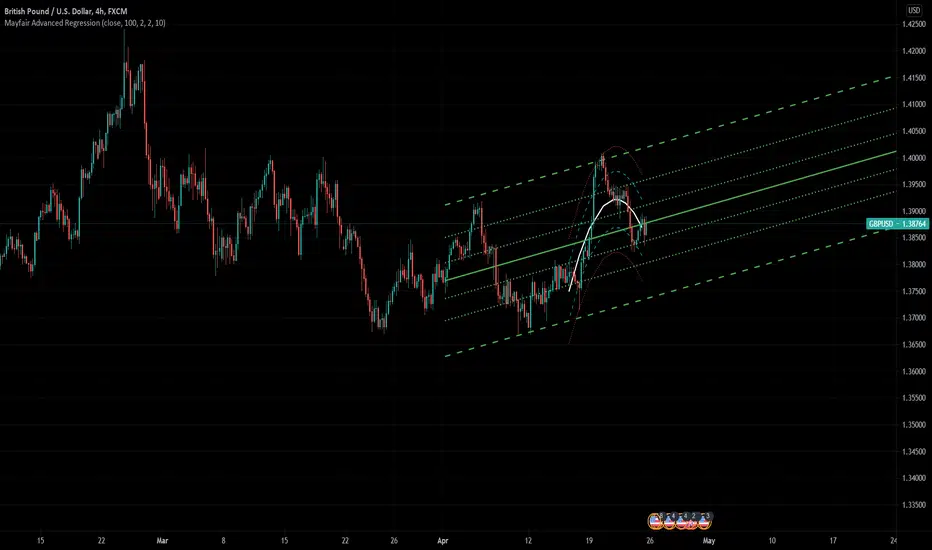
Mayfair Advanced Regressions 1.0This indicator maps two regressions.
The outer regression (green straight lines in the chart) tracks the main trend. It save you from working out your own trend channels, BUT it does move with the price, so it is different from a static channel. You can use it as a template for drawing static channels though.
The inner regression (the curved lines) is a parabolic regression. It shows the shorter term trend within the outer trend. This helps traders to judge when it is right or wrong to take a position on the edge of the main regression, based on whether the inner regression is indicating an acceleration out of the channel, or is shaping to go with the main trend.
We find it works best if there is a clear trend. If the market is not trending, then there isn't much point using a trend analysis tool like this.
Like all indicators, it is not perfect, and you should never rely on one indicator in any situation.
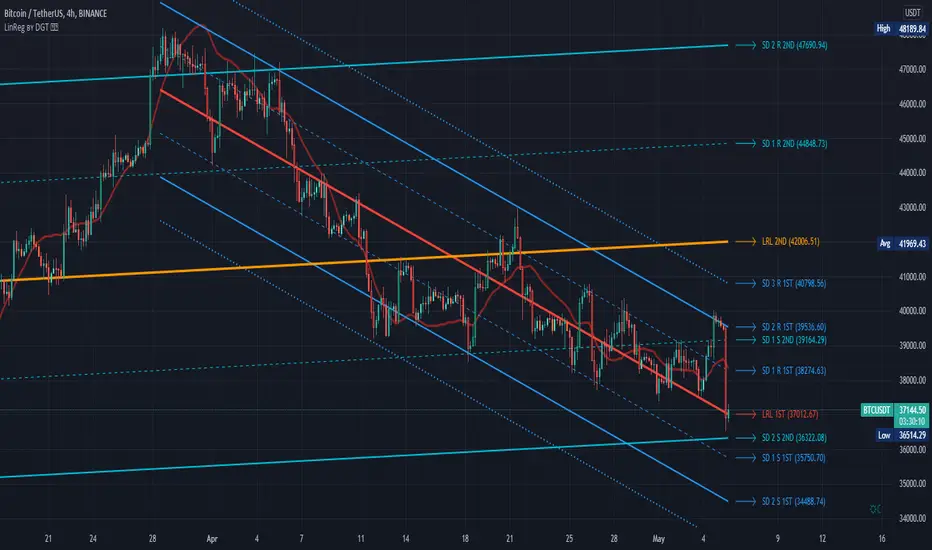
Linear Regression Channel / Curve / Slope by DGTTʜᴇ Lɪɴᴇᴀʀ Rᴇɢʀᴇꜱꜱɪᴏɴ Cʜᴀɴɴᴇʟꜱ
Linear Regression Channels are useful measure for technical and quantitative analysis in financial markets that help identifying trends and trend direction. The use of standard deviation gives traders ideas as to when prices are becoming overbought or oversold relative to the long term trend
The basis of a linear regression channel
Linear Regression Line – is a line drawn according to the least-squares statistical technique which produces a best-fit line that cuts through the middle of price action, a line that best fits all the data points of interest. The resulting fitted model can be used to summarize the data, to predict unobserved values from the same system. Linear Regression Line then present basis for the channel calculations
The linear regression channel
2. Upper Channel Line – A line that runs parallel to the Linear Regression Line and is usually one to two standard deviations above the Linear Regression Line.
3. Lower Channel Line – This line runs parallel to the Linear Regression Line and is usually one to two standard deviations below the Linear Regression Line.
Unlike Fibonacci Channels and Andrew’s Pitchfork, Linear Regression Channels are calculated using statistical methods, both for the regression line (as expressed above) and deviation channels. Upper and Lower channel lines are presenting the idea of bell curve method, also known as a normal distribution and are calculated using standard deviation function.
A standard deviation include 68% of the data points, two standard deviations include approximately 95% of the data points and any data point that appears outside two standard deviations is very rare.
It is often assumed that the data points will move back toward the average, or regress and channels would allow us to see when a security is overbought or oversold and ready to revert to the mean
please note : Over time, the price will move up and down, and the linear regression channel will experience changes as old prices fall off and new prices appear
█ Linear Regression Study Features
Linear Regression Channel
- Linear regression line as basis
- Customizable multiple channels based on Standard Deviation
- ALERTs for the channel levels
Linear Regression Curve
- Linear regression curve as basis
- Optional : Bands based on Standard Deviation or Volatility (ATR). Bands are applied with fixed levels 1, 2 and 3 times StdDev or ATR away from the curve
Linear Regression Slope
- Optional : Up/Down slope arrows for a used defined period
█ Volume / Volatility Add-Ons
High Volatile Bar Indication
Volume Spike Bar Indication
Volume Weighted Colored Bars
LinReg Triangular FiffyLinReg Triangular Fiffy
What this Script can help you with ?
1. It helps you figure out the Historical Breaks of the Linear Regression Channel { default length : 20, stdev : 2}, These historical breaks are plotted as Blue and Orange Dots
2. Also it plots the Level corresponding the Points where the historical breaks have happened as {blue and orange horizontal Lines}
3. It takes the historical Breaks of the LR Channel as Input to a triangular function which plots the trend based market bands in yellow
** The script have Provisions for Alerts
**** LinReg Breakout Bull
**** LinReg Breakdown Bear
How to Trade with the Script ?
First you will receive the alerts that there is a break of the linReg Band
Then you look at the Triangula Yellow Bands, whether it is below the closing price or above it
If you receive a Bullish Signal and the Triangular Bands are below the closing price then you take long,
If you receive a Bearish Signal and the Triangular Bands are above the closing price then you take short,
If you receive a Bearish Signal and the Triangular Bands are below the closing price then you take short, till the upper band, {for begginers, its noTrade situation}
If you receive a Bullish Signal and the Triangular Bands are above the closing price then you take Long, till the Lower band, {for begginers, its noTrade situation}
How to get access ?
Just private message me, I will be happy to share u guys!
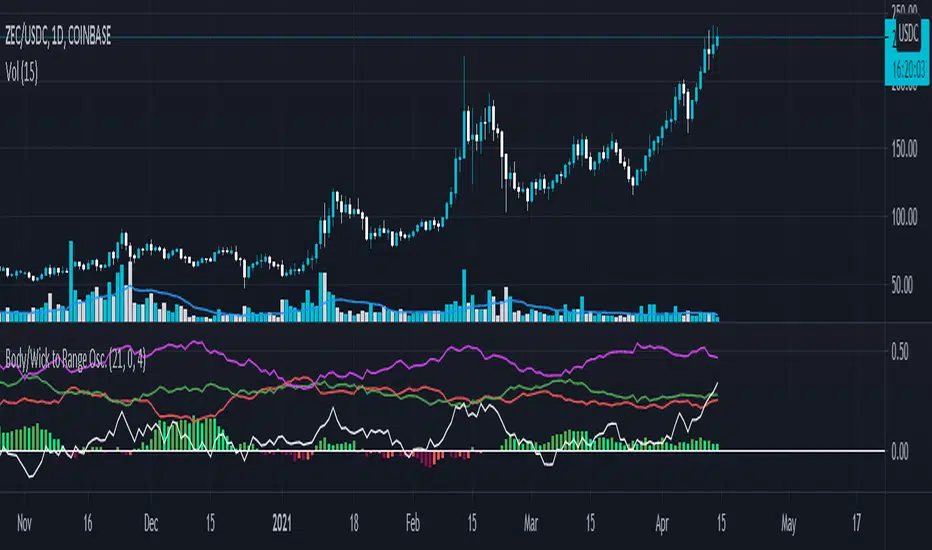
Body/Wick to Range Osc.This script is meant to be a form of pure candlestick analysis.
Terminology in the description used below is as follows:
- numcands = Number of candles specified by the user to be used for sampling in each moving average.
This script plots moving average (SMA/EMA specified by the user ) of the percentage of the high-low range that the previous {numcands} candles the upper wicks, lower wicks, and the body take up.
The user may specify if the absolute value of the body percentage is to be used (true by default). To account for this, a horizontal line is also plotted at 0 to show when the body percentage moves above or below 0.
The values that all of these moving averages plotted will oscillate between 0 and 1 (-1 and 1 for the body percentage if the absolute value of candles is not used).
Other notes: The user may select the colors used (colorblind support, as the defaults are red and green). Cross overs and cross unders are accounted for in alertconditions (as is if the body % moves above and below 0% if absolute values are not used).
An interpretation of the use of this script may be: If the upper wicks begin to take up a larger portion of the high-low range, it may signal downward selling pressure (and vise-versa for lower wicks). However, this may be open to interpretation based upon the specified {numcands} used.
Parallel Channel [WS]- it is paid version
if you want free version
- what is it
it show parallel channel auto-matically
- how is possible (source is protected)
it just use linreg function (built-in pine script function.)
and find center line from 'learning_length' candle.
also stdev between candle and center line.
also max distance.
and draw channel using center-line + stdev + fibonacci ratio + max distance.
until the channel get broken, it keep same channel.
so this is not re-paint indicator.
it is leading actually.
source : 캔들의 무슨값을 사용해서 계산하는지를 결정합니다. 사실 뭘 하든 크게 안바뀌긴 합니다.
learning length : 학습량인데 길게 잡으면 대체로 더 큰 밴드가 나옵니다. 과거 캔들을 학습해서 선들을 그리는데 이 값만큼 학습합니다. 300이면 300개 지나간 캔들을 학습합니다.
한번 학습하여 채널이 결정되면, 채널 이탈이 나오기 전까지 재학습 안합니다. (그래서 리페인팅이 없습니다.)
즉, 채널의 시작점에서 지나간 300개 캔들이 학습대상입니다.
학습이라는 표현이 어색할 수 있는데, 쉽게 말하자면 300개 캔들을 가로지르는 중앙선을 찾습니다. 그리고 최대폭도 여기서 찾습니다. 이것을 학습이라고 부릅니다.
channel max length : 채널의 최대길이입니다. 채널이 한번 결정되고, 이탈을 하지 않아도 이 값을 넘어가면 새로 채널을 그립니다.
band factor : 채널의 최대폭의 배수입니다. 이값의 1/10을 사용합니다. 즉 10이면 1이 됩니다. 채널이탈의 기준이 되는 선도 이것입니다.
leading length. 선행하여 선을 더 그려주는데 선행의 길이입니다.
standard .... multi ... 표준편차로 계산된 선들의 폭입니다. 기본은 피보나치 비율.
channel escape : 채널 이탈 기준을 표준편차선3 을 기준으로 바꿀 수 있습니다.
debug_mode. 과거 방향 (왼쪽방향) 으로의 가이드 선을 학습량 만큼 보여줍니다.
기존의 다른 유사 지표들을 보면 이 선을 보여주는데, 이 선으로 매매 못합니다. 거의 리페인팅이나 마찬가지인 선입니다.
다 지나간 뒤에 고점 저점 찾아서 연결해주고 있으니 리페인팅이나 마찬가지입니다.
밴드폭이 어떤 캔들을 기준으로 만들어졌는지 확인하는 용도로 쓸 수 있습니다. 그래서 이름이 debug...입니다.

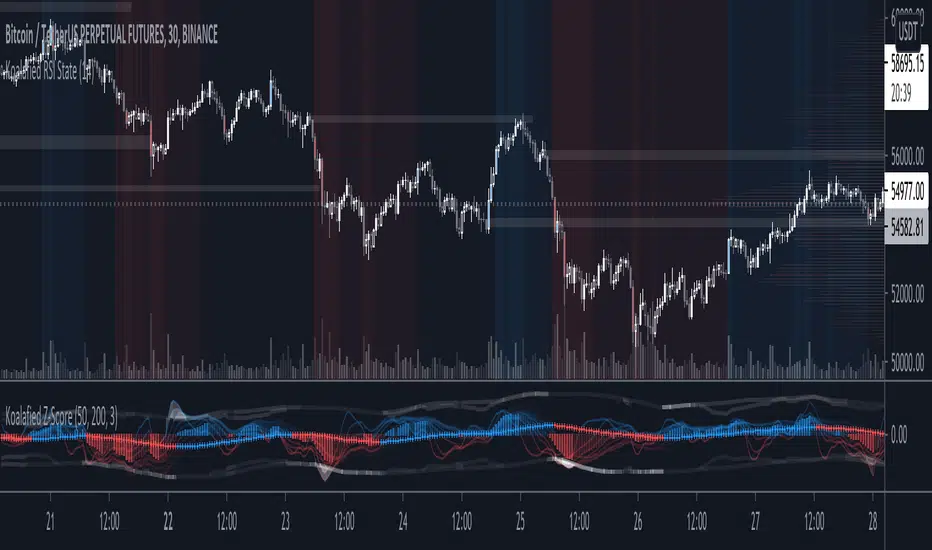
Koalafied Z-ScoreZ-Score indicator derived from Pecker's previously released indicators (Percentile and PPO Fishnet). Includes linear regression bands weighted by volume/volatility.
Quad MAFor a dive into the fine details, see the source code/documentation.
Quad MA is a program designed to allow a wide range of flexibility in overlaying multiple moving averages onto a chart.
This program handles the ability to:
- Overlay Up to 4 moving averages on the chart.
- Change the length of each moving average.
- Adjust optional values for special moving averages
(least squares and Arnaud Legoux)
- Change the color for each moving average.
- Change the type of each moving average individually.
- Change the visibility of each moving average.
- Change the source of the moving averages.
- Set alerts for a cross between any two moving averages.

Parallel Pivot Lines [LuxAlgo]Displays lines connecting past pivot high/low points with each line having the slope of a linear regression. This slope can also be controlled by the user with the 'Slope' setting. Each line can be used as a support or resistance by the user.
Settings
Length : Pivot length. Use higher values for having lines connected to more significant pivots points.
Lookback : Number of lines connecting a pivot high/low to display, with a total of lines equal to Lookback*2
Slope : Allows the user to multiply the linear regression slope by a number within -1 and 1
Limitations
The script has currently several real time behavior limitations. Lines are displayed retrospectively and will not update with the arrival of new bars. Readjusting the indicator to newer pivots will require the user to either hide/unhide the indicator or change its settings.
High Length or Lookback values might not return any lines if the location of a pivot point is outside the defined buffer size of the indicator (set as 5000 bars).
How To Use
The indicator can be used to get supports and resistances and is more so closer to a drawing tool due to its limitations. The lines not updating with the arrival of new bars have the advantage of providing fixed supports/resistances.
The Slope setting allows the user to control the angle and direction of the lines. Using a Slope of 1 will return lines with the same slope as the one of a linear regression fit from the farthest pivot point displayed by the indicator to the most recent bar.
The chart above shows the indicators and a linear regression in orange.
If you want to have horizontal lines, use a Slope equal to 0.
Finally using a negative slope value will allow the user to have lines in opposite directions to the main trend.
Conclusion
We hope you like this indicator (drawing tool) and find it useful for drawing your support & resistances in a unique way!

Robust Channel [tbiktag]Introducing the Robust Channel indicator.
This indicator is based on a remarkable property of robust statistics , namely, the resistance to the presence of data points that deviate significantly from the established trend (generally speaking, outliers ). Being outlier-resistant, the Robust Channel indicator “remembers” a pre-existing trend and thus exhibits a very peculiar "lag" in case of a sharp price change. This allows high-confidence identification of such price actions as a trend reversal, range break, pullback, etc.
In the case of trending and range-bound market conditions, the price remains within the channel most of the time, fluctuating around the central line.
Technical details
The central line is calculated using the repeated median slope algorithm. For each data point in a lookback window of a user-specified Length , this method calculates the median slope of the lines that connect that point to all other points inside the window. The overall median of these median slopes is then calculated and used as an estimate of the trend slope. The algorithm is very efficient as it uses an on-the-fly procedure to update the array containing the slopes (new data pushed - old data removed).
The outer line is then calculated as the central line plus the Length -period standard deviation of the price data multiplied by a user-defined Channel Width Factor . The inner line is defined analogously below the central line.
Usage
As a stand-alone indicator, the Robust Channel can be applied similarly to the Bollinger Bands and the Keltner Channel:
A close above the outer line can be interpreted as a bullish signal and a close below the inner line as a bearish signal.
Likewise, a return to the channel from below after a break may serve as a bullish signal, while a return from above may indicate bearish sentiment.
Robust Channel can be also used to confirm chart patterns such as double tops and double bottoms.
If you like this indicator, feel free to leave your feedback in the comments below!

Parallel Channel [F]- free version
it may have some limited function.
- what is it
it show parallel channel auto-matically
- how is possible (source is protected)
it just use linreg function (built-in pine script function.)
and find center line from 'learning_length' candle.
also stdev between candle and center line.
also max distance.
and draw channel using center-line + stdev + fibonacci ratio + max distance.
until the channel get broken, it keep same channel.
so this is not re-paint indicator.
it is leading actually.
- 기능 제한
무료버전이라 기능 제한이 있을 수 있습니다.
source : 캔들의 무슨값을 사용해서 계산하는지를 결정합니다. 사실 뭘 하든 크게 안바뀌긴 합니다.
learning length : 학습량인데 길게 잡으면 대체로 더 큰 밴드가 나옵니다. 과거 캔들을 학습해서 선들을 그리는데 이 값만큼 학습합니다. 300이면 300개 지나간 캔들을 학습합니다.
한번 학습하여 채널이 결정되면, 채널 이탈이 나오기 전까지 재학습 안합니다. (그래서 리페인팅이 없습니다.)
즉, 채널의 시작점에서 지나간 300개 캔들이 학습대상입니다.
학습이라는 표현이 어색할 수 있는데, 쉽게 말하자면 300개 캔들을 가로지르는 중앙선을 찾습니다. 그리고 최대폭도 여기서 찾습니다. 이것을 학습이라고 부릅니다.
channel max length : 채널의 최대길이입니다. 채널이 한번 결정되고, 이탈을 하지 않아도 이 값을 넘어가면 새로 채널을 그립니다.
band factor : 채널의 최대폭의 배수입니다. 이값의 1/10을 사용합니다. 즉 10이면 1이 됩니다. 채널이탈의 기준이 되는 선도 이것입니다.
leading length. 선행하여 선을 더 그려주는데 선행의 길이입니다.
standard .... multi ... 표준편차로 계산된 선들의 폭입니다. 기본은 피보나치 비율.
channel escape : 채널 이탈 기준을 표준편차선3 을 기준으로 바꿀 수 있습니다.
debug_mode. 과거 방향 (왼쪽방향) 으로의 가이드 선을 학습량 만큼 보여줍니다.
기존의 다른 유사 지표들을 보면 이 선을 보여주는데, 이 선으로 매매 못합니다. 거의 리페인팅이나 마찬가지인 선입니다.
다 지나간 뒤에 고점 저점 찾아서 연결해주고 있으니 리페인팅이나 마찬가지입니다.
밴드폭이 어떤 캔들을 기준으로 만들어졌는지 확인하는 용도로 쓸 수 있습니다. 그래서 이름이 debug...입니다.

Quadratic Regression Trend ChannelIt's been a while since I have published anything meaningful for all members, but here is my next step in evolution of trend channel technology, my attempt at "Quadratic Regression Trend Channel" custom tailored for regression enthusiasts. I'm actually doing a lot more than my profile shall ever reveal. Many members may have heard of "polynomial regression channel"(PRC), but I wouldn't accurately label this as having the "poly-" capability in it with differing amounts of nth degrees/orders.
This indicator is derived from my "HLC Banded Quadratic Regression" indicator, the 3rd indicator I had ever published in my earliest days of tinkering around with Pine Script. It always had a destiny, and TV has graciously delivered on upgrading Pine with many new capabilities to run this algorithm with ease and in the manner that I wished to write it. Any subscribing TradingViewer has the freedom to use this indicator and as many as they shall desire.
Blessed is the "Immense Power of Pine" in 2021, as I utilized a multitude of new Pine features including extensive use of arrays for the quadratic regression formula, arrays of line.new(), input(group=), and input(inline=). I spent an incredible amount of time creating this, and it was no easy task to condense this amount of sophistication within less than 150 lines of code at the time of this original debut release. I have striven to achieve the indicator's computational efficiency potential to be as fast as possible with highly optimized code to handle the large amount of sampling it utilizes and is capable of. I hope you find it analytically favorable and beyond your expectations.
First of all, it has different sampling methods I haven't seen in any other PRC available, providing tightly snug and fit curvatures dependent on my optional choices not found in comparable indicators. This yields the best quality of fit I can provide by employing quadratic regression in order to provide a superb "visual analysis" of your price action in high noise environments. I also included my novel time warp feature to rewind the indicator regression into a previous state of time. If you're trading on really fast timeframes, I included an option to only calculate once per bar at it's closure. This will aid with computational efficiency of the TV servers, and it's intended to not to slow down your charting experience amongst a wide assortment of other indicators in your overlay chart.
I allowed a couple of variability methods for the confidence bands. A variety of coloring options, line thickness, and other perks are there to accommodate your distinct visual acuity. There is also a nifty option to color the regression by the slope of the curvatures. This is enabled by default, and I anticipate that you may find that color option uniquely useful. The amount of chords in the curvature are automatically calculated depending on the regression period selected to achieve a nice fluid arch for any setting.
Anyhow, I believe that sums up most of it's important characteristics in a brief explanation. It's potential is best personally discovered by simply using it with the myriad of control settings available. I published it with protected code, because I simply wanted to confine this monstrosity to my TradingView laboratory. I would rather not have this thing uncaged, rabidly running around the planet frothing out of the mouth on a Frankenstein AI later, unless it's mine on a short leash. Besides, I'm still trying to figure out the math behind "cubic regression". :)
Sorry in advance about not providing the source code, I hope you'll understand... We ALL know what devastation happens when things are "unleashed" from a BSL-4 lab to run amok. Countless billions have yet to learn a horrific lesson about the mania of evil at a future Geneva convention. If you don't know the mythical story about Pandora's box(a jar actually), look it up!
Features List Includes:
Calculation Throttling
Regression Period
Time Warp
Multiple Sampling Methods
Confidence Bands Variability Controls
Indicator Customization Options
When available time provides itself, I will consider your inquiries, thoughts, and concepts presented below in the comments section, should you have any questions or comments regarding this indicator. When my indicators achieve more prevalent use by TV members , I may implement more ideas when they present themselves as worthy additions. Have a profitable future everyone!
Matrix Library (Linear Algebra, incl Multiple Linear Regression)What's this all about?
Ever since 1D arrays were added to Pine Script, many wonderful new opportunities have opened up. There has been a few implementations of matrices and matrix math (most notably by TradingView-user tbiktag in his recent Moving Regression script: ). However, so far, no comprehensive libraries for matrix math and linear algebra has been developed. This script aims to change that.
I'm not math expert, but I like learning new things, so I took it upon myself to relearn linear algebra these past few months, and create a matrix math library for Pine Script. The goal with the library was to make a comprehensive collection of functions that can be used to perform as many of the standard operations on matrices as possible, and to implement functions to solve systems of linear equations. The library implements matrices using arrays, and many standard functions to manipulate these matrices have been added as well.
The main purpose of the library is to give users the ability to solve systems of linear equations (useful for Multiple Linear Regression with K number of independent variables for example), but it can also be used to simulate 2D arrays for any purpose.
So how do I use this thing?
Personally, what I do with my private Pine Script libraries is I keep them stored as text-files in a Libraries folder, and I copy and paste them into my code when I need them. This library is quite large, so I have made sure to use brackets in comments to easily hide any part of the code. This helps with big libraries like this one.
The parts of this script that you need to copy are labeled "MathLib", "ArrayLib", and "MatrixLib". The matrix library is dependent on the functions from these other two libraries, but they are stripped down to only include the functions used by the MatrixLib library.
When you have the code in your script (pasted somewhere below the "study()" call), you can create a matrix by calling one of the constructor functions. All functions in this library start with "matrix_", and all constructors start with either "create" or "copy". I suggest you read through the code though. The functions have very descriptive names, and a short description of what each function does is included in a header comment directly above it. The functions generally come in the following order:
Constructors: These are used to create matrices (empy with no rows or columns, set shape filled with 0s, from a time series or an array, and so on).
Getters and setters: These are used to get data from a matrix (like the value of an element or a full row or column).
Matrix manipulations: These functions manipulate the matrix in some way (for example, functions to append columns or rows to a matrix).
Matrix operations: These are the matrix operations. They include things like basic math operations for two indices, to transposing a matrix.
Decompositions and solvers: Next up are functions to solve systems of linear equations. These include LU and QR decomposition and solvers, and functions for calculating the pseudo-inverse or inverse of a matrix.
Multiple Linear Regression: Lastly, we find an implementation of a multiple linear regression, including all the standard statistics one can expect to find in most statistical software packages.
Are there any working examples of how to use the library?
Yes, at the very end of the script, there is an example that plots the predictions from a multiple linear regression with two independent (explanatory) X variables, regressing the chart data (the Y variable) on these X variables. You can look at this code to see a real-world example of how to use the code in this library.
Are there any limitations?
There are no hard limiations, but the matrices uses arrays, so the number of elements can never exceed the number of elements supported by Pine Script (minus 2, since two elements are used internally by the library to store row and column count). Some of the operations do use a lot of resources though, and as a result, some things can not be done without timing out. This can vary from time to time as well, as this is primarily dependent on the available resources from the Pine Script servers. For instance, the multiple linear regression cannot be used with a lookback window above 10 or 12 most of the time, if the statistics are reported. If no statistics are reported (and therefore not calculated), the lookback window can usually be extended to around 60-80 bars before the servers time out the execution.
Hopefully the dev-team at TradingView sees this script and find ways to implement this functionality diretly into Pine Script, as that would speed up many of the operations and make things like MLR (multiple linear regression) possible on a bigger lookback window.
Some parting words
This library has taken a few months to write, and I have taken all the steps I can think of to test it for bugs. Some may have slipped through anyway, so please let me know if you find any, and I'll try my best to fix them when I have time to do so. This library is intended to help the community. Therefore, I am releasing the library as open source, in the hopes that people may improving on it, or using it in their own work. If you do make something cool with this, or if you find ways to improve the code, please let me know in the comments.

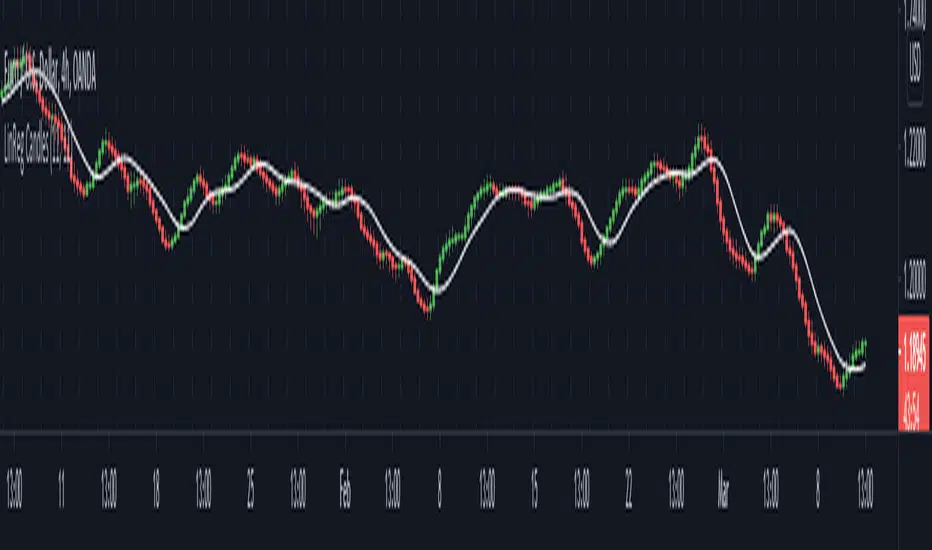
Linear Regression CandlesThere are many linear regression indicators out there, most of them draw lines or channels, but this one actually draws a chart.
Repeated Median Regression ChannelThis script uses the Repeated Median (RM) estimator to construct a linear regression channel and thus offers an alternative to the available codes based on ordinary least squares.
The RM estimator is a robust linear regression algorithm. It was proposed by Siegel in 1982 (1) and has since found many applications in science and engineering for linear trend estimation and data filtering.
The key difference between RM and ordinary least squares methods is that the slope of the RM line is significantly less affected by data points that deviate strongly from the established trend. In statistics, these points are usually called outliers, while in the context of price data, they are associated with gaps, reversals, breaks from the trading range. Thus, robustness to outlier means that the nascent deviation from a predetermined trend will be more clearly seen in the RM regression compared to the least-squares estimate. For the same reason, the RM model is expected to better depict gaps and trend changes (2).
Input Description
Length : Determines the length of the regression line.
Channel Multiplier : Determines the channel width in units of root-mean-square deviation.
Show Channel : If switched off , only the (central) regression line is displayed.
Show Historical Broken Channel : If switched on , the channels that were broken in the past are displayed. Note that a certain historical broken channel is shown only when at least Length / 2 bars have passed since the last historical broken channel.
Print Slope : Displays the value of the current RM slope on the graph.
Method
Calculation of the RM regression line is done as follows (1,3):
For each sample point ( t (i), y (i)) with i = 1.. Length , the algorithm calculates the median of all the slopes of the lines connecting this point to the other Length -1 points.
The regression slope is defined as the median of the set of these median slopes.
The regression intercept is defined as the median of the set { y (i) – m * t (i)}.
Computational Time
The present implementation utilizes a brute-force algorithm for computing the RM-slope that takes O ( Length ^2) time. Therefore, the calculation of the historical broken channels might take a relatively long time (depending on the Length parameter). However, when the Show Historical Broken Channel option is off, only the real-time RM channel is calculated, and this is done quite fast.
References
1. A. F. Siegel (1982), Robust regression using repeated medians, Biometrika, 69 , 242–244.
2. P. L. Davies, R. Fried, and U. Gather (2004), Robust signal extraction for on-line monitoring data, Journal of Statistical Planning and Inference 122 , 65-78.
3. en.wikipedia.org

Multi SD ChannelMultiple standard deviation channels overlaid as opposed to the single SD view TV gives you with the Regression Channel Drawing.
To Do:
Add in background fills
Make start and end range inputs with a line/range drawing
Keep study from updating when the view changes

Moving Regression Band Breakout strategyFollowing the introduction of the Moving Regression Prediction Bands indicator (see link below), I'd like to propose how to utilize it in a simple band breakout strategy :
Go long after the candle closes above the upper band . The lower band (alternatively, the lower band minus the 14-period ATR or the central line ) will serve as a support line .
Exit as soon as the candle closes below the support line .
To manage the risk of false breakouts, a fixed stop loss is set to the value of the support line at the time of opening a position. When the support line moves above the position opening price, shift the stop loss to breakeven.
The same logic but in reverse applies to short positions.
As an option, it is possible to allow long entries only when the slope of the Moving Regression curve is positive (and short entries when the slope is negative).
Model parameters:
Length and Polynomial Order define the lag and smoothness of the model.
Multiplier specifies the width of the channel.
As the default model parameter values, I set those that I found to provide optimal risk / reward ratio on the daily timeframe (for both trending and range-bound market). However, the settings are very flexible and can be well-adjusted to particular market conditions. Feel free to play around and leave feedback in the comments!
Here's the original Moving Regression Prediction Bands script:

Moving Regression Prediction BandsIntroducing the Moving Regression Prediction Bands indicator.
Here I aimed to combine the principles of traditional band indicators (such as Bollinger Bands), regression channel and outlier detection methods. Its upper and lower bands define an interval in which the current price was expected to fall with a prescribed probability, as predicted by the previous-step result of the local polynomial regression (for the original Moving Regression script, see link below).
Algorithm
1. At every time step, the script performs local polynomial regression of the sample data within the lookback window specified by the Length input parameter.
2. The fitted polynomial is used to construct the Moving Regression time series as well as to extrapolate data, that is, to predict the next data point ( MRPrediction ).
3. The accuracy of local interpolation is estimated by means of the root-mean-square error ( RMSE ), that is, the deviation between the fitted polynomial and the observed values.
4. The MRPrediction and RMSE values calculated for the previous bar are then used to build the upper and lower bands , which I define as follows:
Upper Band = MRPrediction_prev + Multiplier *( RMSE_prev )
Lower Band = MRPrediction_prev - Multiplier *( RMSE_prev )
Here the Multiplier is a user-defined parameter that should be interpreted as a quantile in the standard normal distribution (the default value of 2.0 roughly corresponds to the 95% prediction interval).
To visualize the central line , the script offers the following options:
Previous-Period MR Prediction: MRPrediction_prev time series from the above equation.
MR: Conventional Moving Regression time series.
Ribbon: “Previous-Period MR Prediction” and “MR” curves plotted together and colored according to their relative value (green if MR > Previous MR Prediction; red otherwise).
Usage
My original idea was to use the band breakouts as potential trading signals. For example, the price crossing above the upper band is a bullish signal , being a potential sign that price is gaining momentum and is out of a previously predicted trend. The exit signal could be the crossing under the lower band or under the central line.
However, be aware that it is an experimental indicator, so you might fin some better strategies.
Feel free to play around!

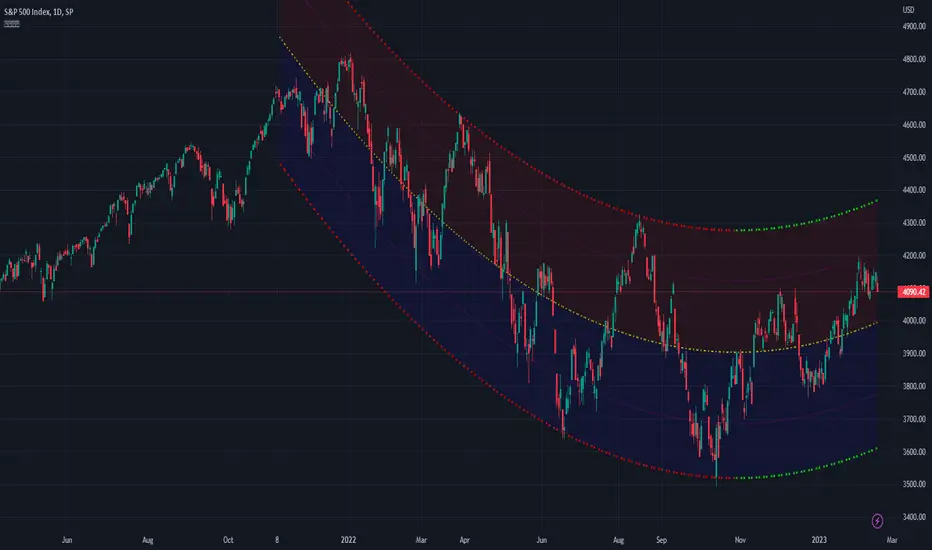
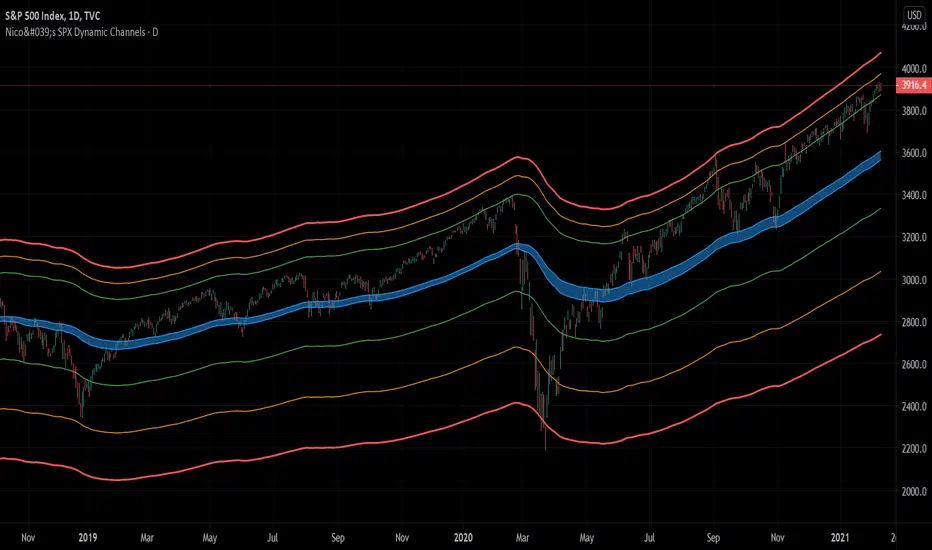
Nico's SPX Dynamic ChannelsTest of dynamic channels and some statistics made by hand.
This indicator was done specifically for the S&P500 index.
As you can see, below the 125 EMA there's a lot more volatility than in the upside. I've made some kind of a dynamic linear regression of the lows and the highs.
I've chosen the MA that best fits the SPX, and then calculated in Excel the percental mean and SDs of most important peaks and valleys that I've chosen in comparison to the 125 MA. This lead to the green, orange and red zones. BUT, I've calculated the peaks and valleys separately, as I assumed that a bear market and crashes have way more volatility than bull markets. That's why the difference between the upper and the lower channels.
The neutral blue zone is composed by an upper EMA of the highs and lower EMA of the lows. No MA in this script uses the close price as a source.
This MA makes sense because it represents a semester of trading, for this particular asset.
Backtest results
It's also interesting to try it here too, as it has a little bit more of data:
SPCFD:SPX
As it's not a trading system, I have no batting average nor ratios for this.
Still, the measures of the peaks and valleys are very accurate and repeat themselves over and over again. The results were:
3rd resistance: 12.88%
2nd resistance: 10.12%
1st resistance: 7.36%
1st support: -6.42%
2nd support: -14.8%
3rd support: -23.18%
All referred to the mean, which is the 125 EMA zone.
After the 1950's works like magic, but not before. You will see that it doesn't work in the great depression and it's crash.
How to use this indicator
Green = First grade support/resistance .
Orange = Second grade support/resistance . Caution.
Red = Third grade support/resistance . High chances of mean reversal.
Blue zone = This is the neutral zone, where the prices are not cheap nor expensive.
Often in a trending market, the price will have the blue zone as it's main support and when trending the price will stick to the green MA.
When the price touches the orange MA, the most probable is that it will return to the green MA.
If the price touches the red zone, there's a high chance that this is a big turning point and it will reverse to the mean (green or blue zone).
Imagine you've bought each time the price touched the red support, check that and you'll start liking this indicator. I think it is a great entry point for investors. The red resistance is good too, but of course it works for a short period of time.
I've backtested this indicator since the beginning of the dataset and it works like magic, but ONLY for the SPX index (spot price).
Leave a comment or some coins if you like it!!!
(I've posted it before like an analysis, not as a script, my bad)
Forecast OscillatorThe Forecast Oscillator is a technical indicator that compares a security close price to its time series forecast. The time series forecast function name is "tsf" and it calculates the projection of the price trend for the next bar.
The Forecast Oscillator and therefore the time series forecast are based on linear regression. The time series forecast indicator is equal to the sum of two other indicators: the linear regression (LinearReg) and the linear regression slope (LinearReg_Slope).
If the Forecast Oscillator stays above the zero line for an extended period, then it signals that the price may rise in the future and if it stays below the zero line for an extended period, then it signals a coming fall in the security price.
The indicator name is "Forecast Oscillator" and it accepts two arguments. The first argument is the time series that is used in the next bar forecast (It is usually the close price) and the second one is the period that will be passed to the time series forecast function during calculation . The technical analysis indicator returns a value in percentage that corresponds to the close price minus the previous value of the time series forecast, multiplied by 100 and divided by the close price.
Author's Note:
Just look at the exaggerated movements of the oscillator especially in trend changes . Some examples can be experienced on the chart in rectangles.
Kıvanç Özbilgiç

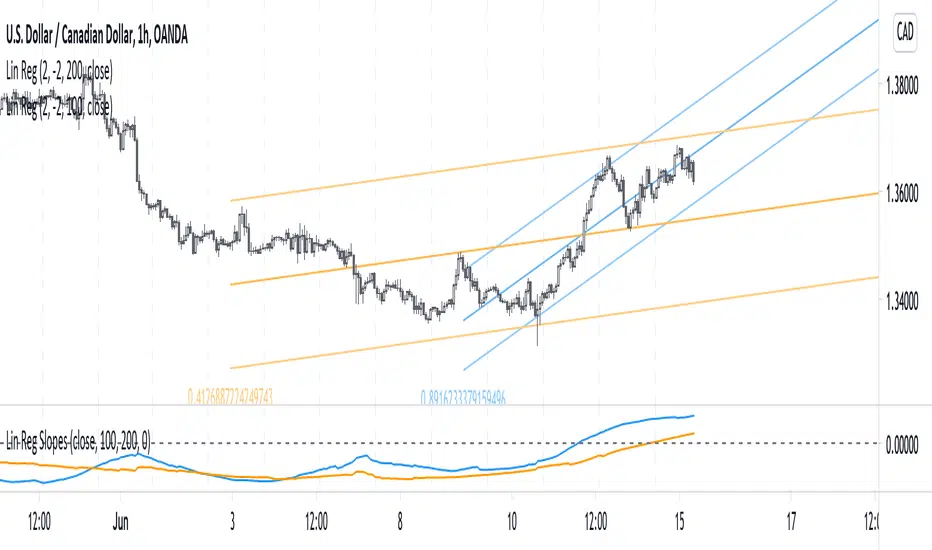
Volume-Supported Linear Regression TrendHello Traders,
Linear Regression gives us some abilities to calculate the trend and if we combine it with volume then we may get very good results. Because if there is no volume support at up/downtrends then the trend may have a reversal soon. we also need to check the trend in different periods. With all this info, I developed Volume-Supported Linear Regression Trend script. The script checks linear regression of price and volume and then calculates trend direction and strength.
You have option to set Source, Short-Term Period and Long-Term Period. you can set them as you wish.
By default:
Close is used as "Source"
Short-Term Period is 20
Long-Term Period is 50
in following screenshot I tried to explain short term trend (for uptrend). Volume supports the trend? any volume pressure on trend? possible reversal? same idea while there is downtrend.
in following screenshot I tried to explain long term trend:
You can also check Positive/Negative Divergences to figure out possible reversals (to automate it, you can use Divergence for Many Indicators v4 , it has ability to check divergences on external indicators)
Enjoy!

Theil–Sen EstimatorThe Theil-Sen estimator is a nonparametric statistics method for robustly fitting a regression line to sample points (1,2).
As stated in the Wikipedia article (3), the method is " the most popular nonparametric technique for estimating a linear trend " in the applied sciences due to its robustness to outliers and limited assumptions regarding measurement errors.
Relation with other Methods
The Theil-Sen estimator can be significantly more accurate than simple linear regression (least squares) for skewed and heteroskedastic data.
Method Description
The script computes all the slopes between pairs of points and takes the median as the estimate of the regression slope, m . Subsequently, the intercept, b , is determined from the sample points as the median of y(i) − m x(i) values. The regression line in the slope–intercept form, y = m x + b , is then plotted along with the calculated prediction interval (estimated by means of the root-mean-square error).
I have added two options for how to handle pairs of points:
Method == "All" to use the slopes of all pairs of points;
Method == "Random" to use the slopes of randomly generated pairs of points.
The random choice of the pairs of points is based on the Wichmann–Hill is a pseudorandom number generator.
The reason for introducing the "Random" method is that the calculation of the median involves sorting the array of slopes (the size of N*(N-1)/2, where N is the number of sample points). This is a computationally demanding procedure, which runs into the limit on the cycle computation time (200 ms) set in TradingView. Therefore, the "All" method works only with Length < 50.
Also note that the number of lookback points is limited by by the maximum array size allowed in TradingView.
Literature
1. Sen, P. K. (1968) "Estimates of the regression coefficient based on Kendall's tau." JASA, 1379-1389.
2. Theil, H. (1950) "A rank-invariant method of linear and polynomial regression analysis." Reprinted in 1992 in Henri Theil’s contributions to economics and econometrics, Springer, 345-381.
3. en.wikipedia.org
