NeoChartLabs McGinley DynamicOne of our Favorite Indicators - the McGinley Dynamic
The MGD is adaptive, it speeds up for crypto and slows down for stocks, this version turns green when bullish and red when bearish - this is a fast indicator so the colors are more reliable on higher time frames.
The McGinley Dynamic is a smart, adaptive moving average technical indicator created by John R. McGinley, designed to overcome the lag and whipsaw issues of traditional moving averages (MAs) by automatically adjusting to varying market speeds, resulting in a smoother, more responsive line that tracks price action better, acting as a reliable trend-following tool or baseline in financial charts.
Shout out to LOXX for the original script, updated to v6.
Média Móvel Adaptativa de Kaufman (MMAK)

Moving VWAP-KAMA CloudMoving VWAP-KAMA Cloud
Overview
The Moving VWAP-KAMA Cloud is a high-conviction trend filter designed to solve a major problem with standard indicators: Noise. By combining a smoothed Volume Weighted Average Price (MVWAP) with Kaufman’s Adaptive Moving Average (KAMA), this indicator creates a "Value Zone" that identifies the true structural trend while ignoring choppy price action.
Unlike brittle lines that break constantly, this cloud is "slow" by design—making it exceptionally powerful for spotting genuine trend reversals and filtering out fakeouts.
How It Works
This script uses a unique "Double Smoothing" architecture:
The Anchor (MVWAP): We take the standard VWAP and smooth it with a 30-period EMA. This represents the "Fair Value" baseline where volume has supported price over time.
The Filter (KAMA): We apply Kaufman's Adaptive Moving Average to the already smoothed MVWAP. KAMA is unique because it flattens out during low-volatility (choppy) periods and speeds up during high-momentum trends.
The Cloud:
Green/Teal Cloud: Bullish Structure (MVWAP > KAMA)
Purple Cloud: Bearish Structure (MVWAP < KAMA)
🔥 The "Reversal Slingshot" Strategy
Backtests reveal a powerful behavior during major trend changes, particularly after long bear markets:
The Resistance Phase: During a long-term downtrend, price will repeatedly rally into the Purple Cloud and get rejected. The flattened KAMA line acts as a "concrete ceiling," keeping the bearish trend intact.
The Breakout & Flip: When price finally breaks above the cloud with conviction, and the cloud flips Green, it signals a structural regime change.
The "Slingshot" Retest: Often, immediately after this flip, price will drop back into the top of the cloud. This is the "Slingshot" moment. The old resistance becomes new, hardened support.
The Rally: From this support bounce, stocks often launch into a sustained, multi-month bull run. This setup has been observed repeatedly at the bottom of major corrections.
How to Use This Indicator
1. Dynamic Support & Resistance
The KAMA Wall: When price retraces into the cloud, the KAMA line often flattens out, acting as a hard "floor" or "wall." A break of this wall usually signals a genuine trend change, not just a stop hunt.
2. Trend Confirmation (Regime Filter)
Bullish Regime: If price is holding above the cloud, only look for Long setups.
Bearish Regime: If price is holding below the cloud, only look for Short setups.
No-Trade Zone: If price is stuck inside the cloud, the market is traversing fair value. Stand aside until a clear winner emerges.
3. Multi-Timeframe Versatility
While designed for trend confirmation on higher timeframes (4H, Daily), this indicator adapts beautifully to lower timeframes (5m, 15m) for intraday scalping.
On Lower Timeframes: The cloud reacts much faster, acting as a dynamic "VWAP Band" that helps intraday traders stay on the right side of momentum during the session.
Settings
Moving VWAP Period (30): The lookback period for the base VWAP smoothing.
KAMA Settings (10, 10, 30): Controls the sensitivity of the adaptive filter.
Cloud Transparency: Adjust to keep your chart clean.
Alerts Included
Price Cross Over/Under MVWAP
Price Cross Over/Under KAMA
Cloud Flip (Bullish/Bearish Trend Change)
Tip for Traders
This is not a signal entry indicator. It is a Trend Conviction tool. Use it to filter your entries from faster indicators (like RSI or MACD). If your fast indicator signals "Buy" but the cloud is Purple, the probability is low. Wait for the Cloud Flip

Average True Range Stop Loss Finder with KAMAATR SL finder with bands
Kaufmann adaptive moving average
ATR SL finder with bands
Kaufmann adaptive moving average

Tunç ŞatıroğluTunç Şatıroğlu's Technical Analysis Suite
Description:
This comprehensive Pine Script indicator, inspired by the technical analysis teachings of Tunç Şatıroğlu, integrates six powerful TradingView indicators into a single, user-friendly suite for robust trend, momentum, and divergence analysis. Each component has been carefully selected and enhanced by beytun to improve functionality, performance, and visual clarity, aligning with Şatıroğlu's approach to technical analysis. The default configuration is meticulously set to match the exact settings of the individual indicators as used by Tunç Şatıroğlu in his training, ensuring authenticity and ease of use for followers of his methodology. Whether you're a beginner or an experienced trader, this suite provides a versatile toolkit for analyzing markets across multiple timeframes.
Included Indicators:
1. WaveTrend with Crosses (by LazyBear, modified): A momentum oscillator that identifies overbought/oversold conditions and trend reversals with clear buy/sell signals via crosses and bar color highlights.
2. Kaufman Adaptive Moving Average (KAMA) (by HPotter, modified): A dynamic moving average that adapts to market volatility, offering a smoother trend-following signal.
3. SuperTrend (by Alex Orekhov, modified): A trend-following indicator that plots dynamic support/resistance levels with buy/sell signals and optional wicks for enhanced accuracy.
4. Nadaraya-Watson Envelope (by LuxAlgo, modified): A non-linear envelope that highlights potential reversals with customizable repainting options for smoother outputs.
5. Divergence for Many Indicators v4 (by LonesomeTheBlue, modified): Detects regular and hidden divergences across multiple indicators (MACD, RSI, Stochastic, CCI, Momentum, OBV, VWMA, CMF, MFI, and more) for early reversal signals.
6. Ichimoku Cloud (TradingView built-in, modified): A multi-faceted indicator for trend direction, support/resistance, and momentum, with enhanced visuals for the Kumo Cloud.
Key Features:
- Authentic Default Settings : Pre-configured to mirror the exact parameters used by Tunç Şatıroğlu for each indicator, ensuring alignment with his proven technical analysis approach.
- Customizable Settings : Enable/disable individual indicators and fine-tune parameters to suit your trading style while retaining the option to revert to Şatıroğlu’s defaults.
- Enhanced User Experience : Modifications improve visual clarity, performance, and usability, with options like repainting smoothing for Nadaraya-Watson and adjustable Ichimoku projection periods.
- Multi-Timeframe Analysis : Combines trend-following, momentum, and divergence tools for a holistic view of market dynamics.
- Alert Conditions : Built-in alerts for SuperTrend direction changes, buy/sell signals, and divergence detections to keep you informed.
- Visual Clarity : Overlays (KAMA, SuperTrend, Nadaraya-Watson, Ichimoku) and pane-based indicators (WaveTrend, Divergences) are clearly distinguished, with customizable colors and styles.
Notes:
- The Nadaraya-Watson Envelope and Ichimoku Cloud may repaint in their default modes. Use the "Repainting Smoothing" option for Nadaraya-Watson or adjust Ichimoku settings to mitigate repainting if preferred.
- Published under the MIT License, with components licensed under GPL-3.0 (SuperTrend), CC BY-NC-SA 4.0 (Nadaraya-Watson), MPL 2.0 (Divergence), and TradingView's terms (Ichimoku Cloud).
Usage:
Add this indicator to your TradingView chart to leverage Tunç Şatıroğlu’s exact indicator configurations out of the box. Customize settings as needed to align with your strategy, and use the combined signals to identify trends, reversals, and divergences. Ideal for traders following Şatıroğlu’s methodologies or anyone seeking a powerful, all-in-one technical analysis tool.
Credits:
Original authors: LazyBear, HPotter, Alex Orekhov, LuxAlgo, LonesomeTheBlue, and TradingView.
Modifications and integration by beytun .
License:
Published under the MIT License, incorporating code under GPL-3.0, CC BY-NC-SA 4.0, MPL 2.0, and TradingView’s terms where applicable.

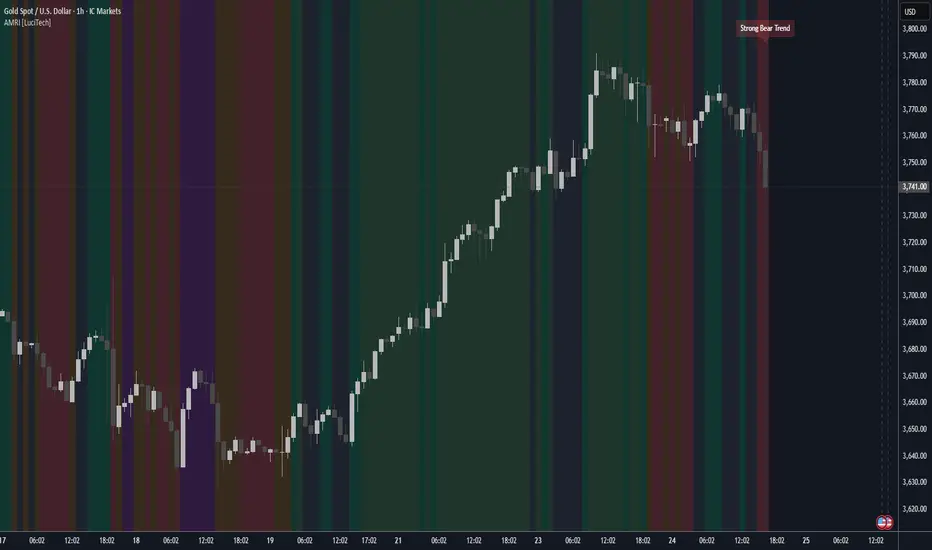
Adaptive Market Regime Identifier [LuciTech]What it Does:
AMRI visually identifies and categorizes the market into six primary regimes directly on your chart using a color-coded background. These regimes are:
-Strong Bull Trend: Characterized by robust upward momentum and low volatility.
-Weak Bull Trend: Indicates upward momentum with less conviction or higher volatility.
-Strong Bear Trend: Defined by powerful downward momentum and low volatility.
-Weak Bear Trend: Suggests downward momentum with less force or increased volatility.
-Consolidation: Periods of low volatility and sideways price action.
-Volatile Chop: High volatility without clear directional bias, often seen during transitions or indecision.
By clearly delineating these states, AMRI helps traders quickly grasp the overarching market context, enabling them to apply strategies best suited for the current conditions (e.g., trend-following in strong trends, range-bound strategies in consolidation, or caution in volatile chop).
How it Works (The Adaptive Edge)
AMRI achieves its adaptive classification by continuously analyzing three core market dimensions, with each component dynamically adjusting to current market conditions:
1.Adaptive Moving Average (KAMA): The indicator utilizes the Kaufman Adaptive Moving Average (KAMA) to gauge trend direction and strength. KAMA is unique because it adjusts its smoothing period based on market efficiency (noise vs. direction). In trending markets, it becomes more responsive, while in choppy markets, it smooths out noise, providing a more reliable trend signal than static moving averages.
2.Adaptive Average True Range (ATR): Volatility is measured using an adaptive version of the Average True Range. Similar to KAMA, this ATR dynamically adjusts its sensitivity to reflect real-time changes in market volatility. This helps AMRI differentiate between calm, ranging markets and highly volatile, directional moves or chaotic periods.
3.Normalized Slope Analysis: The slope of the KAMA is normalized against the Adaptive ATR. This normalization provides a robust measure of trend strength that is relative to the current market volatility, making the thresholds for strong and weak trends more meaningful across different instruments and timeframes.
These adaptive components work in concert to provide a nuanced and responsive classification of the market regime, minimizing lag and reducing false signals often associated with fixed-parameter indicators.
Key Features & Originality:
-Dynamic Regime Classification: AMRI stands out by not just indicating trend or range, but by classifying the type of market regime, offering a higher-level analytical framework. This is a meta-indicator that provides context for all other trading tools.
-Adaptive Core Metrics: The use of KAMA and an Adaptive ATR ensures that the indicator remains relevant and responsive across diverse market conditions, automatically adjusting to changes in volatility and trend efficiency. This self-adjusting nature is a significant advantage over indicators with static lookback periods.
-Visual Clarity: The color-coded background provides an immediate, at-a-glance understanding of the current market regime, reducing cognitive load and allowing for quicker decision-making.
-Contextual Trading: By identifying the prevailing regime, AMRI empowers traders to select and apply strategies that are most effective for that specific environment, helping to avoid costly mistakes of using a trend-following strategy in a ranging market, or vice-versa.
-Originality: While components like KAMA and ATR are known, their adaptive integration into a comprehensive, multi-regime classification system, combined with normalized slope analysis for trend strength, offers a novel approach to market analysis not commonly found in publicly available indicators.
KAMA Trend Flip - SightLing LabsBuckle up, traders—this open-source KAMA Trend Flip indicator is your ticket to sniping trend reversals with a Kaufman Adaptive Moving Average (KAMA) that’s sharper than a Wall Street shark’s tooth. No voodoo, no fluff—just raw, volatility-adaptive math that dances with the market’s rhythm. It zips through trending rockets and chills in choppy waters, slashing false signals like a samurai. Not laggy like the others - this thing is the real deal!
Core Mechanics:
• Efficiency Ratio (ER): Reads the market’s pulse (0-1). High ER = turbo-charged MA, low ER = smooth operator.
• Adaptive Smoothing: Mixes fast (default power 2) and slow (default 30) constants to match market mood swings.
• Trend Signals: KAMA climbs = blue uptrend (bulls run wild). KAMA dips = yellow downtrend (bears take over). Flat = gray snooze-fest.
• Alerts: Instant pings on flips—“Trend Flip Up” for long plays, “Down” for shorts. Plug into bots for set-and-forget domination.
Why It Crushes:
• Smokes static MAs in volatile arenas (crypto, stocks, you name it). Backtests show 20-30% fewer fakeouts than SMA50.
• Visual Pop: Overlays price with bold blue/yellow signals. Slap it on BTC 1D to see trends light up like Times Square.
• Tweakable: Dial ER length (default 50) to your timeframe. Short for scalps, long for swing trades.
Example Settings in Action:
• 10s Chart (Hyper-Scalping): Set Source: Close, ER Length: 100, Fast Power: 1, Slow Power: 6. Catches micro-trends in crypto like a heat-seeking missile. Blue/yellow flips scream entry/exit on fast moves.
• 2m Chart (Quick Trades): Set Source: Close, ER Length: 14, Fast Power: 1, Slow Power: 6. Perfect for rapid trend shifts in stocks or forex. Signals align with momentum bursts—check historical flips for proof.
Deployment:
• Drop it on any chart. Backtest settings to match your asset’s volatility—tweak until it sings.
• Pair with RSI or volume spikes for killer confirmation. Pro move: Enter on flip + volume pop, exit on reverse.
• Strategy-Ready: Slap long/short logic on alerts to build a lean, mean trading machine.
Open source from SightLing Labs—grab it, hack it, profit from it. Share your tweaks in the comments and let’s outsmart the market together. Trade hard, win big!

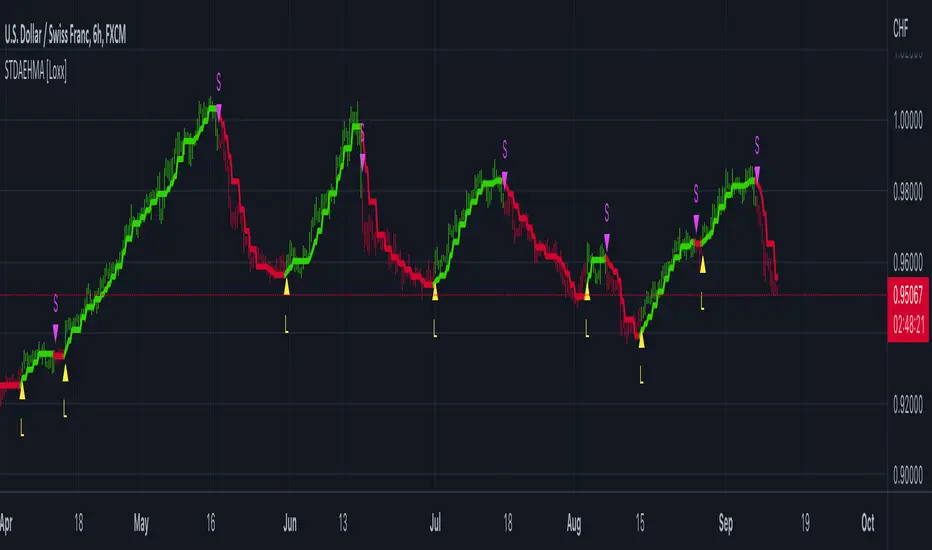
Kaufman Trend Strength Signal█ Overview
Kaufman Trend Strength Signal is an advanced trend detection tool that decomposes price action into its underlying directional trend and localized oscillation using a vector-based Kalman Filter.
By integrating adaptive smoothing and dynamic weighting via a weighted moving average (WMA), this indicator provides real-time insight into both trend direction and trend strength — something standard moving averages often fail to capture.
The core model assumes that observed price consists of two components:
(1) a directional trend, and
(2) localized noise or oscillation.
Using a two-step Predict & Update cycle, the filter continuously refines its trend estimate as new market data becomes available.
█ How It Works
This indicator employs a Kalman Filter model that separates the trend from short-term fluctuations in a price series.
Predict & Update Cycle : With each new bar, the filter predicts the price state and updates that prediction using the latest observed price, producing a smooth but adaptive trend line.
Trend Strength Normalization : Internally, the oscillator component is normalized against recent values (N periods) to calculate a trend strength score between -100 and +100.
(Note: The oscillator is not plotted on the chart but is used for signal generation.)
Filtered MA Line : The trend component is plotted as a smooth Kalman Filter-based moving average (MA) line on the main chart.
Threshold Cross Signals : When the internal trend strength crosses a user-defined threshold (default: ±60), visual entry arrows are displayed to signal momentum shifts.
█ Key Features
Adaptive Trend Estimation : Real-time filtering that adjusts dynamically to market changes.
Visual Buy/Sell Signals : Entry arrows appear when the trend strength crosses above or below the configured threshold.
Built-in Range Filter : The MA line turns blue when trend strength is weak (|value| < 10), helping you filter out choppy, sideways conditions.
█ How to Use
Trend Detection :
• Green MA = bullish trend
• Red MA = bearish trend
• Blue MA = no trend / ranging market
Entry Signals :
• Green triangle = trend strength crossed above +Threshold → potential bullish entry
• Red triangle = trend strength crossed below -Threshold → potential bearish entry
█ Settings
Entry Threshold : Level at which the trend strength triggers entry signals (default: 60)
Process Noise 1 & 2 : Control the filter’s responsiveness to recent price action. Higher = more reactive; lower = smoother.
Measurement Noise : Sets how much the filter "trusts" price data. High = smoother MA, low = faster response but more noise.
Trend Lookback (N2) : Number of bars used to normalize trend strength. Lower = more sensitive; higher = more stable.
Trend Smoothness (R2) : WMA smoothing applied to the trend strength calculation.
█ Visual Guide
Green MA Line → Bullish trend
Red MA Line → Bearish trend
Blue MA Line → Sideways/range
Green Triangle → Entry signal (trend strengthening)
Red Triangle → Entry signal (trend weakening)
█ Best Practices
In high-volatility conditions, increase Measurement Noise to reduce false signals.
Combine with other indicators (e.g., RSI, MACD, EMA) for confirmation and filtering.
Adjust "Entry Threshold" and noise settings depending on your timeframe and trading style.
❗ Disclaimer
This script is provided for educational purposes only and should not be considered financial advice or a recommendation to buy/sell any asset.
Trading involves risk. Past performance does not guarantee future results.
Always perform your own analysis and use proper risk management when trading.

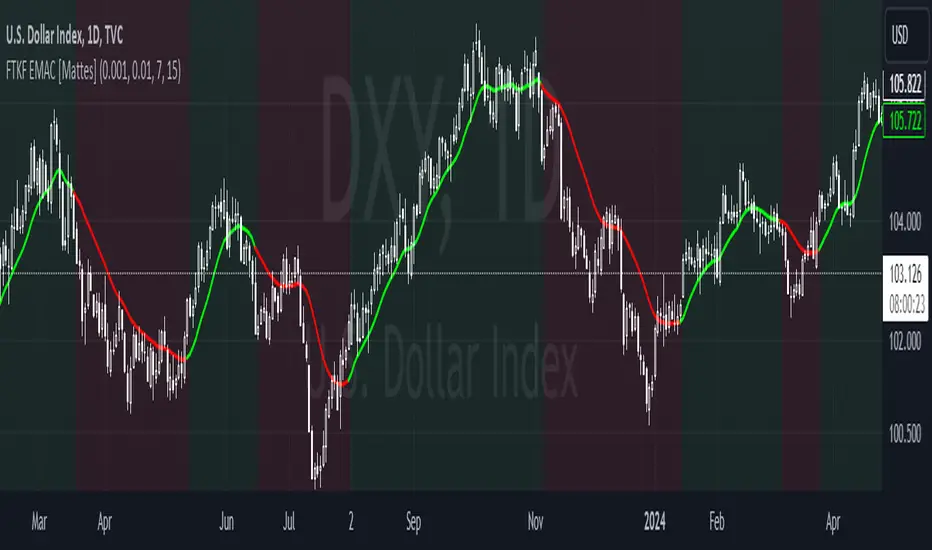
Fourier Transformed & Kalman Filtered EMA Crossover [Mattes]The Fourier Transformed & Kalman Filtered EMA Crossover (FTKF EMAC) is a trend-following indicator that leverages Fourier Transform approximation, Kalman Filtration, and two Exponential Moving Averages (EMAs) of different lengths to provide accurate and smooth market trend signals. By combining these three components, it captures the underlying market cycles, reduces noise, and produces actionable insights, making it suitable for detecting both emerging trends and confirming existing ones.
TECHNICALITIES:
>>> The Fourier Transform approximation is designed to identify dominant cyclical patterns in price action by focusing on key frequencies, while filtering out noise and less significant movements. It emphasizes the most meaningful price cycles, enabling the indicator to isolate important trends while ignoring minor fluctuations. This cyclical awareness adds an extra layer of depth to trend detection, allowing the EMAs to work with a cleaner and more reliable data set.
>>> The Kalman Filter adds dynamic noise reduction, adjusting its predictions of future price trends based on past and current data. As new price data comes in, the filter recalibrates itself to ensure that the price action remains smooth and devoid of erratic movements. This real-time adjustment is key to minimizing lag while avoiding false signals, which ensures that the EMAs react to more accurate and stable market data. The Kalman Filter’s ability to smooth price data without losing sensitivity to trend changes complements the Fourier approximation, ensuring a high level of precision in volatile and stable market environments.
>>> The EMA Crossover involves using two EMAs: a shorter EMA that reacts quickly to price movements and a longer EMA that responds more slowly. The shorter EMA is responsible for capturing immediate market shifts, detecting potential bullish or bearish trends. The longer EMA smooths out price fluctuations and provides trend confirmation, working with the shorter EMA to ensure the signals are reliable. When the shorter EMA crosses above the longer EMA, it indicates a bullish trend, likewise when it goes below the longer EMA, it signals a bearish trend. This setup provides a clear way to track market direction, with color-coded signals (green for bullish, red for bearish) for visual clarity. The flexibility of adjusting the EMA periods allows traders to fine-tune the indicator to their preferred timeframe and strategy, making it adaptable to different market conditions.
|-> A key technical aspect is that the first EMA should always be shorter than the second one. If the first EMA is longer than the second, the tool’s effectiveness is compromised because the faster EMA is designed to signal long conditions, while the longer one is made for signaling a bearish trend. Reversing their roles would lead to delayed or confused signals, reducing the indicator’s ability to detect trend shifts early and making it less efficient in volatile markets. This is the only key weakness of the indicator, failure to submit to this rule will result in confusion.
>>> These components work together like a clock to create a comprehensive and effective trend-following system. The Fourier approximation highlights key cyclical movements, the Kalman Filter refines these movements by removing noise, and the EMAs interpret the filtered data to generate actionable trend signals. Each component enhances the next, ensuring that the final output is both responsive and reliable, with minimal false signals or lag. creating an indicator using widespread concepts which haven't been combined before.
Summary
This indicator combines Fourier Transform approximation, Kalman Filtration, and two EMAs of different lengths to deliver accurate and timely trend-following signals. The Fourier approximation identifies dominant market cycles, while the Kalman Filter dynamically removes noise and refines the price data in real time. The two EMAs then use this filtered data to generate buy and sell signals based on their crossovers. The shorter EMA reacts quickly to price changes, while the longer EMA provides smoother trend confirmation. The components work in synergy to capture trends with minimal false signals or lag, ensuring traders can act promptly on market shifts. Customizable EMA periods make the tool adaptable to different market conditions, enhancing its versatility for various trading strategies.
To use the indicator, traders should adjust the EMA lengths based on their timeframe and strategy, ensuring that the shorter EMA remains shorter than the longer EMA to preserve the tool’s responsiveness. The color-coded signals offer visual clarity, making it easy to identify potential entry and exit points. This confluence of Fourier, Kalman, and EMA methodologies provides a smooth, highly effective trend-following tool that excels in both trending and ranging markets.
KAMA CloudDescription:
The KAMA Cloud indicator is a sophisticated trading tool designed to provide traders with insights into market trends and their intensity. This indicator is built on the Kaufman Adaptive Moving Average (KAMA), which dynamically adjusts its sensitivity to filter out market noise and respond to significant price movements. The KAMA Cloud leverages multiple KAMAs to gauge trend direction and strength, offering a visual representation that is easy to interpret.
How It Works:
The KAMA Cloud uses twenty different KAMA calculations, each set to a distinct lookback period ranging from 5 to 100. These KAMAs are calculated using the average of the open, high, low, and close prices (OHLC4), ensuring a balanced view of price action. The relative positioning of these KAMAs helps determine the direction of the market trend and its momentum.
By measuring the cumulative relative distance between these KAMAs, the indicator effectively assesses the overall trend strength, akin to how the Average True Range (ATR) measures market volatility. This cumulative measure helps in identifying the trend’s robustness and potential sustainability.
The visualization component of the KAMA Cloud is particularly insightful. It plots a 'cloud' formed between the base KAMA (set at a 100-period lookback) and an adjusted KAMA that incorporates the cumulative relative distance scaled up. This cloud changes color based on the trend direction — green for upward trends and red for downward trends, providing a clear, visual representation of market conditions.
Benefits:
Dynamic Sensitivity: By adapting to the market's volatility, KAMA provides more reliable signals than traditional moving averages.
Trend Clarity: The color-coded cloud visually enhances the perception of the trend’s direction and strength, making it easier for traders to decide on their trading strategy.
Versatility: Suitable for various asset classes, including stocks, forex, commodities, and cryptocurrencies, across different timeframes.
Decision Support: Helps traders understand not just the direction but the strength of trends, aiding in more informed decision-making regarding entries, exits, and risk management.
Usage:
The KAMA Cloud is ideal for traders who need a robust trend-following tool that adjusts according to market dynamics. It can be used as a standalone indicator or in conjunction with other technical analysis tools to enhance trading strategies. Look for the cloud’s color shifts as potential signals for trend reversals or continuations, and consider the cloud’s thickness as an indication of trend strength.
Whether you are a day trader, swing trader, or long-term investor, the KAMA Cloud offers a unique approach to understanding market trends, helping you navigate the complexities of various market conditions with confidence.

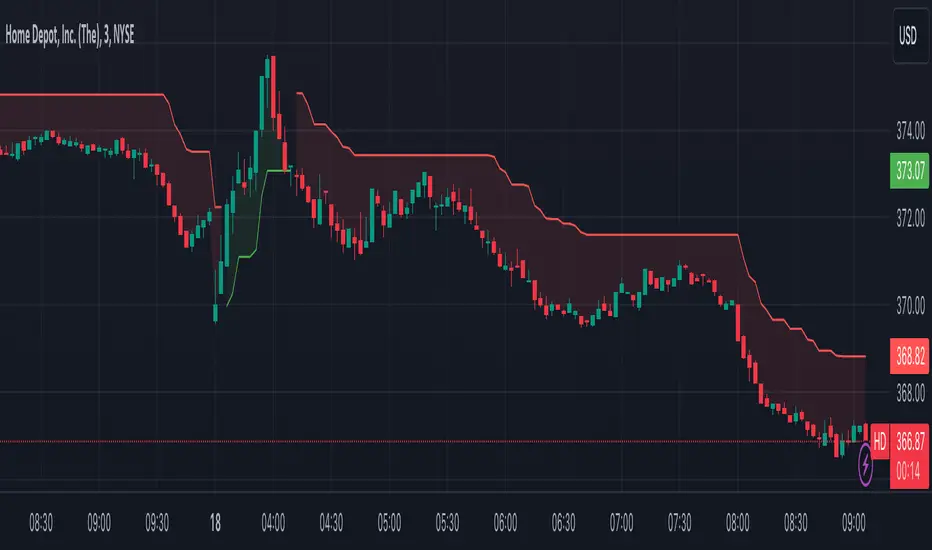
No Lag SupertrendNo Lag Supertrend indicator improves upon the original supertrend by incorporating calculation methods that enhance responsiveness and accuracy. Traditional supertrend indicators often suffer from lag, which can delay signals and affect trading decisions. No Lag Supertrend addresses this issue through the use of KAMA (Kaufman’s Adaptive Moving Average) and Hull ATR (Average True Range) calculations.
Goals of No Lag Supertrend:
- Lag reduction: one of the main issues with traditional supertrend indicators is their lag, which can result in delayed entry and exit signals. By integrating KAMA and Hull ATR, the no lag supertrend minimizes this delay, providing more timely signals.
- Market Noise Filtering: The combined use of KAMA and Hull ATR effectively filters out market noise, ensuring that signals are based on significant price movements rather than minor fluctuations.
- Consistency Across Different Market Conditions: The adaptive nature of KAMA and the smooth responsiveness of Hull ATR ensure that the No Lag Supertrend performs consistently across various market conditions, from trending to volatile markets.
Credits: This code is based on the TradingView supertrend but improved the ATR calculations.
Kaufman Efficiency Ratio (KER)The Kaufman Efficiency Ratio (also known as the Efficiency Ratio or ER) is a technical indicator used in technical analysis to measure the efficiency of a financial instrument's price movement. It was developed by Perry J. Kaufman and is designed to help traders and analysts identify the trendiness or choppiness of a market.
The Kaufman Efficiency Ratio is calculated using the following formula:
ER = (Change in Price over N periods) / (Sum of the absolute price changes over N periods)
Here's how the formula works:
"Change in Price over N periods" is the net price change over a specified number of periods (usually days or bars). It's calculated by subtracting the closing price of N periods ago from the current closing price.
"Sum of the absolute price changes over N periods" is the sum of the absolute values of price changes (i.e., ignoring the direction) over the same N periods.
The resulting Efficiency Ratio (ER) value will fall within the range of 0 to 1, with 1 indicating a perfectly trending market and 0 indicating a perfectly choppy or range-bound market. In other words, the closer the ER is to 1, the stronger and more efficient the trend is perceived to be.

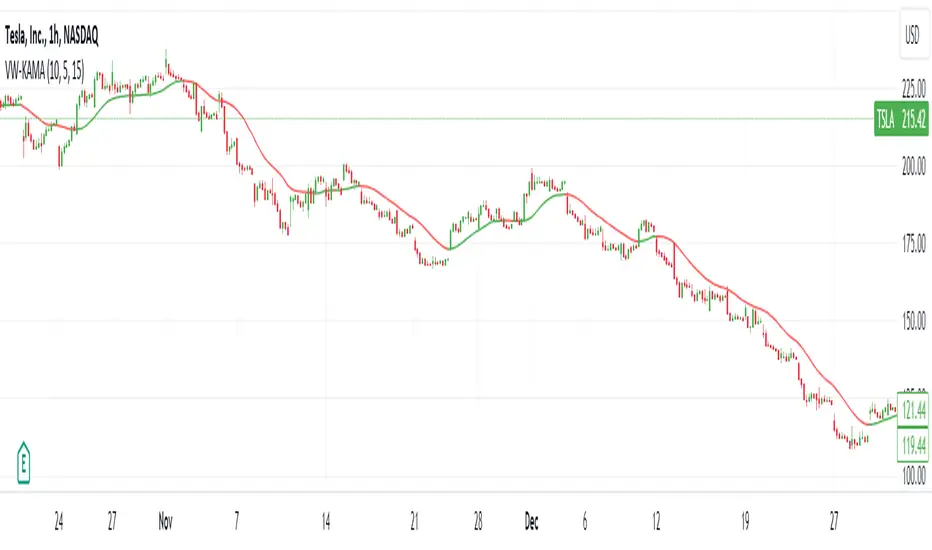
Volume-Weighted Kaufman's Adaptive Moving AverageThe Volume-Weighted Kaufman's Adaptive Moving Average (VW-KAMA) is a technical indicator that combines the Volume-Weighted Moving Average (VWMA) and the Kaufman's Adaptive Moving Average (KAMA) to create a more responsive and adaptable moving average.
Advantages:
Volume-Weighted: It takes into account the volume of trades, giving more weight to periods with higher trading volume, which can help filter out periods of low activity.
Adaptive: The indicator adjusts its smoothing constant based on market conditions, becoming more sensitive in trending markets and less sensitive in choppy or sideways markets.
Versatility: VW-KAMA can be used for various purposes, including trend identification, trend following, and determining potential reversal points and act as dynamic support and resistance level.
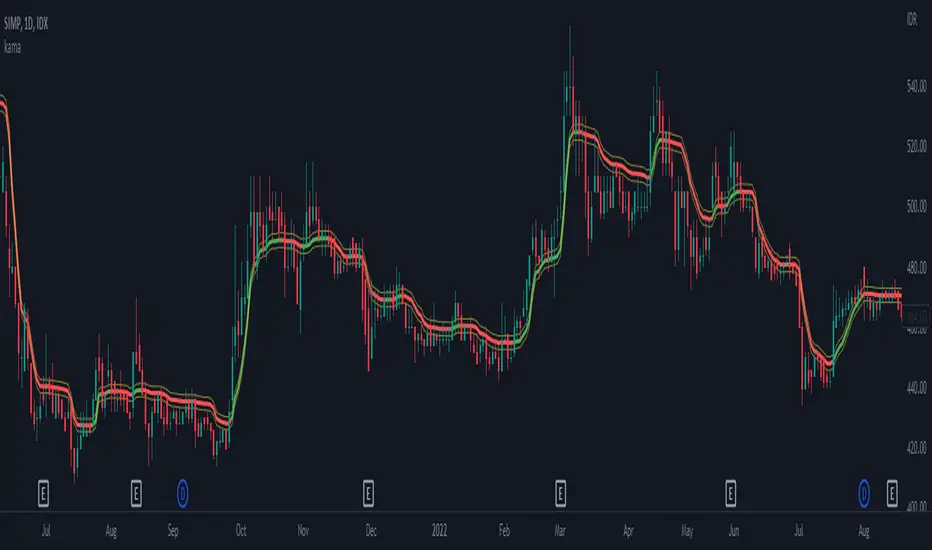
kama
█ Description
An adaptive indicator could be defined as market conditions following indicator, in summary, the parameter of the indicator would be adjusted to fit its optimum value to the current price action. KAMA, Kaufman's Adaptive Moving Average, an adaptive trendline indicator developed by Perry J. Kaufman, with the notion of using the fastest trend possible based on the smallest calculation period for the existing market conditions, by applying an exponential smoothing formula to vary the speed of the trend (changing smoothing constant each period), as cited from Trading Systems and Methods p.g. 780 (Perry J. Kaufman). In this indicator, the proposed notion is on the Efficiency Ratio within the computation of KAMA, which will use a Dominant Cycle instead, an adaptive filter developed by John F. Ehlers, on determining the n periods, aiming to achieve an optimum lookback period, with respect to the original Efficiency Ratio calculation period of less than 14, and 8 to 10 is preferable.
█ Kaufman's Adaptive Moving Average
kama_ = kama + smoothing_constant * (price - kama )
where:
price = current price (source)
smoothing_constant = (efficiency_ratio * (fastest - slowest) + slowest)^2
fastest = 2/(fastest length + 1)
slowest = 2/(slowest length + 1)
efficiency_ratio = price - price /sum(abs(src - src , int(dominant_cycle))
█ Feature
The indicator will have a specified default parameter of: length = 14; fast_length = 2; slow_length = 30; hp_period = 48; source = ohlc4
KAMA trendline i.e. output value if price above the trendline and trendline indicates with green color, consider to buy/long position
while, if the price is below the trendline and the trendline indicates red color, consider to sell/short position
Hysteresis Band
Bar Color
other example
Cong Adaptive Moving AverageDr. Scott Cong's new adaptation of an adaptive moving average (AMA), featured in TASC March 2023.
It adjusts its parameters automatically according to the volatility of market, tracking price closely in trending movement, staying flat in congestion areas.
Perry Kaufman’s adaptive moving average, first described in his 1995 book Smarter Trading, is a great example of how an AMA can self-adjust to adapt to changing environments. This indicator presents a new scheme for an adaptive moving average that is responsive, smooth, and robust.

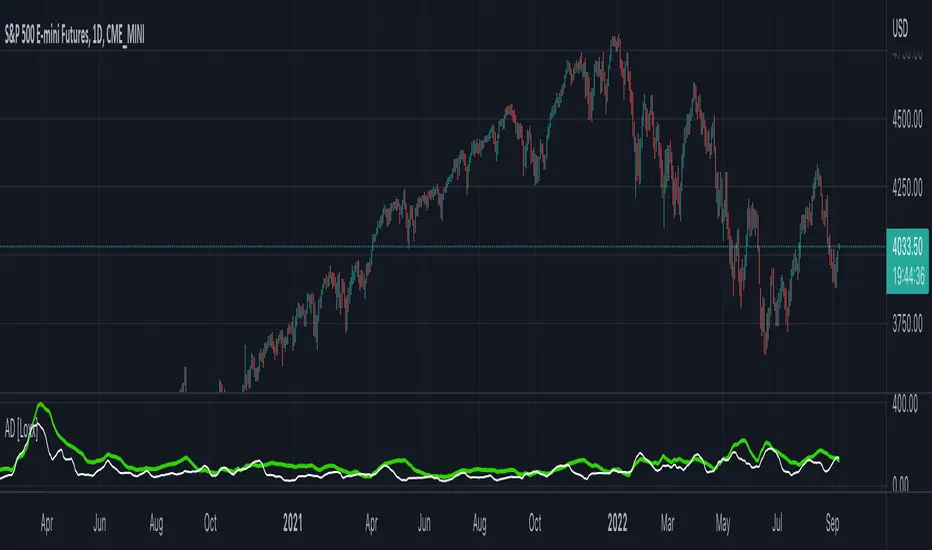
Another New Adaptive Moving Average [CC]The New Adaptive Moving Average was created by Scott Cong (Stocks and Commodities Mar 2023) and this is a companion indicator to my previous script . This indicator still works off of the same concept as before with effort vs results but this indicator takes a slightly different approach and instead defines results as the absolute difference between the closing price and a closing price x bars ago. As you can see in my chart example, this indicator works great to stay with the current trend and provides either a stop loss or take profit target depending on which direction you are going in. As always, I use darker colors to show stronger signals and lighter colors to show normal signals. Buy when the line turns green and sell when it turns red.
Let me know if there are any other indicator scripts you would like to see me publish!

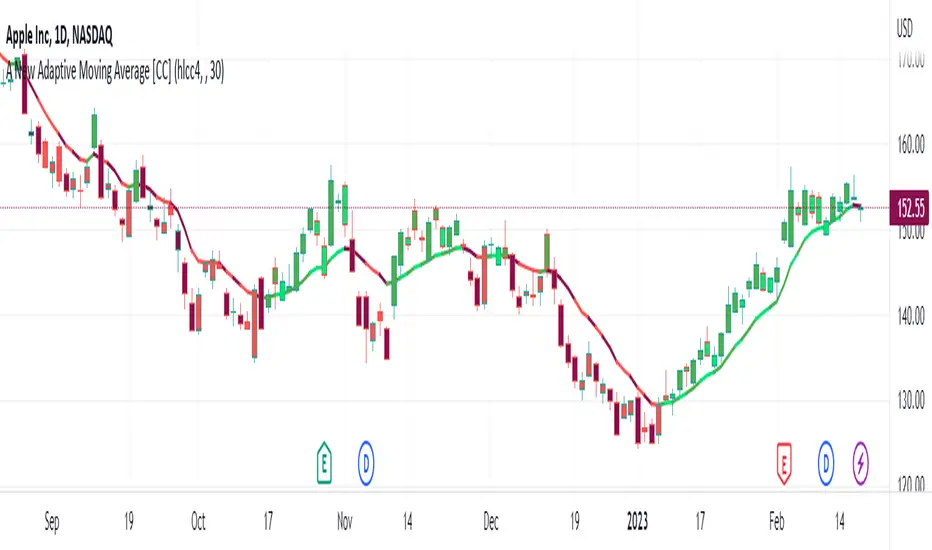
A New Adaptive Moving Average [CC]The New Adaptive Moving Average was created by Scott Cong (Stocks and Commodities Mar 2023) and his idea was to focus on the Adaptive Moving Average created by Perry Kaufman and to try to improve it by introducing a concept of effort vs results. In this case the effort would be the total range of the underlying price action since each bar is essentially a war of the bulls vs the bears. The result would be the total range of the close so we are looking for the highest close and lowest close in that same time period. This gives us an alpha that we can use to plug into the Kaufman Adaptive Moving Average algorithm which gives us a brand new indicator that can hug the price just enough to allow us to ride the stock up or down. I have color coded it to be darker colors when it is a strong signal and lighter colors when it is a normal signal. Buy when the line turns green and sell when it turns red.
Let me know if there are any other indicators you would like to see me publish!
VHF Adaptive Linear Regression KAMAIntroduction
Heyo, in this indicator I decided to add VHF adaptivness, linear regression and smoothing to a KAMA in order to squeeze all out of it.
KAMA:
Developed by Perry Kaufman, Kaufman's Adaptive Moving Average (KAMA) is a moving average designed to account for market noise or volatility. KAMA will closely follow prices when the price swings are relatively small and the noise is low. KAMA will adjust when the price swings widen and follow prices from a greater distance. This trend-following indicator can be used to identify the overall trend, time turning points and filter price movements.
VHF:
Vertical Horizontal Filter (VHF) was created by Adam White to identify trending and ranging markets. VHF measures the level of trend activity, similar to ADX DI. Vertical Horizontal Filter does not, itself, generate trading signals, but determines whether signals are taken from trend or momentum indicators. Using this trend information, one is then able to derive an average cycle length.
Linear Regression Curve:
A line that best fits the prices specified over a user-defined time period.
This is very good to eliminate bad crosses of KAMA and the pric.
Usage
You can use this indicator on every timeframe I think. I mostly tested it on 1 min, 5 min and 15 min.
Signals
Enter Long -> crossover(close, kama) and crossover(kama, kama )
Enter Short -> crossunder(close, kama) and crossunder(kama, kama )
Thanks for checking this out!
--
Credits to
▪️@cheatcountry – Hann Window Smoohing
▪️@loxx – VHF and T3
▪️@LucF – Gradient
ER-Adaptive ATR Limit Channels w/ States [Loxx]As simple as it gets, channels based on high, low and ATR distances, Shows possible short term support / resistance or can be used as a take profit/stop-loss in some trading systems. It does this by comparing high/low values of price to multiplied by a multiple of ATR to determine when the trend changes. States are included to change the sensitivity to trend changes. 1 is very sensitive, 3 is least sensitive.
This uses Loxx's Expanded Source Types. You can read about them here:
What is ER Adaptive ATR?
Average True Range (ATR) is widely used indicator in many occasions for technical analysis . It is calculated as the RMA of true range. This version adds a "twist": it uses Perry Kaufman's Efficiency Ratio to calculate adaptive true range

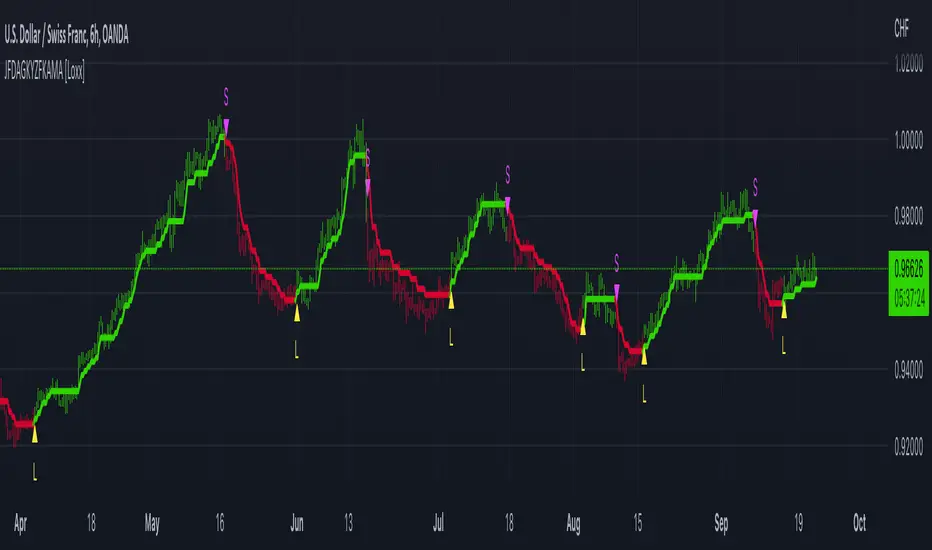
JFD-Adaptive, GKYZ-Filtered KAMA [Loxx]JFD-Adaptive, GKYZ-Filtered KAMA is a Kaufman Adaptive Moving Average with the option to make it Jurik Fractal Dimension Adaptive. This also includes a Garman-Klass-Yang-Zhang Historical Volatility Filter to reduce noise.
What is KAMA?
Developed by Perry Kaufman, Kaufman's Adaptive Moving Average ( KAMA ) is a moving average designed to account for market noise or volatility . KAMA will closely follow prices when the price swings are relatively small and the noise is low. KAMA will adjust when the price swings widen and follow prices from a greater distance. This trend-following indicator can be used to identify the overall trend, time turning points and filter price movements.
What is Jurik Fractal Dimension?
There is a weak and a strong way to measure the random quality of a time series.
The weak way is to use the random walk index ( RWI ). You can download it from the Omega web site. It makes the assumption that the market is moving randomly with an average distance D per move and proposes an amount the market should have changed over N bars of time. If the market has traveled less, then the action is considered random, otherwise it's considered trending.
The problem with this method is that taking the average distance is valid for a Normal (Gaussian) distribution of price activity. However, price action is rarely Normal, with large price jumps occuring much more frequently than a Normal distribution would expect. Consequently, big jumps throw the RWI way off, producing invalid results.
The strong way is to not make any assumption regarding the distribution of price changes and, instead, measure the fractal dimension of the time series. Fractal Dimension requires a lot of data to be accurate. If you are trading 30 minute bars, use a multi-chart where this indicator is running on 5 minute bars and you are trading on 30 minute bars.
What is Garman-Klass-Yang-Zhang Historical Volatility?
Yang and Zhang derived an extension to the Garman Klass historical volatility estimator that allows for opening jumps. It assumes Brownian motion with zero drift. This is currently the preferred version of open-high-low-close volatility estimator for zero drift and has an efficiency of 8 times the classic close-to-close estimator. Note that when the drift is nonzero, but instead relative large to the volatility , this estimator will tend to overestimate the volatility . The Garman-Klass-Yang-Zhang Historical Volatility calculation is as follows:
GKYZHV = sqrt((Z/n) * sum((log(open(k)/close( k-1 )))^2 + (0.5*(log(high(k)/low(k)))^2) - (2*log(2) - 1)*(log(close(k)/open(2:end)))^2))
Included
Alerts
Signals
Loxx's Expanded Source Types
Bar coloring
STD-Filtered, Adaptive Exponential Hull Moving Average [Loxx]STD-Filtered, Adaptive Exponential Hull Moving Average is a Kaufman Efficiency Ratio Adaptive Hull Moving Average that uses EMA instead of WMA for its computation. I've also added standard deviation stepping to further smooth the signal. Using EMA instead of WMA turns the Hull into what's called the AEHMA. You can read more about the EHMA here: eceweb1.rutgers.edu
What is the traditional Hull Moving Average?
The Hull Moving Average (HMA) attempts to minimize the lag of a traditional moving average while retaining the smoothness of the moving average line. Developed by Alan Hull in 2005, this indicator makes use of weighted moving averages to prioritize more recent values and greatly reduce lag. The resulting average is more responsive and well-suited for identifying entry points.
What is Kaufman's Efficiency Ratio?
The Efficiency Ratio (ER) was first presented by Perry Kaufman in his 1995 book ‘Smarter Trading‘. It is calculated by dividing the price change over a period by the absolute sum of the price movements that occurred to achieve that change. The resulting ratio ranges between 0 and 1 with higher values representing a more efficient or trending market.
The value of the ER ranges between 0 and 1. It has the value of 1 when prices move in the same direction for the full time over which the indicator is calculated, e.g. n bars period. It has a value of 0 when prices are unchanged over the n periods. When prices move in wide swings within the interval, the sum of the denominator becomes very large compared to the numerator and ER approaches zero.
Some uses for ER:
A qualifier for a trend following trade; a trend is considered “persistent” only when RE is above a certain value, e.g. 0.3 or 0.4 .
A filter to screen out choppy stocks/markets, where breakouts are frequently “fakeouts”.
In an adaptive trading system, helping to determine whether to apply a trend following algorithm or a mean reversion algorithm.
It is used in the calculation of Kaufman’s Adaptive Moving Average (KAMA).
How to calculate the Hull Adaptive Moving Average (HAMA)
Find Signal to Noise ratio (SNR)
Normalize SNR from 0 to 1
Calculate adaptive alphas
Apply EMAs
Included
Bar coloring
Signals
Alerts
Loxx's Expanded Source Types
Adaptive Deviation [Loxx]Adaptive Deviation is an educational/conceptual indicator that is a new spin on the regular old standard deviation. By definition, the Standard Deviation (STD, also represented by the Greek letter sigma σ or the Latin letter s) is a measure that is used to quantify the amount of variation or dispersion of a set of data values. In technical analysis we usually use it to measure the level of current volatility.
Standard Deviation is based on Simple Moving Average calculation for mean value. This version of standard deviation uses the properties of EMA to calculate what can be called a new type of deviation, and since it is based on EMA, we can call it EMA deviation. And added to that, Perry Kaufman's efficiency ratio is used to make it adaptive (since all EMA type calculations are nearly perfect for adapting).
The difference when compared to standard is significant--not just because of EMA usage, but the efficiency ratio makes it a "bit more logical" in very volatile market conditions.
The green line is the Adaptive Deviation, the white line is regular Standard Deviation. This concept will be used in future indicators to further reduce noise and adapt to price volatility.
Included
Loxx's Expanded Source Types
Adaptive Rebound Line (ARL)The Adaptive Rebound Line (ARL) focuses on the rebound of price action according to the trend.
While it does not focus on showing the trend, it does help in anticipating price rebounds.
It achieves this by adapting quickly and by reducing lag.
It is recommended to use this with a trend-identifying indicator.
It was inspired by the Hull Moving Average and the KAMA.
Additional indicator show in the chart is Tide Finder Plus .

ER-Adaptive ATR [Loxx]Average True Range (ATR) is widely used indicator in many occasions for technical analysis. It is calculated as the RMA of true range. This version adds a "twist": it uses Perry Kaufman's Efficiency Ratio to calculate adaptive true range
You can use this indicator the same way you'd use the standard ATR.
