Systematic Momentum strategy v 1.0Systematic Momentum strategy v 1.0
This is a long-only strategy optimized taking into consideration the underlying's momentum and volatily.
Long story short it opens positions when the momentum is highest and the risk is lowest and closes the same position when the risk-to-reward is no longer optimal.
How to use:
-> To be used on an Index or a tracker ETF
-> Position sizing should be set up to 100% of the portfolio
Investment

Hash Ribbons Backtest - Bitcoin Beats YT
Hello Hello Hello and welcome back to Bitcoin Beats!
This is a script written by capriole_charles
Go check out the original!
I have added leverage and stoploss % but also made it a strategy so we can look back at past trades to see patterns and profit.
Personally I feel this is not enough data to trade off as BTC is such a young asset. However I have seen other models similar to this for other assets that hold strong.
Trade safe!
Good bye from bitcoin beats!
Not Meant For The 1H! My Bad! higher timeframes are better!
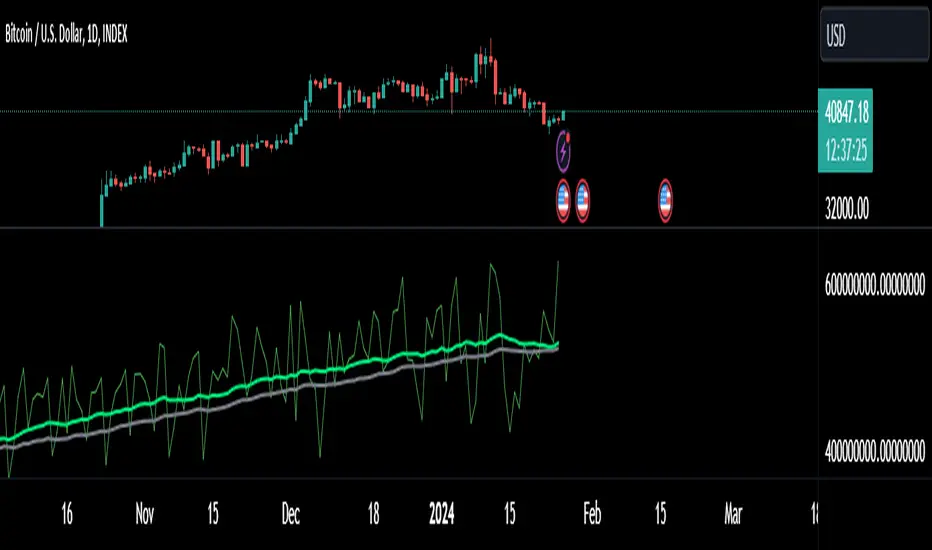
The "Spring" is the confirmed Miner capitulation period:
The 1st "gray" circle is the start of Capitulation (1 month Hash Rate crosses UNDER 2 month Hash Rate)
Last "green" circle is the end of Capitulation (1 month Hash Rate crosses OVER 2 month Hash Rate)
The "greener" the spring gets (up until blue) represents Hash Rate recovery (it is increasing)
The "blue" circle is the first instance of positive momentum following recovery of Hash Rate (1m HR > 2m HR). This is historically a rewarding place to buy with limited downside.
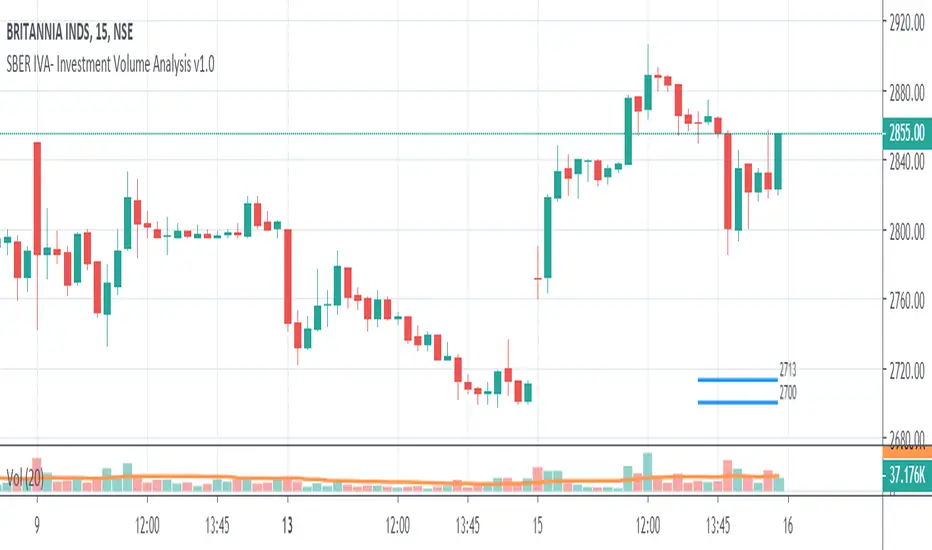
SBER IVA - Investment Volume Analysis v1.0IVA or Investment Volume Analysis indicator checks for accumulation and distribution by the investors and highlights the levels as below:
Red levels - Distribution is ON
What to do? Either minimize the investment or book profit
If price is above Red levels, it is highly likely to be a trap or manipulated move, even best moves at times can be trap.
Blue levels - Accumulation is ON
What to do? Either initiate investment or increase the exposure as per your risk appetite
If price is below Blue levels, it is highly likely to be a trap or manipulated move, even best moves at times can be trap.
Advanced usage:
With SBER EMA48 channel - If price breakout of the channel and accumulation IVA zone, then it is considered both value and volume investment.
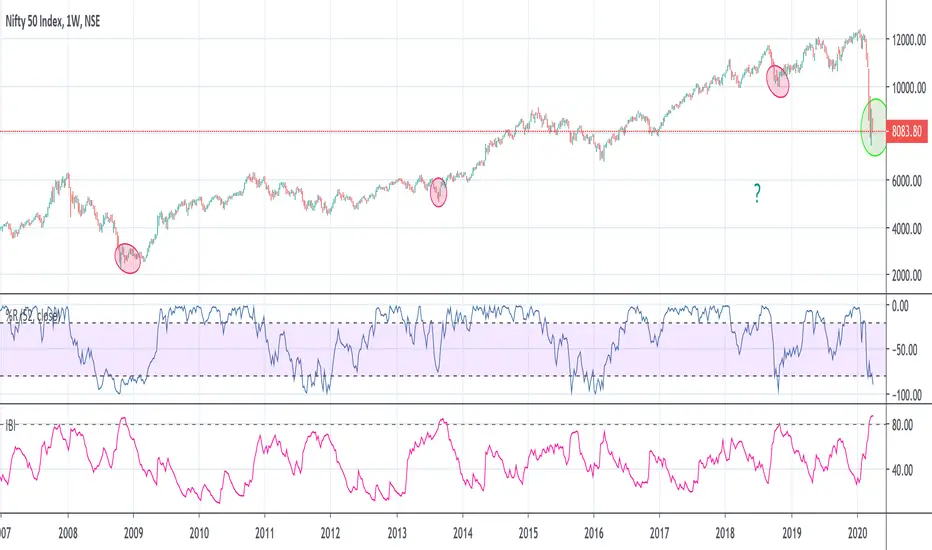
Investment Bottom IndicatorWant to know when the market has reached near bottom in selloff or bearish trend?
You now have a perfect indicator for that - "Investment Bottom Indicator"
How to use?
Chart Setup-
Step 1- Add your index symbol
Step 2- Change the time frame to weekly (candle sticks)
Step 3- Add William %R - settings: Period- 52, Close
Step 4- Add this indicator - Investment Bottom Indicator
Analysis-
When the William %R value is below -80 & Investment Bottom Indicator value is above 80 : this indicates that the market is near its bottom and if you have not yet started investing yet, this is the right time before the market flies off (in very few weeks/months) & you miss the bus!
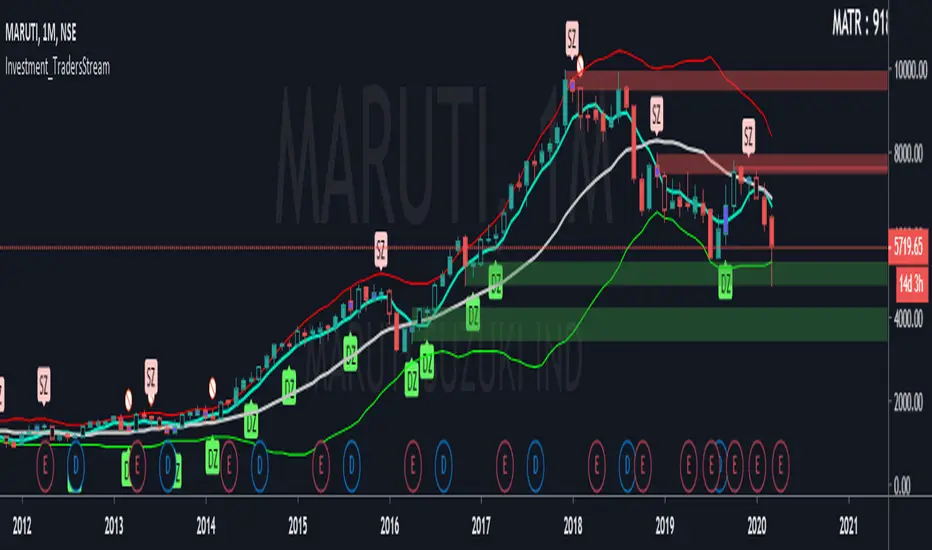
Investment_TradersStreamHello Guys here we are introducing another important tool, in that you can anticipate when to enter Market for Long term Investment and when to Exit you Positions from Long term Investments. We introduced some of uniq indicators that helps to calculate the Risk. Those are Exhaust Candle, Time or Price correction of stock after a strong movement special Moving average to calculate monthly Trend and one of the popular indicator to know that how much movement happened in a stock from a mean line (Bollinger Band). Please comment below for any information.......
Return on Investment (ROI)Return on Investment (ROI) is a performance measure used to evaluate the efficiency of an investment in a particular asset.
This tool provides a %-based ROI that can be calculated starting from a specific date or across the entire history of an instrument.
Don't forget to toss a coin to your witcher (see the requisites below)


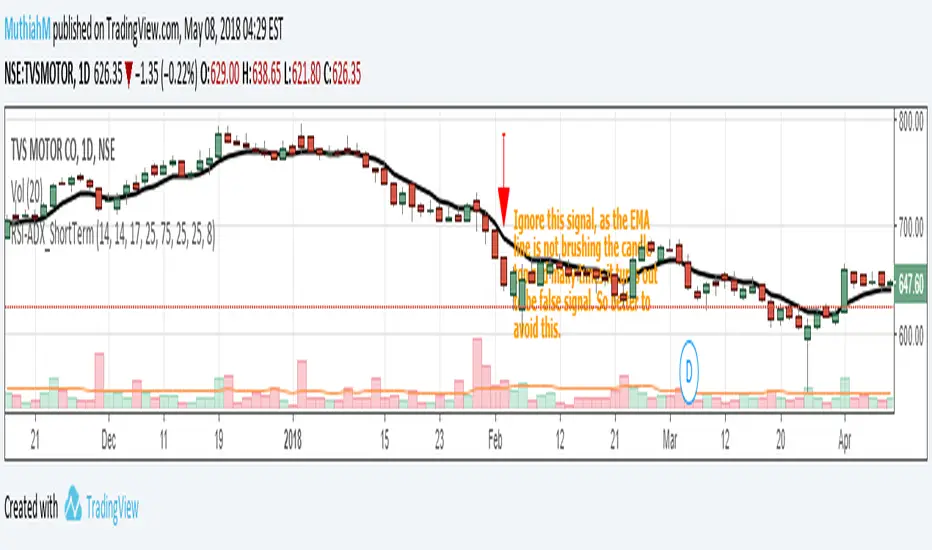
Setup for Short Term Investment using RSI&ADX. High success rateThis is a very simple script which gives reliable signals for buying and selling in short term. I came across this strategy a long time before in some website and coded it here. I had been using this for a long time and made good profits.
Idea is very simple, a buy call is triggered when RSI is greater than 75 and ADX is greater than 25. Sell call is triggered when RSI is lesser than 25 and ADX is again greater than 25. To remove false signals I always use it with EMA(close,8) which is also included as part of the code.
The ideal chart resolution is 1 day, below this the indicator is not reliable. Haven't tested this indicator for anything other than daily chart.
Refer the snapshots for more details.For any queries, please comment or PM me.