FVG Snper PRO🎯 FVG Sniper — Fair Value Gap Signal Engine
FVG Sniper is a professional imbalance-based entry tool built around the Nasdaq futures (NQ/MNQ) — but the signal logic is general enough to apply to many liquid instruments (indices, FX, crypto, metals).
It automatically detects Fair Value Gaps (FVGs), tracks their lifecycle, and fires rule-based long/short signals only when price shows decisive intent away from those imbalances.
🔍 What FVG Sniper Does
Detects FVGs automatically (no pivots)
Uses a strict 3-candle pattern to locate bullish and bearish imbalances directly from price action.
Tracks each FVG over time
For every FVG, FVG Sniper tracks:
When it was created
Whether it has ever been tapped
Whether it has been tapped since the last trade
Whether it has been invalidated (“inversion close”)
Session-gated execution
FVGs can be formed and tapped any time.
Only bars inside a defined signal session (e.g. 09:30–12:00 New York time) are allowed to trigger entries.
FVGs are only eligible if they were created on the same trading day as the signal and after a specific time cutoff (e.g. 08:30 ET).
Tap-aware, breakout-based entries
The indicator looks for:
An FVG that has been tapped at least once since the last signal (if tap is required).
A decisive breakout of the previous bar’s high or low coming off that FVG.
Multi-strategy overlay (for advanced use)
On top of the core engine, FVG Sniper offers several optional “Sniper profiles” (strategies) tuned around:
Session timing (e.g. morning / midday windows)
Volatility regimes
Lane cleanliness / opposite-side structure behavior
Range context (distance from session extremes)
You can toggle these profiles on/off to restrict signals to specific conditions — but the exact internal filters and thresholds are not disclosed.
If at least one profile is enabled, a signal prints when any enabled profile likes the setup.
If no profiles are enabled, FVG Sniper shows the raw base FVG breakout signals from the core engine.
🧠 How to Use It
Primary use case: intraday futures (NQ/MNQ) on 1M timeframe.
FVG Sniper works best as:
A signal engine feeding your execution plans, or
A confirmation layer on top of your own context (HTF bias, news, higher-timeframe levels, etc.).
🎨 Visuals & Controls
Bullish and bearish FVG zones are drawn directly on the chart.
Optional mid-lines through each FVG.
Automatic delete or “fade” behavior when FVGs are invalidated.
Clear long/short markers at the signal bar.
Optional debug label to inspect which FVG produced the signal and key reference times.
⚠️ Disclaimer
This script is for educational and research purposes only and is not financial advice.
Past performance does not guarantee future results. Always validate any signal logic in a simulator and adapt it to your own risk management, instrument, and timeframe.
Ict

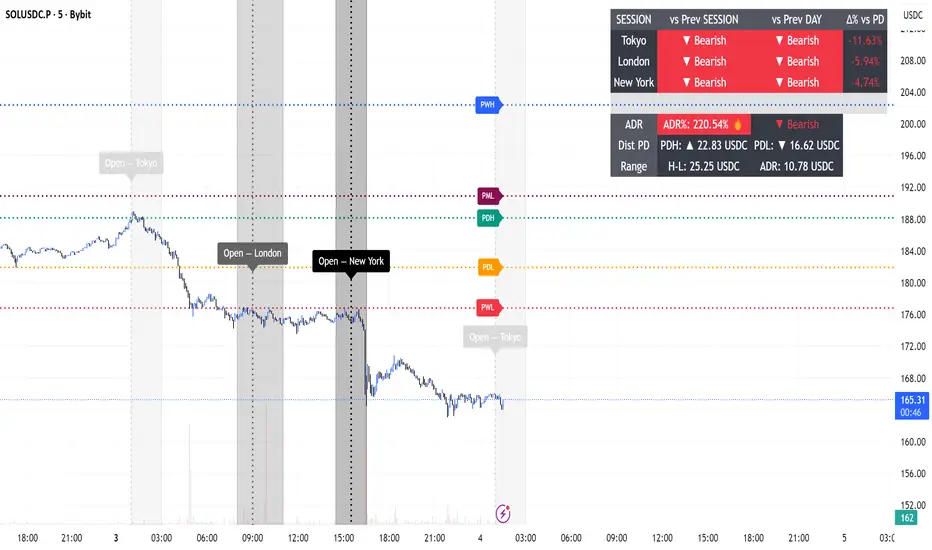
ADR Daily Range + Volatility + KZs — SMC/ICT (@PueblaATH)ADR Daily Range + Volatility + KZs — SMC/ICT (@PueblaATH) is a complete intraday context and volatility HUD that plots market opens, killzones, previous period highs/lows, and a dynamic ADR/volatility dashboard. It is built to give SMC/ICT traders an at-a-glance view of when and where price is moving: sessions, overlaps, ranges, and distance to key levels, all on a single clean overlay.
What the Indicator Does
Market Opens (Tokyo, London, New York)
Professional-grade session open lines with:
Individually configurable open times per session and timezone.
Infinite vertical lines or height-limited extensions (custom tick offsets).
Fully styled labels: size, alignment, auto-background, manual background, and vertical offset.
Killzones & Session Overlaps
Precision-timed shaded boxes for:
Tokyo Killzone
London Killzone
New York Killzone
London–New York Overlap
Previous Period Levels (PDH/PWH/PMH & PDL/PWL/PML)
Robust daily/weekly/monthly high/low engine:
Accurate Previous Day / Week / Month Highs & Lows (Europe/Madrid reference).
Line length modes: infinite, N bars, or end-of-day projection.
Per-level colors + labeled markers placed to the right of price with custom horizontal/vertical spacing.
Timeframe & Weekend Filters
Keep charts clean by hiding components based on:
Custom timeframe ranges (hide opens or killzones on HTFs).
Weekend filters for opens, killzones, and ADR/table.
Optional override to display the HUD table across all timeframes.
Session Comparison Table (Top-Right HUD)
A compact, institutional-style session dashboard comparing:
Tokyo, London, New York — current open vs previous session and previous day.
Bullish/Bearish state with color-coded logic (+ optional ▲/▼ arrows).
Optional Δ% change column relative to previous day’s open.
ADR / Volatility Panel (24h Rolling Window)
A powerful real-time volatility module providing:
True 24-hour rolling high–low range.
SMA-based ADR calculation with automatic bar-count safety limits.
ADR% expansion metric with two thresholds + blinking color logic for volatility extremes.
Directional bias vs price 24 hours ago (Bullish/Bearish).
Optional metrics: distance to PDH/PDL (in price units) and absolute H–L / ADR values.
How to Use It
Set each session’s open time and killzone window according to your broker or desired timezone alignment.
Enable or disable session opens and killzones to frame the trading windows you prioritize (e.g., LDN Killzone or NY session expansion).
Activate key previous period levels (PDH/PDL, PWH/PWL, PMH/PML) and tune the line-length mode and label spacing to match your workflow.
Use timeframe & weekend filters to keep higher-timeframe charts clean while maintaining precise intraday visibility on lower timeframes.
Monitor the session comparison table to understand directional behavior relative to previous sessions and previous day opens.
Watch the ADR panel to classify the day as compressed, normal, or expanded—and anticipate potential reversion or continuation.
Originality & Credits Disclaimer
This indicator is an original work by @PueblaATH , created specifically for the tool ADR Daily Range + Volatility + KZs — SMC/ICT (@PueblaATH) and distributed under the MPL 2.0 license.
While the concepts implemented—session opens, killzones, ADR, and previous highs/lows—are public and widely known in the trading community, this script introduces a uniquely integrated framework that combines:
Multi-timezone session scheduling with dynamic TF/weekend filtering.
A modular PDH/PWH/PMH + PDL/PWL/PML engine with versatile projection and labeling controls.
A precise 24-hour volatility model tied to an ADR panel with extension thresholds, blinking alerts, and distance-to-PD metrics.
A multi-session comparative table that unifies Tokyo, London, and New York open data in real time.
This work does not reuse or repackage code from other authors. Any future adaptations from public sources will always include full, transparent credit and documentation.

Liquidity Sweeps + Swing High/Low — SMC/ICT (@PueblaATH)Liquidity Sweeps + Swing High/Low — SMC/ICT (@PueblaATH) is a liquidity-driven Smart Money Concepts tool that automatically maps out key swing highs and lows, tracks how they evolve into liquidity pools, and highlights when those levels are swept and either respected or invalidated. This indicator is built to give traders a clean, event-driven view of stop runs and liquidity grabs across any timeframe, from scalping to higher-timeframe context.
What the Indicator Does
Swing Structure & Liquidity Pools
Detects swing highs and lows using a configurable swing length, projects levels forward in time, and builds a liquidity-pool database through pivot arrays used for sweep detection.
Liquidity Sweeps (Stop Runs)
Identifies bearish (upward) and bullish (downward) sweeps through prior liquidity levels using three modes: Any Touch, Wick + Close Back, and Retest Rejection.
Each sweep can generate projective lines, labeled markers, and alerts.
Scope, Rate Limiting & Clean Visuals
Controls minimum spacing between swings and sweeps, limits sweep duplication, auto-revokes invalidated sweeps, and restricts the maximum number of visible events.
Smart offset logic reduces label overlap and keeps charts clean even in dense price action.
Timeframe Filters & Utilities
Allows hiding all drawings between specific timeframes and optionally skipping calculations or clearing internal state when hidden.
Includes debug pivot markers and an optional TF/Bucket badge.
Timeframe Auto-Mode (Original Adaptive Engine)
This indicator features a fully original, seven-bucket Auto-Mode engine that adapts sensitivity to the active timeframe.
Bucket Classification (by seconds)
≤1m, >1m–15m, >15m–30m, >30m–1h, >1h–4h, >4h–1d, >1d.
Bucket-Specific Settings
Each bucket has unique sensitivity sets:
Swing/Sweep lengths
Projection distances
Line style and width
Rate-limiting gaps
Pivot count and bar-lookback windows
Overlap windows
Adaptive Behavior
Lower timeframes gain more reactive behavior, while higher timeframes apply smoother and more selective filters.
Manual Override
Auto-Mode can be disabled to use the Core manual settings for full customization.
How to Use It
Attach the indicator and choose whether to keep Auto-Mode ON or OFF.
Select the sweep mode (e.g., Wick + Close Back for ICT-style liquidity grabs).
Adjust label text, size, color, and offsets to your preference.
Use timeframe filters to show drawings only where you want them.
Enable alerts for bullish sweeps, bearish sweeps, or revocations.
Combine sweep events with your own confluence (sessions, bias, OBs/FVGs, etc.).
Originality & Credits Disclaimer
This script is an original work by @PueblaATH , created specifically for Liquidity Sweeps + Swing High/Low — SMC/ICT (@PueblaATH) under the MPL 2.0 license.
The concepts used (swing highs/lows, liquidity pools, sweeps, SMC/ICT behavior) are public and widely known—they do not belong to any author or protected script.
This indicator does not repackage or cosmetically modify existing code.
Its architecture—including the multi-bucket Auto-Mode engine, pivot/sweep management system, revocation logic, overlap-aware labeling, and TF-based hide/skip/clear controls—is uniquely implemented for this script.
If any future update reuses or adapts code from public sources, full credit will be given in both comments and description, with clear explanation of what was reused and what was originally added or improved.

Sessions High & Low LevelsAutomatically plots high & low levels for multiple sessions. Clear session structure for intraday traders using price action, liquidity concepts, or session-based strategies.
Automatically plots the High & Low, for sessions such as London, New York, and Asia, with full customization for any custom session or timezone. These levels extend forward and adapt in real time, giving you a clear view of session-based structure and liquidity behavior.
Perfect for traders using ICT concepts, session narratives, or intraday market structure. Session ranges often act as key liquidity pools, breakout zones, and directional guides, this tool makes them easy to see at a glance.
Features:
Auto-plots High & Low for NY, London, and Asia sessions (customizable)
Fully customizable session times, colors, labels, and visibility options
Works across any assets

Gold 1&5 Min Trading Strategy [TradingFinder] XAU Scalper Signal🔵 Introduction
Scalping in financial markets is based on immediate price reactions and precise analysis of price action behavior. In this trading approach, the trader must identify signals that originate directly from market structure, momentum shifts, candlestick formations, and the position of price relative to key zones.
Supply and demand areas serve as the primary regions of order concentration and form the foundation of scalping analysis, since they provide the most accurate representation of balance or imbalance between buyers and sellers as well as the active flow of liquidity in the market.
In demand zones, price reactions usually begin with the formation of reversal or continuation candlestick patterns. These patterns include structures such as Pin Bar, Engulfing, Doji, Failure, Rejection, and other forms of false breakout behavior, each of which can indicate a potential short term change in direction.
Liquidity plays a central role in these reactions, because price entering a demand zone typically coincides with the absorption of sell side liquidity and the restoration of order flow. This process often leads to rapid movements that are suitable for scalping. Therefore, combining candlestick confirmation with the location of price inside a supply or demand zone is one of the most reliable methods of identifying low risk scalping signals.
Demand zones include several structural variations, each representing a different form of liquidity behavior. One of the most well known examples is the order block, which is the final bearish candle before a strong bullish movement and indicates the presence of unfilled buy side interest.
Another important structure is the Fair Value Gap, which appears when a price void forms across three consecutive candles due to a lack of liquidity during the moment of displacement. The market often returns to this area to restore balance. Imbalance structures also represent one sided pressure in order flow where the market reacts later to correct these inefficiencies.
Breaker structure is another key element in demand analysis. A breaker is formed when an order block is violated and price returns to the same level after collecting liquidity, then continues in the opposite direction. This pattern often appears near liquidity based highs or lows and reflects a shift in the strength of market participants.
Together, order blocks, Fair Value Gaps, imbalances, and breakers form the core of demand analysis in price action and are widely used in precise scalping strategies due to their strong connection with liquidity and the high predictability of price reactions within them.
Bullish Setup :
Bearish Setup :
🔵 How to Use
This strategy is built on price action analysis, market reactions inside supply and demand zones, and confirmation through candlestick patterns. The first step is to identify key areas such as order blocks, Fair Value Gaps, imbalances, or breakers.
After these zones are located, price behavior within them is examined using candlestick structure and momentum direction. Entries are taken only when price reaches a validated zone, a clear sign of liquidity absorption or injection appears, and a confirming candlestick forms inside the zone.
This approach allows the trader to capture fast and precise entries during moments when the market is actively reacting to decision points.
🟣 Long Setup
In the buy setup, a valid demand zone must first be identified. This can be a bullish order block, an unfilled bullish Fair Value Gap, an imbalance at the lower part of structure, or a bullish breaker. When price enters this zone and shows signs of absorbing sell side liquidity, candlestick behavior must be examined.
Formation of reversal signals such as a Pin Bar with a long lower wick, bullish Engulfing, Rejection Candle, or a false breakout of the low, indicates a favorable shift in order flow. After receiving candlestick confirmation, a buy entry is taken within the same zone and the stop level is placed below the liquidity boundary. Targets are typically based on filling gaps, reaching supply zones, or returning to structural means.
🟣 Short Setup
In the sell setup, a valid supply zone must be recognized. This may include a bearish order block, a bearish Fair Value Gap, an imbalance at the upper part of structure, or a bearish breaker. When price enters this zone and liquidity accumulates above nearby highs, the probability of a fast momentum shift increases.
Confirmation occurs when a bearish reversal pattern forms such as Engulfing, Pin Bar with a long upper wick, indecisive Doji followed by rejection, or a false breakout of the high. After confirmation, the sell entry is placed and the stop level is set above the liquidity zone. Targets are selected based on filling lower Fair Value Gaps, reaching demand zones, or returning to structural midpoints.
🔵 Settings
Last Candle in Signal Direction : When On, a signal is issued only if the last candle moves in the direction required by the signal.
Signal in Nearly Zone : When enabled, the signal becomes valid even if the candle is near the zone rather than strictly inside it. When disabled, only signals formed inside the zone are allowed.
Allow Both Side Signals : When On, signals from both sides of the structure can be issued even if a limiting level exists. When disabled, only signals that do not violate the limiting level are allowed.
🔵 Conclusion
Using price action, supply and demand zones, and candlestick confirmation alongside liquidity analysis creates an effective framework for identifying fast market reactions in scalping conditions. Focusing on structures such as order blocks, Fair Value Gaps, imbalances, and breakers allows the trader to recognize shifts in momentum and changes in order flow with greater precision.
In this approach, entries are taken only when price reaches a validated zone, liquidity behavior is observable, and the confirming candle forms at the correct location. This leads to organized, low risk scalping signals that are aligned with the real time behavior of the market.


MCM By Inner Racers# MCM By Inner Racers - Multi-Timeframe Key Levels & Session Indicator
## 📊 Overview
**MCM (Multi-Timeframe Chart Mapping)** is a comprehensive trading indicator designed for professional traders who need clear visual representation of critical price levels, session ranges, and time-based market structure. This all-in-one tool eliminates chart clutter while providing essential information for ICT, SMC, and institutional trading methodologies.
---
## ✨ Key Features
### 📅 **Previous Daily Levels**
- **Previous Day High (PDH)** - Acts as key resistance/liquidity zone
- **Previous Day Low (PDL)** - Acts as key support/liquidity zone
- **Previous Day Mid (PDM)** - 50% equilibrium level for mean reversion trades
- **Daily Separators** - Vertical lines marking new trading days
### 📆 **Previous Weekly Levels**
- **Previous Week High (PWH)** - Major weekly resistance for swing trading
- **Previous Week Low (PWL)** - Major weekly support for swing trading
- **Previous Week Mid (PWM)** - Weekly equilibrium for higher timeframe bias
- **Weekly Separators** - Vertical lines marking new trading weeks
### 🌅 **True Day Opens (TDO)**
- Displays opening prices at **midnight NY time** for the past 1-10 days
- Each level labeled as "TDO D-0", "TDO D-1", "TDO D-2", etc.
- Critical for tracking institutional reference points and gap trading
- Respects true midnight opens (not session opens)
### 📍 **Weekly Opens**
- **Monday 00:00 Open** - True weekly open at Monday midnight NY time
- **Sunday 17:00 Open** - Forex market open (Sunday 5 PM NY time)
- Essential for understanding weekly bias and manipulation zones
### 🌏 **Trading Session Ranges**
Dynamic session boxes that track real-time high/low ranges:
- **Asian Session** (Default: 20:00-00:00 NY) -
- **London Session** (Default: 02:00-05:00 NY) -
- **New York Session** (Default: 07:00-16:00 NY) -
All session times are **fully customizable** in 15-minute increments.
---
## 🎯 Who Is This For?
✅ **ICT/SMC Traders** - Key levels for market structure, liquidity, and order flow
✅ **Session Traders** - Identifying killzones and optimal entry zones
✅ **Swing Traders** - Previous day/week levels as support/resistance
✅ **Multi-Timeframe Analysts** - Understanding price relationships across timeframes
✅ **Forex & Indices Traders** - NY time-based analysis for institutional moves
---
## 🎨 Full Customization
Every element is fully customizable:
- ✏️ **Colors** - Match your chart theme perfectly
- 📏 **Line Widths** - 1-5 pixels for visibility
- 🎭 **Line Styles** - Solid, Dashed, or Dotted
- 🏷️ **Labels** - Custom text and 5 size options (Tiny to Huge)
- ⏱️ **Session Times** - Adjust to your timezone or broker
- 📐 **Line Extension** - 20-500 bars forward projection
- 👁️ **Toggle Visibility** - Show/hide any feature independently
---
## 🔧 Technical Highlights
- Uses **request.security()** for accurate higher timeframe data
- Implements **lookahead=barmerge.lookahead_on** for non-repainting levels
- All times calculated in **America/New_York timezone** for consistency
- Efficient line management with proper deletion/recreation
- Maximum 500 lines supported for clean chart performance
- Session detection respects broker time differences
---
## 📖 How To Use
### **For Day Traders:**
1. Enable Daily Levels + True Day Opens for intraday structure
2. Use Session Ranges to identify high-probability trading windows
3. Watch for price reactions at PDH/PDL and TDO levels
### **For Swing Traders:**
1. Enable Weekly Levels for higher timeframe bias
2. Use PWH/PWL as major support/resistance zones
3. Monitor Weekly Opens for institutional reference points
### **For Multi-Timeframe Analysis:**
1. Combine Daily + Weekly levels for confluence zones
2. Use Mid levels (50%) for mean reversion opportunities
3. Align session ranges with higher timeframe structure
---
## ⚙️ Setup Tips
- **Timeframe:** Works on all timeframes (recommended: 1m to 1H for intraday)
- **Chart Type:** Overlay indicator - displays directly on price chart
- **Clean Charts:** Toggle off features you don't need for specific strategies
- **Labels:** Turn off labels for cleaner charts, turn on for reference
- **Line Extension:** Adjust based on your screen size and bar count
---
## 🚀 What Makes This Different?
Unlike basic support/resistance indicators, MCM provides:
- ✅ **True NY midnight opens** (not session opens)
- ✅ **Multiple day opens** tracking (not just previous day)
- ✅ **Dynamic session ranges** (not static boxes)
- ✅ **Both true weekly opens** (Monday 00:00 AND Sunday 17:00)
- ✅ **Fully customizable everything** (colors, styles, labels, times)
- ✅ **Non-repainting levels** using proper lookahead settings
- ✅ **All-in-one solution** (no need for multiple indicators)
---
## 📝 Notes
- All times are in **America/New_York timezone** for consistency with institutional trading
- Previous levels update at the start of each new day/week
- Session ranges are calculated dynamically during active sessions
- Lines extend forward for clear visual reference
- Works with any symbol: Forex, Indices, Crypto, Stocks
---
## 🏷️ Tags
`Multi-Timeframe` `Key Levels` `ICT` `Smart Money Concepts` `Sessions` `Previous Day High/Low` `Previous Week High/Low` `Support Resistance` `Institutional Trading` `Order Flow` `Liquidity` `Market Structure`
---
© Inner_Racers
For questions, suggestions, or feedback, please leave a comment below!
**⭐ If you find this indicator helpful, please give it a boost and share with fellow traders!**

ICT Sessions Ranges [SwissAlgo]ICT Session Ranges - ICT Liquidity Zones & Market Structure
OVERVIEW
This indicator identifies and visualizes key intraday trading sessions and liquidity zones based on Inner Circle Trader (ICT) methodology (AM, NY Lunch Raid, PM Session, London Raid). It tracks 'higher high' and 'lower low' price levels during specific time periods that may represent areas where market participants have placed orders (liquidity).
PURPOSE
The indicator helps traders observe:
Session-based price ranges during different market hours
Opening range gaps between market close and next day's open
Potential areas where liquidity may be concentrated and trigger price action
SESSIONS TRACKED
1. London Session (02:00-05:00 ET): Tracks price range during early London trading hours
2. AM Session (09:30-12:00 ET): Tracks price range during the morning New York session
3. NY Lunch Session (12:00-13:30 ET): Tracks price range during typical low-volume lunch period
4. PM Session (13:30-16:00 ET): Tracks price range during the afternoon New York session
CALCULATIONS
Session High/Low: The highest high and lowest low recorded during each active session period
Opening Range Gap: Calculated as the difference between the previous day's 16:00 close and the current day's 09:30 open
Gap Mitigation: A gap is considered mitigated when the price reaches 50% of the gap range
All times are based on America/New_York timezone (ET)
BACKGROUND INDICATORS
NY Trading Hours (09:30-16:00 ET): Optional gray background overlay
Asian Session (20:00-23:59 ET): Optional purple background overlay
VISUAL ELEMENTS
Horizontal lines mark session highs and lows
Subtle background boxes highlight each session range
Labels identify each session type
Orange shaded boxes indicate unmitigated opening range gaps
Dotted line at 50% gap level shows mitigation threshold
FEATURES
Toggle visibility for each session independently
Customizable colors for each session type
Automatic removal of mitigated gaps
All drawing objects use transparent backgrounds for chart clarity
ICT CONCEPTS
This tool relates to concepts discussed by Inner Circle Trader regarding liquidity pools, session-based analysis, and gap theory. The indicator assumes that session highs and lows may represent areas where liquidity is concentrated, and that opening range gaps may attract price until mitigated.
USAGE NOTES
Best used on intraday timeframes (1-15 minute charts)
All sessions are calculated based on actual price movement during specified time periods
Historical session data is preserved as new sessions develop
Gap detection only triggers at 09:30 ET market open
DISCLAIMER
This indicator is for educational and informational purposes only. It displays historical price levels and time-based calculations. Past performance of price levels is not indicative of future results. The identification of "liquidity zones" is a theoretical concept and does not guarantee that orders exist at these levels or that prices will react to them. Trading involves substantial risk of loss. Users should conduct their own analysis and risk assessment before making any trading decisions.
TIME ZONE
Set your timezone to: America/New_York (UTC-5)

Fair Value Gap Pro by Bifrost InstituteFair Value Gap Pro brings institutional-style FVGs to TradingView with the precision and controls traders actually need. It detects clean 3-candle gaps on any higher timeframe, projects them onto your active chart, and overlays precise buy/sell volume ratios so you can judge the quality of a gap at a glance. Everything is customizable—from colors and line styles to tag markers, and volume display—so the tool adapts to your workflow instead of the other way around.
🔭 Multi-Timeframe Engine
Higher Timeframe Detection: Choose any HTF (M5, H1, H4, D1, etc.) and view those gaps on any lower-TF chart
Smart Gap Detection: Strict 3-candle mode ensures only successive bars form gaps—automatically rejects weekend gaps and market closures
Configurable History: Scan back 1-500+ bars with intelligent processing
Extend Until Filled: Gaps dynamically extend forward until price fills them, or use fixed-width mode
Advanced Fill Logic: Fill Rules - Close only, wick only, or close/wick; Fill Depth: TouchAny (immediate edge touch) or TouchMid (requires 50% penetration)
TouchMid Margin: Fine-tune difficulty with -50% to +50% adjustment (e.g., -10% = easier fill at 40% depth)
Weekend Gap Protection: Prevents false fills from market gaps—only real price action counts
📊 HTF-Accurate Volumetrics
True HTF Volume: Uses higher timeframe bar data for accurate volume matching across all chart timeframes
Buy vs Sell Delta: Integrated volume analysis for every FVG shows institutional pressure
Display Formats: Decimal ratios, percentages, or raw values (with K/M/B suffixes)
Volume Modes: Bar Delta (fast & reliable, recommended), Tick Delta (optional, feed-dependent)
Clear "+" (buy) and "–" (sell) prefixes for instant reading
🎨 Fully Customizable Appearance
Color Control: Color pickers for Bullish/Bearish FVG fills & Filled state colors (different from active), Band lines, midlines, and text labels.
Formation and fill tag markers
Line Styling: Color & Width
🔔 Alerts
Toggle formation/fill alerts independently
🏷 Tags
Visual Tags: Show markers - Text / Icon per event type
Icon choices: Circle, Square, Diamond, Star, Up/Down Arrow
Independent colors for formation vs fill tags
Auto-remove "formed" tag when "filled" tag appears
Configurable size and positioning
🧩 Rendering & Fill Display
Triple-Band Display: Upper, mid, and lower boundary lines with configurable styles
Filled Rectangle: Semi-transparent fill between boundaries for clear visualization
Fill State Management: Hide filled gaps completely, or keep them visible with distinct "filled" colors.
"Use Filled Colours" option for easy state identification
Quality Filters: Minimum body size filter (in chart points) to exclude noise from low-volatility periods
⚙️ Quality-of-Life Features
Performance Optimized: Efficient HTF/LTF time mapping with binary search algorithms
Cross-Symbol Compatible: Robust handling across all symbols and data feeds
Sensible Defaults: Works beautifully out of the box—tweak only what you need
Minimal Chart Clutter: Designed to keep critical information visible without overwhelming your workspace
💡 Perfect For
Institutional gap traders who need precision and control
Multi-timeframe analysts requiring HTF context on LTF charts
Volume profile traders seeking buy/sell pressure confirmation
Traders who value clean, professional chart aesthetics
Anyone tired of indicators that force rigid workflows
Fair Value Gap Pro doesn't just show you gaps—it gives you the complete institutional picture with the flexibility to trade your way.

SSMT + HSSMT Detector- Q to Q Analysis- (by FINOR V10.1)📘 Description
This indicator detects Same-Side Market Trend (SSMT) and Hidden Same-Side Market Trend (HSSMT) divergences between three correlated symbols, providing multi-timeframe intermarket structure analysis.
It works entirely in a Q-based framework, allowing precise identification of structural inefficiencies between related markets.
🕒 Session Structure and Logic
The script divides price data into four time scopes:
1️⃣ Daily Session
2️⃣ 6-hour Session
3️⃣ 90-minute Session
4️⃣ 22.5-minute Session
Each of these sessions is split into consecutive Q intervals (quarters).
Within each Q, the algorithm detects local highs and lows for each of the three selected symbols.
⚙️ How It Works
Q Analysis:
For each session type, the algorithm evaluates the price structure of each symbol inside every Q.
It identifies swing highs and lows to map short-term market structure boundaries.
Inter-Q Comparison:
The script compares consecutive Q periods to locate structural asymmetries — situations where correlated symbols fail to move in sync.
These asymmetries often reveal intermarket inefficiencies and potential reversals or continuations.
SSMT Detection:
The SSMT logic checks for divergence in highs and lows between the selected symbols.
For example, if Symbol A makes a higher high but Symbol B does not, an SSMT signal is generated.
HSSMT Detection:
The HSSMT logic performs a similar analysis but based solely on closing prices, detecting hidden divergences that may appear within continuation phases rather than reversals.
🧭 Visualization and Alerts
Each detected event is labeled directly on the chart with visual tags showing whether it is an SSMT or HSSMT event.
Color-coded markers distinguish between highs, lows, and closes depending on the detected structure.
Optional smart alerts instantly notify the trader when a new SSMT or HSSMT signal is found.
💡 Use Cases
Confirm institutional SMT setups across correlated indices or assets.
Detect non-synchronous behavior between correlated pairs for early reversal confirmation.
Identify continuation or exhaustion points in multi-symbol price action.
🧠 Summary
This tool provides an advanced, multi-timeframe method to visualize and quantify intermarket divergences using a Q-segmented framework.
It allows traders to observe both explicit (SSMT) and hidden (HSSMT) inefficiencies between correlated symbols in real time — a capability not available in standard open-source SMT detectors.

Watermark[Font] This watermark is designed for recording your chart.
It automatically converts to a cursive (italic) style and appears on the chart,
adding a more aesthetic touch to your visuals.
Enjoy your time!
You can freely turn the brand label on or off from the settings.
1.script
2.italic

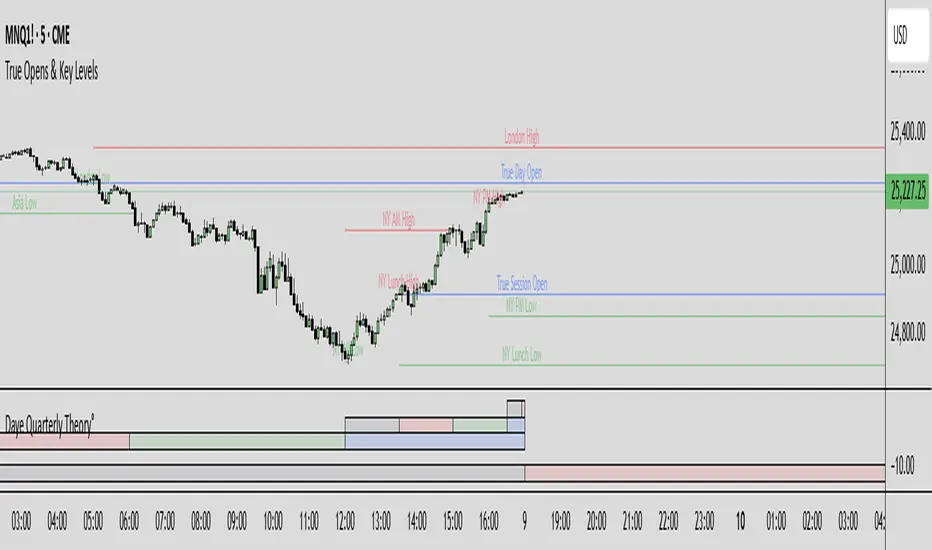
True Opens & Key Levels# True Opens & Key Levels - Standalone Indicator Guide
## Overview
This is a clean, focused indicator that displays only key level rays and true open levels. All impulsive series detection, FVG detection, and Fibonacci projections have been removed for a minimal, uncluttered chart experience.
---
## Features Included
### 📊 Previous Period Levels
- **Previous Day High/Low** - Daily reference points
- **Previous Week High/Low** - Weekly reference points
- **Previous Month High/Low** - Monthly reference points
### 🕐 Session High/Low Levels
- **NY AM Session** (9:30-12:00 ET) - Morning session range
- **NY Lunch Session** (12:00-13:30 ET) - Lunch hour range
- **NY PM Session** (13:30-16:00 ET) - Afternoon session range
- **London Session** (2:00-5:00 ET) - London trading hours
- **Asia Session** (20:00-00:00 ET) - Asian market hours
### 🎯 True Open Levels (NEW)
- **True Day Open** - Updates daily at 00:00 ET
- **True Session Open** - Updates every 6 hours (1:30, 7:30, 13:30, 19:30 ET)
- **True Week Open** - Updates every Monday at 18:00 ET
---
## Settings
### Key Level Rays Group
**Master Toggle:**
- Enable Key Level Rays (master on/off switch)
**Previous Period Levels:**
- Show Previous Day H/L
- Show Previous Week H/L
- Show Previous Month H/L
**Session Levels:**
- Show NY AM H/L (9:30-12:00 ET)
- Show NY Lunch H/L (12:00-13:30 ET)
- Show NY PM H/L (13:30-16:00 ET)
- Show London H/L (2:00-5:00 ET)
- Show Asia H/L (20:00-00:00 ET)
**True Open Levels:**
- Show True Day Open (00:00)
- Show True Session Open (6h intervals)
- Show True Week Open (Mon 18:00)
**Visual Settings:**
- High Level Color (default: red with 50% transparency)
- Low Level Color (default: green with 50% transparency)
- Open Level Color (default: blue with 50% transparency)
- Ray Line Width (1-5 pixels)
- Ray Label Size (tiny/small/normal/large)
---
## How It Works
### Level Behavior
**Session High/Low Levels:**
1. During session: Tracks the highest high and lowest low
2. After session ends: Draws horizontal rays extending right
3. When price hits level: Ray stops extending (hit marker)
4. Label updates position to stay at chart's right edge
**Previous Period Levels:**
1. At period change: Draws rays from previous period's H/L
2. Extends right until price hits the level
3. When hit: Ray stops extending
4. Label positions at midpoint of ray
**True Open Levels:**
1. At trigger time: Draws ray from opening price
2. Extends right until next trigger
3. Previous level is deleted when new one appears
4. Label stays at right edge of chart
---
## Color Scheme
### Three Color Categories:
1. **Red** - All HIGH levels (session highs, previous highs)
2. **Green** - All LOW levels (session lows, previous lows)
3. **Blue** - All OPEN levels (True Day/Session/Week Opens)
This makes it instantly clear what type of level you're looking at.
---
## Best Practices
### For Intraday Trading (1m-1H):
```
Enable:
✓ True Day Open
✓ True Session Open
✓ NY AM/PM H/L
✓ Previous Day H/L
Disable:
✗ Previous Week/Month H/L
✗ London/Asia sessions (unless trading them)
✗ True Week Open
```
### For Swing Trading (1H-4H):
```
Enable:
✓ True Week Open
✓ True Day Open
✓ Previous Week H/L
✓ Previous Day H/L
Disable:
✗ All session H/L
✗ True Session Open
✗ Previous Month H/L
```
### For Clean Charts:
```
Enable:
✓ True Day Open
✓ True Week Open
✓ Previous Day H/L only
Disable:
✗ Everything else
Result: Just 4 levels on chart - super clean!
```
---
## Level Update Schedule
| Level | Update Frequency | Time(s) |
|---------------------|------------------|-----------------------------|
| True Day Open | Daily | 00:00 ET |
| True Session Open | Every 6 hours | 1:30, 7:30, 13:30, 19:30 ET |
| True Week Open | Weekly | Monday 18:00 ET |
| Previous Day H/L | Daily | At day change |
| Previous Week H/L | Weekly | At week change |
| Previous Month H/L | Monthly | At month change |
| NY AM H/L | Daily | After 12:00 ET |
| NY Lunch H/L | Daily | After 13:30 ET |
| NY PM H/L | Daily | After 16:00 ET |
| London H/L | Daily | After 5:00 ET |
| Asia H/L | Daily | After 00:00 ET |
---
## File Size & Performance
- **File Size:** ~22 KB (less than half the size of full indicator)
- **Total Lines:** ~700 lines
- **Max Lines/Labels:** 500 (configurable in declaration)
- **Performance:** Lightweight, minimal CPU usage
- **Memory:** Efficient variable management
---
## Installation
1. Open TradingView
2. Open Pine Editor (Alt+E or bottom toolbar)
3. Click "Create new indicator"
4. Delete default code
5. Copy and paste contents of `TRUE_OPENS_KEY_LEVELS.pine`
6. Click "Save" and name it "True Opens & Key Levels"
7. Click "Add to Chart"
---
## Usage Tips
### 1. Start Minimal
Begin with just 2-3 levels enabled:
- True Day Open
- Previous Day High
- Previous Day Low
Add more as needed.
### 2. Color Customization
Adjust transparency for cleaner look:
- High Level: Red 60-70% transparency
- Low Level: Green 60-70% transparency
- Open Level: Blue 60-70% transparency
### 3. Multi-Timeframe Approach
Lower timeframes (1m-15m): Use True Session Open + NY session H/L
Mid timeframes (15m-1H): Use True Day Open + Previous Day H/L
Higher timeframes (1H-4H): Use True Week Open + Previous Week H/L
### 4. Line Width
For cleaner charts, use Line Width = 1
For emphasis, use Line Width = 2-3
### 5. Label Size
Smaller screens: Use "small" or "tiny"
Larger screens: Use "normal"
Presentations: Use "large"
---
## Advantages of Standalone Version
✅ **Cleaner Charts** - No detection lines or arrows
✅ **Faster Loading** - Less code to process
✅ **Easier Setup** - Fewer settings to configure
✅ **Pure Levels** - Focus only on key price levels
✅ **Less Distraction** - No moving parts during trading
✅ **Perfect for Combining** - Use with other indicators without clutter
---
## Combining with Other Indicators
This lightweight indicator works great alongside:
- RSI / Stochastic (oscillators)
- Moving Averages (trend)
- Volume Profile (structure)
- VWAP (intraday reference)
- Your own custom indicators
The minimal chart footprint leaves room for additional tools.
---
## Time Zones
All times are in **Eastern Time (ET)**. TradingView automatically converts to your local timezone, so you don't need to manually adjust anything.
**Example Conversions:**
- 00:00 ET = 05:00 UTC
- 18:00 ET = 23:00 UTC
- 13:30 ET = 18:30 UTC
---
## Support & Updates
This is a standalone version of the True Opens & Key Levels from the full GOTE Indicator. It contains only the level detection code with all series detection removed.
**Version:** 1.0
**Pine Script Version:** 6
**Last Updated:** November 8, 2025
---
## Quick Reference Card
```
╔══════════════════════════════════════════════════════════╗
║ TRUE OPENS & KEY LEVELS - QUICK REFERENCE ║
╠══════════════════════════════════════════════════════════╣
║ ║
║ 📊 PREVIOUS PERIODS ║
║ • Previous Day/Week/Month High/Low ║
║ • Updates at period change ║
║ ║
║ 🕐 SESSION LEVELS ║
║ • NY AM/Lunch/PM, London, Asia H/L ║
║ • Updates after each session ║
║ ║
║ 🎯 TRUE OPENS ║
║ • True Day: Daily 00:00 ET ║
║ • True Session: 1:30/7:30/13:30/19:30 ET ║
║ • True Week: Monday 18:00 ET ║
║ ║
║ 🎨 COLORS ║
║ • Red = Highs • Green = Lows • Blue = Opens ║
║ ║
╚══════════════════════════════════════════════════════════╝
```
---
**Ready to trade with clean, focused key levels!** 🎯
Realtime Squeeze Box [CHE] Realtime Squeeze Box — Detects lowvolatility consolidation periods and draws trimmed price range boxes in realtime to highlight potential breakout setups without clutter from outliers.
Summary
This indicator identifies "squeeze" phases where recent price volatility falls below a dynamic baseline threshold, signaling potential energy buildup for directional moves. By requiring a minimum number of consecutive bars in squeeze, it reduces noise from fleeting dips, making signals more reliable than simple threshold crosses. The core innovation is realtime box visualization: during active squeezes, it builds and updates a box capturing the price range while ignoring extreme values via quantile trimming, providing a cleaner view of consolidation bounds. This differs from static volatility bands by focusing on trimmed ranges and suppressing overlapping boxes, which helps traders spot genuine setups amid choppy markets. Overall, it aids in anticipating breakouts by combining volatility filtering with visual containment of price action.
Motivation: Why this design?
Traders often face whipsaws during brief volatility lulls that mimic true consolidations, leading to premature entries, or miss setups because standard volatility measures lag in adapting to changing market regimes. This design addresses that by using a hold requirement on consecutive lowvolatility bars to denoise signals, ensuring only sustained squeezes trigger visuals. The core idea—comparing rolling standard deviation to a smoothed baseline—creates a responsive yet stable filter for lowenergy periods, while the trimmed box approach isolates the core price cluster, making it easier to gauge breakout potential without distortion from spikes.
What’s different vs. standard approaches?
Reference baseline: Traditional squeeze indicators like the Bollinger Band Squeeze or TTM Squeeze rely on fixed multiples of bands or momentum oscillators crossing zero, which can fire on isolated bars or ignore range compression nuances.
Architecture differences:
Realtime box construction that updates barbybar during squeezes, using arrays to track and trim price values.
Quantilebased outlier rejection to define box bounds, focusing on the bulk of prices rather than full range.
Overlap suppression logic that skips redundant boxes if the new range intersects heavily with the prior one.
Hold counter for consecutive bar validation, adding persistence before signaling.
Practical effect: Charts show fewer, more defined orange boxes encapsulating tight price action, with a horizontal line extension marking the midpoint postsqueeze—visibly reducing clutter in sideways markets and highlighting "coiled" ranges that standard plots might blur with full highs/lows. This matters for quicker visual scanning of multitimeframe setups, as boxes selflimit to recent history and avoid piling up.
How it works (technical)
The indicator starts by computing a rolling average and standard deviation over a userdefined length on the chosen source price series. This deviation measure is then smoothed into a baseline using either a simple or exponential average over a longer window, serving as a reference for normal volatility. A squeeze triggers when the current deviation dips below this baseline scaled by a multiplier less than one, but only after a minimum number of consecutive bars confirm it, which resets the counter on breaks.
Upon squeeze start, it clears a buffer and begins collecting source prices barbybar, limited to the first few bars to keep computation light. For visualization, if enabled, it sorts the buffer and finds a quantile threshold, then identifies the minimum value at or below that threshold to set upper and lower box bounds—effectively clamping the range to exclude tails above the quantile. The box draws from the start bar to the current one, updating its right edge and levels dynamically; if the new bounds overlap significantly with the last completed box, it suppresses drawing to avoid redundancy.
Once the hold limit or squeeze ends, the box freezes: its final bounds become the last reference, a midpoint line extends rightward from the end, and a tiny circle label marks the point. Buffers and states reset on new squeezes, with historical boxes and lines capped to prevent overload. All logic runs on every bar but uses confirmed historical data for calculations, with realtime updates only affecting the active box's position—no future peeking occurs. Initialization seeds with null values, building states progressively from the first bars.
Parameter Guide
Source: Selects the price series (e.g., close, hl2) for deviation and box building; influences sensitivity to wicks or bodies. Default: close. Tradeoffs/Tips: Use hl2 for balanced range view in volatile assets; stick to close for pure directional focus—test on your timeframe to avoid oversmoothing trends.
Length (Mean/SD): Sets window for average and deviation calculation; shorter values make detection quicker but noisier. Default: 20. Tradeoffs/Tips: Increase to 30+ for stability in higher timeframes, reducing false starts; below 10 risks overreacting to singlebar noise.
Baseline Length: Defines smoothing window for the deviation baseline; longer periods create a steadier reference, filtering regime shifts. Default: 50. Tradeoffs/Tips: Pair with Length at 1:2 ratio for calm markets; shorten to 30 if baselines lag during fast volatility drops, but watch for added whips.
Squeeze Multiplier (<1.0): Scales the baseline downward to set the squeeze threshold; lower values tighten criteria for rarer, stronger signals. Default: 0.8. Tradeoffs/Tips: Tighten to 0.6 for highvol assets like crypto to cut noise; loosen to 0.9 in forex for more frequent but shallower setups—balances hit rate vs. depth.
Baseline via EMA (instead of SMA): Switches baseline smoothing to exponential for faster adaptation to recent changes vs. equalweighted simple average. Default: false. Tradeoffs/Tips: Enable in trending markets for quicker baseline drops; disable for uniform history weighting in rangebound conditions to avoid overreacting.
SD: Sample (len1) instead of Population (len): Adjusts deviation formula to divide by length minus one for smallsample bias correction, slightly inflating values. Default: false. Tradeoffs/Tips: Use sample in short windows (<20) for more conservative thresholds; population suits long looks where bias is negligible, keeping signals tighter.
Min. Hold Bars in Squeeze: Requires this many consecutive squeeze bars before confirming; higher denoise but may clip early setups. Default: 1. Tradeoffs/Tips: Bump to 35 for intraday to filter ticks; keep at 1 for swings where quick consolidations matter—trades off timeliness for reliability.
Debug: Plot SD & Threshold: Toggles lines showing raw deviation and threshold for visual backtesting of squeeze logic. Default: false. Tradeoffs/Tips: Enable during tuning to eyeball crossovers; disable live to declutter—great for verifying multiplier impact without alerts.
Tint Bars when Squeeze Active: Overlays semitransparent color on bars during open box phases for quick squeeze spotting. Default: false. Tradeoffs/Tips: Pair with low opacity for subtlety; turn off if using boxes alone, as tint can obscure candlesticks in dense charts.
Tint Opacity (0..100): Controls background tint strength during active squeezes; higher values darken for emphasis. Default: 85. Tradeoffs/Tips: Dial to 60 for light touch; max at 100 risks hiding price action—adjust per chart theme for visibility.
Stored Price (during Squeeze): Price series captured in the buffer for box bounds; defaults to source but allows customization. Default: close. Tradeoffs/Tips: Switch to high/low for wider boxes in gappy markets; keep close for midline focus—impacts trim effectiveness on outliers.
Quantile q (0..1): Fraction of sorted prices below which tails are cut; higher q keeps more data but risks including spikes. Default: 0.718. Tradeoffs/Tips: Lower to 0.5 for aggressive trim in noisy assets; raise to 0.8 for fuller ranges—tune via debug to match your consolidation depth.
Box Fill Color: Sets interior shade of squeeze boxes; semitransparent for layering. Default: orange (80% trans.). Tradeoffs/Tips: Soften with more transparency in multiindicator setups; bold for standalone use—ensures boxes pop without overwhelming.
Box Border Color: Defines outline hue and solidity for box edges. Default: orange (0% trans.). Tradeoffs/Tips: Match fill for cohesion or contrast for edges; thin width keeps it clean—helps delineate bounds in zoomed views.
Keep Last N Boxes: Limits historical boxes/lines/labels to this count, deleting oldest for performance. Default: 10. Tradeoffs/Tips: Increase to 50 for weekly reviews; set to 0 for unlimited (risks lag)—balances history vs. speed on long charts.
Draw Box in Realtime (build/update): Enables live extension of boxes during squeezes vs. waiting for end. Default: true. Tradeoffs/Tips: Disable for confirmedonly views to mimic backtests; enable for proactive trading—adds minor repaint on live bars.
Box: Max First N Bars: Caps buffer collection to initial squeeze bars, freezing after for efficiency. Default: 15. Tradeoffs/Tips: Shorten to 510 for fast intraday; extend to 20 in dailies—prevents bloated arrays but may truncate long squeezes.
Reading & Interpretation
Squeeze phases appear as orange boxes encapsulating the trimmed price cluster during lowvolatility holds—narrow boxes signal tight consolidations, while wider ones indicate looser ranges within the threshold. The box's top and bottom represent the quantilecapped high and low of collected prices, with the interior fill shading the containment zone; ignore extremes outside for "true" bounds. Postsqueeze, a solid horizontal line extends right from the box's midpoint, acting as a reference level for potential breakout tests—drifting prices toward or away from it can hint at building momentum. Tiny orange circles at the line's start mark completion points for easy scanning. Debug lines (if on) show deviation hugging or crossing the threshold, confirming hold logic; a persistent hug below suggests prolonged calm, while spikes above reset counters.
Practical Workflows & Combinations
Trend following: Enter long on squeezeend close above the box top (or midpoint line) confirmed by higher high in structure; filter with rising 50period average to avoid countertrend traps. Use boxes as support/resistance proxies—short below bottom in downtrends.
Exits/Stops: Trail stops to the box midpoint during postsqueeze runs for conservative holds; go aggressive by exiting on retest of opposite box side. If debug shows repeated threshold grazes, tighten stops to curb drawdowns in ranging followups.
Multiasset/MultiTF: Defaults work across stocks, forex, and crypto on 15min+ frames; scale Length proportionally (e.g., x2 on hourly). Layer with highertimeframe boxes for confluence—e.g., daily squeeze + 1H box for entry timing. (Unknown/Optional: Specific multiTF scaling recipes beyond proportional adjustment.)
Behavior, Constraints & Performance
Repaint/confirmation: Core calculations use historical closes, confirming on bar close; active boxes repaint their right edge and levels live during squeezes if enabled, but freeze irrevocably on hold limit or end—mitigates via barbybar buffer adds without future leaks. No lookahead indexes.
security()/HTF: None used, so no external timeframe repaints; all native to chart resolution.
Resources: Caps at 300 boxes/lines/labels total; small arrays (up to 20 elements) and short loops in sorting/minfinding keep it light—suitable for 10k+ bar charts without throttling. Persistent variables track state across bars efficiently.
Known limits: May lag on ultrasharp volatility spikes due to baseline smoothing; gaps or thin markets can skew trims if buffer hits cap early; overlaps suppress visuals but might hide chained squeezes—(Unknown/Optional: Edge cases in nonstandard sessions).
Sensible Defaults & Quick Tuning
Start with defaults for most liquid assets on 1Hdaily: Length 20, Multiplier 0.8, Hold 1, Quantile 0.718—yields balanced detection without excess noise. For too many false starts (choppy charts), increase Hold to 3 and Baseline Length to 70 for stricter confirmation, reducing signals by 3050%. If squeezes feel sluggish or miss quick coils, shorten Length to 14 and enable EMA baseline for snappier adaptation, but monitor for added flips. In highvol environments like options, tighten Multiplier to 0.6 and Quantile to 0.6 to focus on core ranges; reverse for calm pairs by loosening to 0.95. Always backtest tweaks on your asset's history.
What this indicator is—and isn’t
This is a volatilityfiltered visualization tool for spotting and bounding consolidation phases, best as a signal layer atop price action and trend filters—not a standalone predictor of direction or strength. It highlights setups but ignores volume, momentum, or news context, so pair with discreteness rules like higher highs/lows. Never use it alone for entries; always layer risk management, such as 12% stops beyond box extremes, and position sizing based on account drawdown tolerance.
Disclaimer
The content provided, including all code and materials, is strictly for educational and informational purposes only. It is not intended as, and should not be interpreted as, financial advice, a recommendation to buy or sell any financial instrument, or an offer of any financial product or service. All strategies, tools, and examples discussed are provided for illustrative purposes to demonstrate coding techniques and the functionality of Pine Script within a trading context.
Any results from strategies or tools provided are hypothetical, and past performance is not indicative of future results. Trading and investing involve high risk, including the potential loss of principal, and may not be suitable for all individuals. Before making any trading decisions, please consult with a qualified financial professional to understand the risks involved.
By using this script, you acknowledge and agree that any trading decisions are made solely at your discretion and risk.
Do not use this indicator on HeikinAshi, Renko, Kagi, PointandFigure, or Range charts, as these chart types can produce unrealistic results for signal markers and alerts.
Best regards and happy trading
Chervolino

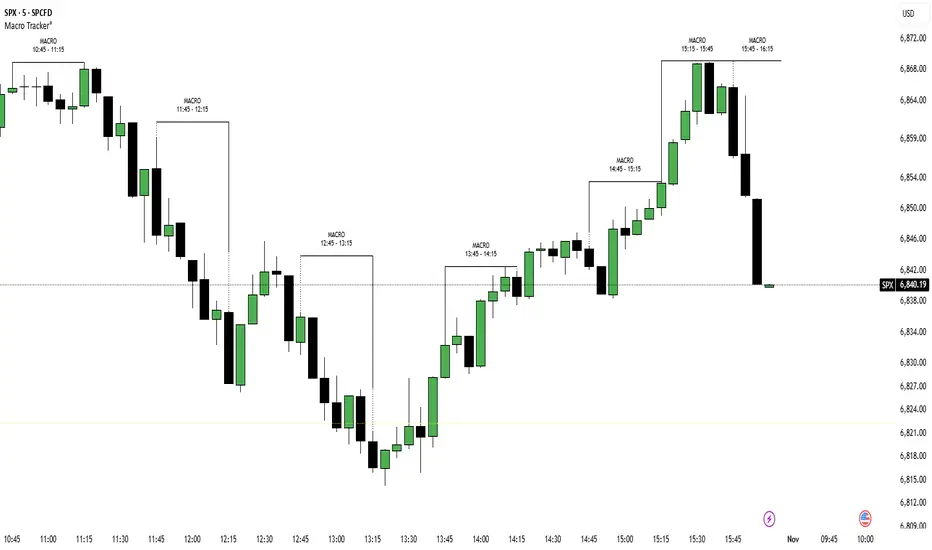
Extended MacrosExtended Macro Times from XX:42 to XX:15.
These are the times to trade and when the Smart Money Reversal is likely to occur.

Deyler IndicatorMerge indicators:
Nwog
ICT Killzones and Pivots
BTC Keylevels
9h30 First FVG
Round Number

RTH Previous Day's Range + SMTs [bilal x shpat]Overview
This advanced indicator is designed specifically for futures and equity traders who focus on Regular Trading Hours (RTH) sessions. It automatically plots the previous RTH session's high and low levels and detects Smart Money Theory (SMT) divergences across multiple correlated or inversely correlated instruments.
Key Features
📊 RTH Range Detection
Automatically identifies and tracks Regular Trading Hours (9:30 AM - 4:14 PM New York time)
Plots horizontal lines at the previous RTH session's high and low
Works seamlessly on all timeframes, including ETH (Extended Trading Hours) charts
Lines dynamically extend and update as new bars form
🔄 Smart Money Theory (SMT) Divergence Detection
Compares up to 3 correlated or inversely correlated assets simultaneously
Detects bullish and bearish SMT divergences automatically
Visual divergence lines connect previous session levels to current intraday highs/lows
Customizable SMT labels showing which instruments are diverging
Option to mark assets as "Correlated" or "Inversely Correlated" for accurate divergence detection
SMT detection occurs only during RTH sessions for cleaner signals
🎨 Fully Customizable Styling
3 Label Styles: Choose between "Full" (RTH Previous Day High), "Short" (RTH PDH), or "Lowercase" (rth previous day high)
Adjustable Label Sizes: Tiny, Small, Normal, or Large
Custom Colors: Separate color controls for lines, labels, bullish SMT, and bearish SMT
Line Extension: Control how many bars ahead lines extend
Line Width: Customize line thickness
📈 SMT Visual Indicators
Arrow Symbols: ▲ = Higher / ▼ = Lower (for correlated assets)
Alternate Symbols: 🔺 = Higher / 🔻 = Lower (for inversely correlated assets)
Color-coded divergence lines (white by default, fully customizable)
Optional SMT labels showing ticker symbols with directional indicators
Optional comparison table displaying current divergence status
⚙️ Comparison Settings
Add up to 2 comparison symbols (e.g., ES1!, YM1!, NQ1!)
Toggle each comparison asset on/off independently
Set correlation type (Correlated or Inversely Correlated) for each asset
Popular comparisons: ES vs NQ, YM vs ES, Equity vs Futures
🧹 Clean Chart Management
Option to delete previous RTH SMTs when new session starts
Automatic cleanup of outdated lines and labels
Transparent label backgrounds for minimal chart clutter
Lines track exact bar where high/low occurred
How It Works
Session Detection: The indicator identifies when RTH begins (9:30 AM ET) and tracks all price action during the session until close (4:14 PM ET)
Level Capture: At the start of each new RTH session, it captures the previous session's high and low and plots them as reference levels
SMT Analysis: During the current RTH session, it continuously compares the current session's high/low with the previous session's high/low across all selected instruments
Divergence Identification: When one instrument makes a higher high while another makes a lower high (or vice versa), an SMT divergence is detected and visualized
Use Cases
Liquidity Analysis: Identify when markets are taking liquidity at different rates
Reversal Signals: SMT divergences often precede significant reversals
Correlation Trading: Monitor when traditionally correlated markets begin to diverge
Key Level Trading: Use previous RTH high/low as support/resistance levels
Multi-Market Analysis: Compare ES, NQ, and YM simultaneously for institutional flow
Best Practices
Most effective on intraday timeframes (1m - 15m charts)
Works on both RTH and ETH chart sessions - meant to be used on a RTH chart
Compare highly correlated instruments (e.g., ES1! vs NQ1!)
Use in combination with volume analysis and market structure
SMT divergences are most powerful near key levels
Settings Overview
Comparison Symbols
Asset 2 & 3: Select tickers to compare (e.g., ES1!, YM1!)
Correlation toggles for each asset
Enable/disable each comparison independently
Styling
Line color, width, and extension length
Label color, size, and style (3 options)
Separate colors for bullish and bearish SMT lines
SMT Controls
Toggle SMT detection on/off
Show/hide SMT text labels
Optional SMT comparison table
Delete previous session SMTs option
Note: This indicator is best used by traders familiar with Smart Money Concepts (SMC) and inter-market analysis. Understanding market correlations is essential for accurate interpretation of SMT divergences.
thank you shpat for the SMT option in the last indicator, i tweaked it for this one

Session Engine — Market Opens, Killzones & Levels — SMC/ICTSession Engine — Market Opens, Killzones & Institutional Levels (Tokyo • London • New York) — SMC/ICT — TradingATH (PueblaATH)
Precision. Sessions. Structure.
Session Engine maps the institutional heartbeat of the day across Tokyo , London , and New York . It draws timezone-accurate Market Open Lines , clean Killzones (incl. London–NY overlap), and a rock-solid, timeframe-safe suite of Previous High/Low Levels (PDH/PDL/PWH/PWL/PMH/PML). On top, a compact Session Comparison Table with an integrated ADR panel shows extension, momentum context, and distance to key levels — at a glance.
Designed for SMC/ICT Traders who demand clarity and reliability, this tool stays stable when you change timeframe, reload, or zoom.
Map the day like a Pro : timezone-true Opens, configurable Killzones, TF-safe PDH/PDL/PWH/PWL/PMH/PML , and a sleek ADR panel beneath a Session Comparison Table . Built for precision SMC/ICT Execution . Zero flicker, full control.
Why Traders Love It
Timezone-Accurate Session Engine — Tokyo, London, New York opens and the London–NY overlap, all resolved to bar-time for precise plotting on any symbol.
Killzones you can trust — choose full-column height or price-bounded height with custom top/bottom tick offsets and label placement.
Bulletproof Previous Levels — PDH, PDL, PWH, PWL, PMH, PML are cached and only refresh on true D/W/M boundaries, eliminating the classic “levels disappear on TF change” problem.
Actionable Context — a compact Session Comparison Table (vs previous session & vs previous day) plus an ADR panel with extension thresholds, distance to PDH/PDL, and current H-L range.
Serious Customization — dotted/solid lines, widths, label size & alignment, auto label backgrounds, block transparency, weekend & timeframe filters, and more.
Performance-Minded — persistent objects are updated in place (not spam-created) to keep your chart crisp and responsive.
What You’ll See
Market Opens — Vertical opens for TOK/LDN/NY with dotted/solid styling, width control, infinite or bounded height, and optional labels.
Killzones + Overlap — Transparent time boxes for session windows (and London–NY overlap). Optional labels, adjustable transparency, and height mode.
Institutional Levels — PDH / PDL / PWH / PWL / PMH / PML with length modes: Infinite, N bars, or End of day. Optional labels with typographic control.
Session Comparison Table — For each session: bias vs previous session and previous day, with optional Δ% column.
ADR Panel — 24h rolling ADR% consumption with two attention thresholds, distance to PDH/PDL (price units), and current H-L range.
How It Works
Session Timing uses explicit IANA timezones (Asia/Tokyo, Europe/London, America/New_York) then anchors to bar_time for pixel-perfect placement.
Killzones are persistent boxes that reset only on daily change, preventing redundant object creation.
Previous Levels are requested once per true period roll (D/W/M) and stored locally; this cache keeps lines stable when switching TFs or reloading charts.
Level Line Length is enforced per-object (Infinite, N bars, End of day) with dynamic x2 handling — no redraw flicker.
ADR uses a timeframe-agnostic 24h rolling window for H/L/range; ADR length is defined in “days” and mapped to bars for any timeframe.
How to Use
Set Session Times (defaults are standard). Adjust the London–NY overlap if your venue differs.
Style your Opens & Killzones — line width, dotted/solid, infinite or bounded height, label font size/align/background.
Choose Level Behavior — Infinite, N bars, or End of day for PD/ PW / PM lines; toggle labels as needed.
Read the Table and ADR — quick bias vs previous session/day, Δ% if you enable it; ADR panel highlights extension with blink thresholds and shows live distance to PDH/PDL.
Inputs
Schedules — Open times + killzone windows for TOK/LDN/NY, and London–NY overlap.
Style — Line width, dotted/solid, label sizes & alignment, auto backgrounds.
Heights — Infinite or tick-bounded line height; full-column or tick-bounded killzones.
Levels — Show/hide PDH/PDL/PWH/PWL/PMH/PML; length mode; label options.
Table & ADR — Font size, arrows, Δ% column, ADR length (days), blink thresholds, show/hide rows.
Filters — Hide visuals on specified timeframe ranges; optional weekend suppression.
Best Practices
Use “End of day” for tidy level lines that still convey right-hand context.
Set ADR thresholds to your instrument’s personality (e.g., 80/120 for FX, 100/150 for crypto).
On exotic trading sessions, verify the IANA timezone alignment and tweak inputs accordingly.
If you stack many tools, consider disabling unused sessions/rows to stay within object limits.
What Makes It Original
A cohesive Session Engine architecture that unifies timezone-true Opens, configurable Killzones/Overlap, and TF-safe previous levels — tailored for SMC/ICT execution.
Robust caching that eliminates TF-switch flicker and preserves dependent calculations (distance to PDH/PDL, ADR%) without gaps.
A unified ADR panel directly under the session table with real-time extension signaling and distance-to-PDH/PDL — pragmatic, trade-ready context you won’t find in generic session scripts.
Deep length & typography controls so visuals are informative and elegant.
Notes & Disclaimer (Originality & Rights)
Original Work Notice — Please read — This script/indicator is an original work created exclusively by TradingATH ( PueblaATH ). It is not derived from, copied from, or authored by any other person or entity. Any resemblance to other scripts is coincidental and limited to the use of public and widely known trading concepts.
Usage & Publication — Redistribution, cloning, or republishing this script (in whole or in part) without the explicit written permission of TradingATH ( PueblaATH ) is prohibited. By using this tool, you acknowledge the author’s exclusive authorship and associated rights.
No Financial Advice — This tool is for educational/informational purposes only and does not constitute financial advice. Markets carry risk; manage your risk and make your own decisions.
HTF Ranges - AWR/AMR/AYR [bilal]📊 Overview
Professional higher timeframe range indicator for swing and position traders. Calculate Average Weekly Range (AWR), Average Monthly Range (AMR), and Average Yearly Range (AYR) with precision projection levels.
✨ Key Features
📅 Three Timeframe Modes
AWR (Average Weekly Range): Weekly swing targets - Default 4 weeks
AMR (Average Monthly Range): Monthly position targets - Default 6 months
AYR (Average Yearly Range): Yearly extremes - Default 9 years
🎯 Dual Anchor Options
Period Open: Week/Month/Year opening price
RTH Open: First RTH session (09:30 NY) of the period
📐 Projection Levels
100% Range Levels: Upper and lower targets from anchor
Fractional Levels: 33% and 66% zones for partial targets
Custom Mirrored Levels: Set any percentage (0-200%) with automatic mirroring
Example: 25% shows both 25% and 75%
Example: 150% shows both 150% and -50%
📊 Information Table
Active range type (AWR/AMR/AYR)
Average range value for selected period
Current period range and percentage used
Distance remaining to targets (up/down)
Color-coded progress (green/orange/red)
🎨 Fully Customizable
Orange theme by default (differentiates from daily indicators)
Line colors, styles (solid/dashed/dotted), and widths
Toggle labels on/off
Adjustable lookback periods for each timeframe
Independent settings for each range type
⚡ Smart Features
Lines start at actual period open (not fixed lookback)
Automatically tracks current period high/low
Works on any chart timeframe
Real-time range tracking
Alert conditions when targets reached or exceeded
🎯 Use Cases
AWR (Weekly Ranges):
Swing trade targets (3-7 day holds)
Weekly support/resistance zones
Identify weekly trend vs rotation
Compare daily moves to weekly context
AMR (Monthly Ranges):
Position trade targets (2-4 week holds)
Monthly breakout levels
Institutional-level zones
Earnings play targets
AYR (Yearly Ranges):
Major reversal zones
Long-term support/resistance
Identify macro trend strength
Annual high/low projections
💡 Trading Strategies
AWR Strategy (Swing Trading):
Week opens near AWR lower level = potential long setup
Target AWR 66% and 100% levels
Week hits AWR upper in first 2 days = watch for reversal
Use fractional levels as scale-in/scale-out points
AMR Strategy (Position Trading):
Month opens near AMR extremes = fade setup
Month breaks AMR in week 1 = expansion (trend) month
Target opposite AMR extreme for swing positions
Use 33%/66% for partial profit taking
AYR Strategy (Long-term Context):
Price near AYR extremes = major reversal zones
Breaking AYR levels = historic moves (rare)
Use for macro trend confirmation
Great for yearly forecasting and planning
📊 Range Interpretation
<33% Range Used: Early in period, room for expansion
33-66% Range Used: Normal progression
66-100% Range Used: Extended, approaching extremes
>100% Range Used: Expansion period - trending or high volatility
⚙️ Settings Guide
Lookback Periods:
AWR: 4 weeks (standard) - adjust to 8-12 for smoother average
AMR: 6 months (standard) - seasonal patterns
AYR: 9 years (standard) - captures full cycles
Anchor Type:
Period Open: Use for clean week/month/year open reference
RTH Open: Use if you only trade day session, ignores overnight gaps
Custom Levels:
25% = quartile targets
75% = three-quarter targets
80% = "danger zone" for reversals
111% = extended breakout target
🔄 Combine with ADR Indicator
Run both indicators together for complete multi-timeframe analysis:
ADR for intraday precision
AWR/AMR/AYR for swing/position context
See if today's ADR move is significant in weekly/monthly context
Multi-timeframe confluence = highest probability setups
💼 Ideal For
Swing Traders: Use AWR for 3-10 day holds
Position Traders: Use AMR for 2-8 week holds
Long-term Investors: Use AYR for macro context
Index Futures Traders: ES, NQ, YM, RTY
Multi-timeframe Analysis: Combine with daily ADR

Advanced ICT ADR Projections [bilal]📊 Overview
Professional ADR indicator designed specifically for index futures traders. Calculate and visualize Average Daily Range with multiple session options, fractional levels, and higher timeframe context.
✨ Key Features
🎯 Multiple Session Types
Full Day: Standard calendar day calculation
Midnight: Anchored to 00:00 NY time open
RTH (Regular Trading Hours): 09:30-16:00 NY session
Custom: Define your own session hours and anchor point
📐 Projection Levels
100% ADR Levels: Upper and lower range targets from anchor
Fractional Levels: 33% and 66% zones for partial targets
Custom Mirrored Levels: Set any percentage (0-200%) with automatic mirroring
Example: 25% shows both 25% and 75%
Example: 111% shows both 111% and -11%
📅 Higher Timeframe Context (Optional)
AWR: Average Weekly Range overlay
AMR: Average Monthly Range overlay
AYR: Average Yearly Range overlay
All HTF ranges use same anchor as daily session
📊 Information Table
Current session type and anchor time
ADR value for selected period
Current range and percentage used
Distance remaining to ADR targets (up/down)
Color-coded range percentage (green/orange/red)
🎨 Fully Customizable
Line colors, styles (solid/dashed/dotted), and widths
Toggle labels on/off
Adjustable ADR lookback period (1-100 days)
All HTF periods customizable
⚡ Smart Features
Lines start at actual session open (not fixed lookback)
Works on any timeframe
Real-time range tracking
Alert conditions when ADR reached or exceeded
🎯 Use Cases
For Day Traders:
Set profit targets at ADR extremes
Identify range expansion vs rotation days
Know when you've used 75%+ of daily range (possible reversal)
Compare RTH vs full day ranges
For Swing Traders:
Use AWR/AMR for weekly/monthly targets
Understand if today's move is significant in weekly context
Multi-timeframe confluence
Risk Management:
Size positions based on % of ADR remaining
Avoid trading when ADR exhausted (>100%)
Better stop placement using fractional levels
💡 Trading Tips
<50% ADR used = Room to run (continuation trades)
50-75% ADR used = Getting extended (scale out)
75-100% ADR used = Near extremes (reversal setups)
>100% ADR = Expansion day (trend day or volatility spike)
Use fractional levels (33%, 66%) as:
Partial profit targets
Re-entry zones on pullbacks
Confluence with other support/resistance
Compare RTH vs Full Day ADR to see if overnight or day session drives volatility.
⚙️ Settings Guide
ADR Period: 5 days is standard, adjust for different market regimes
Session Types:
Use Midnight for crypto or 24hr markets
Use RTH for pure day session analysis
Use Custom for specific session times (London, Asia, etc.)
Custom Levels:
Set 25% for quartile levels
Set 111% for extended targets beyond ADR
Experiment with 50%, 75%, 80% for your strategy
Perfect for ES, NQ, YM, RTY futures traders who need precise intraday range analysis with higher timeframe context!

Session Liquidity Levels – Indicator for Smart Day Traders🧭 Session Liquidity Levels – Indicator for Smart Day Traders
Identify Key Market Liquidity Zones with Precision
The Session Liquidity Levels indicator automatically plots the most important market levels every day — giving you a clear view of where liquidity is building and where potential reversals or breakouts can occur.
This tool is designed for traders who rely on session structure and clean market levels rather than noise or lagging indicators.
⚙️ Features
✅ Asia Session High & Low – See the overnight range where liquidity starts building.
✅ London Session High & Low – Track the major volatility window and identify sweeps or fakeouts.
✅ Previous Day High & Low – Key reference points for continuation or reversal plays.
✅ Custom Colors & Styling – Personalize line colors and styles to fit your chart theme.
✅ Lightweight & Fast – Built in Pine Script v5 for smooth performance on all assets.
📊 How It Helps
Quickly visualize session highs/lows to plan liquidity grabs or breakout entries.
Mark daily structure without manually drawing lines.
Combine with your existing strategy to refine entry and exit timing.
Works on Forex, Indices, and Metals across all intraday timeframes.
⚡ Best For
Day traders who use session-based strategies (like Asia → London → New York transitions).
Traders studying liquidity sweeps, breakouts, or market structure shifts.
Anyone who wants a clean, automatic way to see session boundaries and key highs/lows.
🕌 Ethical Note
This indicator is 100% original, independently coded, and inspired by common trading concepts such as session ranges and daily structure.
It is not affiliated with or copied from any other paid indicators.
💰 Access
Available as an Invite-Only Script on TradingView.
Once purchased, you’ll receive access within 24 hours.
📩 Support
If you have any issues or want custom modifications (extra sessions, alerts, etc.), contact me directly — I’ll help you set it up.
Trade smarter. Stay disciplined. Let your levels guide you.

Custom Horizontal Lines | Trade Symmetry📊 Custom Horizontal Lines
🔍 Overview
The Custom Horizontal Lines is a precision utility designed for traders who perform manual higher-timeframe analysis and want to preserve their marked price levels directly on the chart.
It doesn’t calculate or detect anything automatically — instead, it acts as your personal level memory, preserving your analyzed zones and reference prices throughout the session.
Ideal for traders who manually mark the High, Low, Open, Close, Mean Thresholds, and Quarter Levels of Order Blocks, Fair Value Gaps, Inversion Fair Value Gaps and Wicks before the trading day begins.
⚙️ Key Features
✅ Manual Level Entry — Input your analyzed price levels (OB, FVG, WICK,etc) directly into the indicator settings.
✅ Preserved Levels — Once entered, your lines stay visible and consistent — even after switching symbols, timeframes, or reloading the chart.
✅ Supports All Level Types — Store any kind of manually defined level: OB highs/lows, FVG boundaries, Wicks, Mean Thresholds, Quarter levels, or custom reference prices.
✅ Clean Visualization — Customize line color, style, and labels for easy visual organization.
✅ Session-Ready Workflow — Built for pre-market preparation — enter your HTF levels once, and trade around them all day.
✅ No Auto Calculations — 100% manual by design — ensuring only your analyzed levels are shown, exactly as you defined them.
💡 How to Use
Open the indicator’s settings and manually enter those price values.
The indicator will plot and preserve those exact levels on your chart.
Switch to your lower timeframe and observe how price reacts around them — without ever needing to redraw.
🎯 Why It’s Useful
Keeps your HTF levels organized and persistent across sessions.
Saves time by avoiding redrawing.
Fits perfectly into ICT / Smart Money trading workflows.
Ensures full manual control and precision over what’s displayed on your chart.
🧩 Ideal For
ICT and Smart Money traders
Institutional-style manual analysts
Traders marking Mean Thresholds, or Quarter Levels of OBs, FVGs, Wicks etc
Anyone who wants a clean, reliable way to preserve their manual analysis

ICT Macro Tracker (xx:45-xx:15) (MTMGBS)Adjusted pinescript to reflect xx:45-xx:15 instead of the traditional xx:50-xx:15