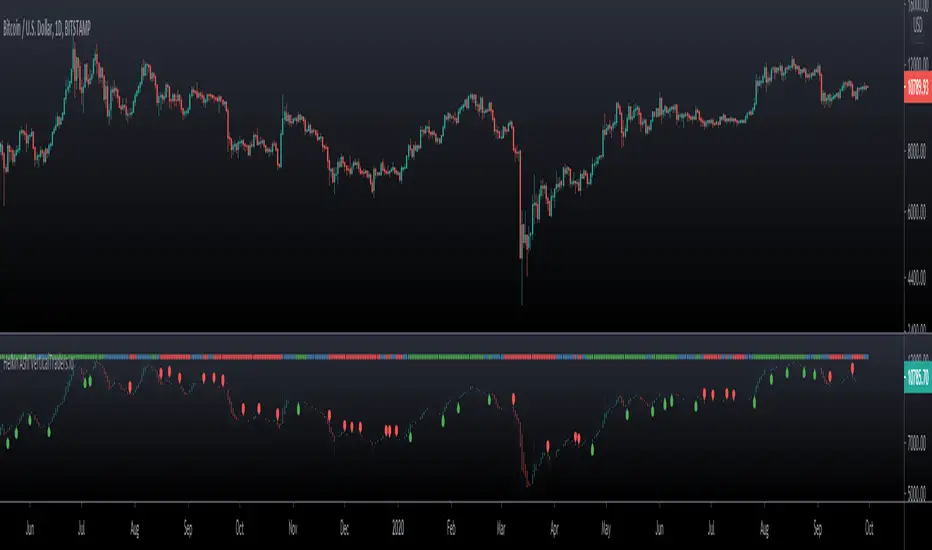
HeikinAshi_Atr_StrategyThis strategy combines HeikinAshi and ATR, have better performance on 5min XBTUSD pair after parameter optimization.
Different from the original HeikinAshi chart provided by Tradingview (which is Repainting ), this script does not use the HeikinAshi SECURITY function so there is no Repainting!
Try it by yourself !!
Heikin

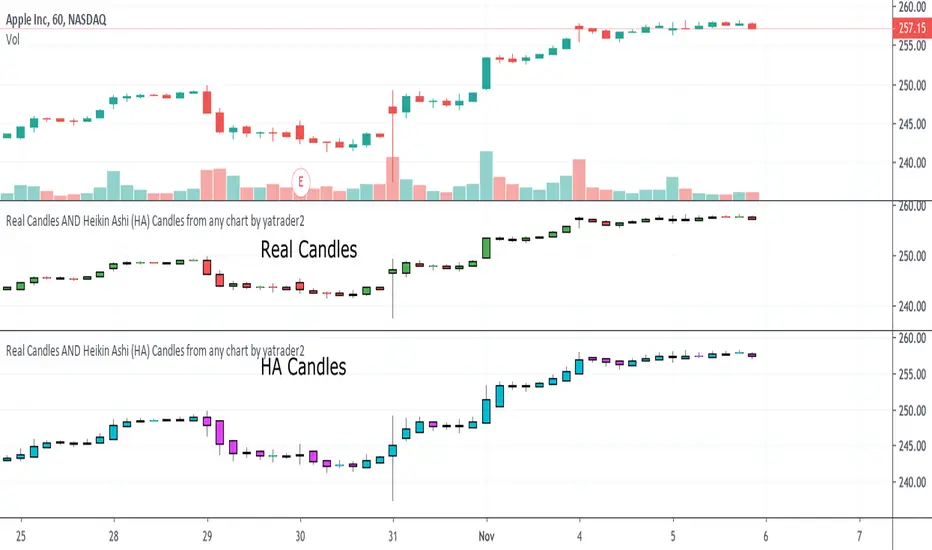
Real Candles Heikin Ashi (HA) Candle functionsThis script plots both real and HA candles regardless or which are used on the chart in TV settings.
(and has the functions for you to use.)
Lots of people seem to misunderstand backtesting (or scam people) based on HA candles.
Backtesting with HA candles leads to impossible trades. ALWAYS backtest with real candles.
That doesn't mean you might not want to look at HA candle values to make trading decisions.
Add the code below to calculate HA candles from real and use that in your HA trading algo,
but test it on real charts.
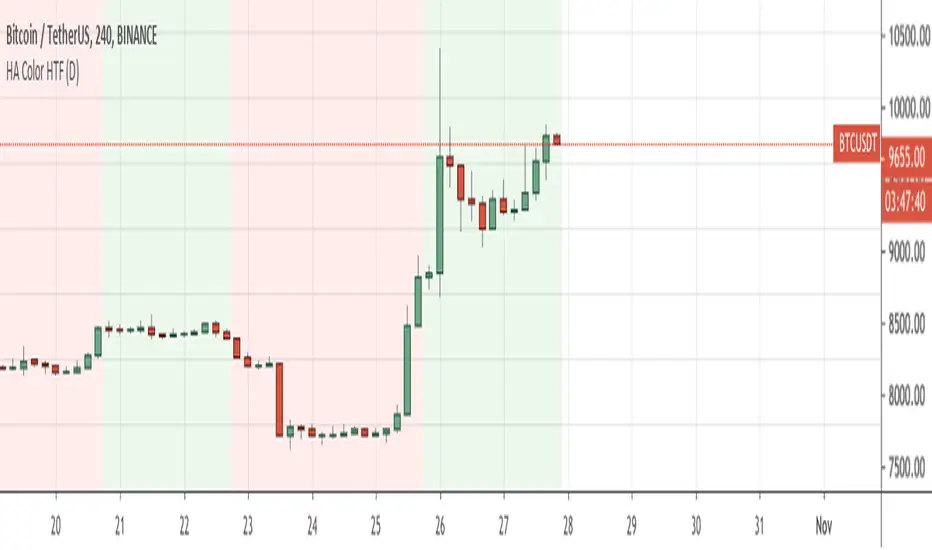
QuantNomad - Heikin Ashi Colors Higher TimeframeSimple script displaying color of Heiken Ashi candles from higher timeframes as a background.
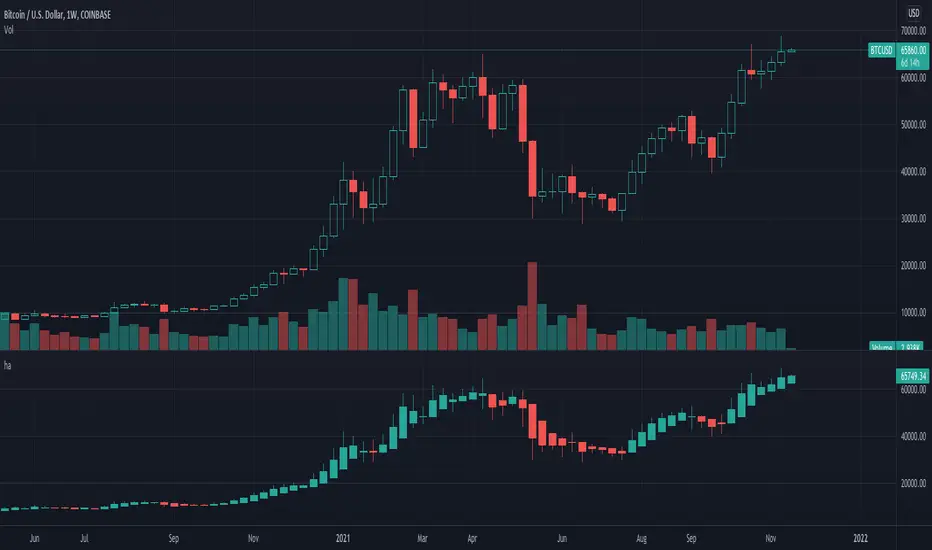
Heiken AshiHeikin Ashi charts are similar to candle charts, but the main difference is that a Heikin Ashi chart uses daily price averages to show the movement of the average price of an asset.
The idea is to use the heikin Ashi technique as an indicator and not as the main chart, to avoid enter or exist the market too late.
Key concepts:
- The averaged open and close help filter some of the market noise, creating a chart that tends to highlight the trend direction better than typical candlestick charts.
- The downside is that some price data is lost with averaging. The most recent price (close) may not reflect the actual price of the asset, which could affect risk.
- Long down candles with little upper shadow represent strong selling pressure. Long up candles with small or no lower shadows signal strong buying pressure.
Extra functions in this indicator:
- Trend Bar indicator, uptrend(green), downtred(red), warning or indecision (yellow).
- Long and Short Labels base on trend and Heikin Ashi entries.
- Change the color of the main chart Candlesticks as the Heikin Ashi indicators.
- Alerts for long and short entries.
- Size of Labels.
Heiken-Ashi CandlesSimple script to view Heiken-Ashi candles below a normal candles chart.
Could also be useful for using HA calcs in strategy scripts on normal candles chart for proper backtesting.
I adapted this to v4 from original v2 script by @samtsui. If you like please remember to give him a Thumbs Up for his original version! ->
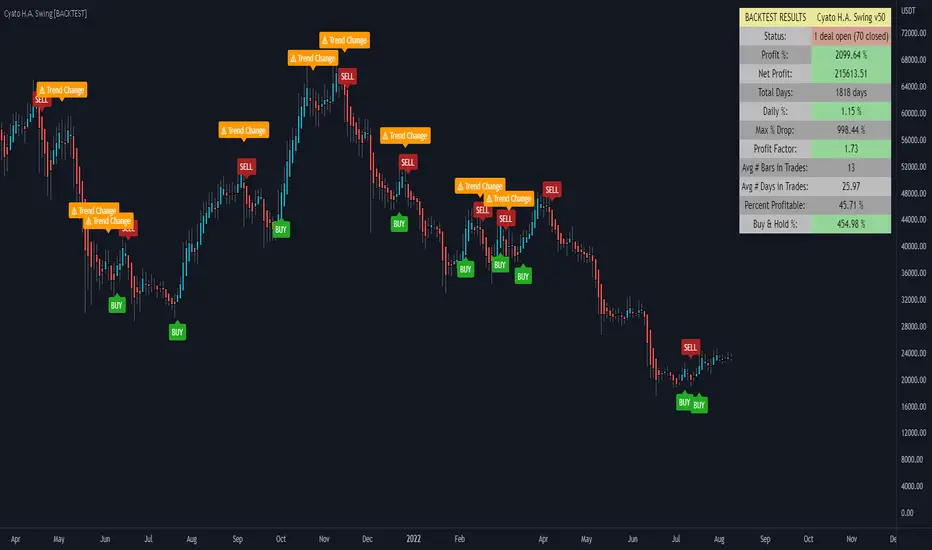
Cyatophilum H.A. Swing [BACKTEST]Hi guys, to celebrate the beginning of a new altcoins cycle, I created a Swing trade Indicator. (It's a joke, there will not be any altcoins cycle)
Cyatophilum Heikin Ashi Swing
This indicator will allow us to create one strategy for each pair and never miss those big swings ever again!
HOW BEAT BUY & HOLD WORKS
This kind of strategy is a safe long term investment , usually played in high timeframes such as 4H, 1D etc.
It is perfect for beginners in trading as the process is very simple: buy and sell when you receive the alert. The high timeframes allows to trade manually by receiving alerts on your phone or email, but you also can automate it if you prefer.
The primary goal of these strategies is to increase your capital faster than someone simply holding the asset .
The trades are made with no leverage and 100% equity . It is for those who want to grow their portfolio fast without risking to lose everything. You can use several strategies at once, in this case split your equity accordingly.
HOW DOES IT WORK?
The Heikin Ashi candles are very usefull. This strategy is built upon H.A. candles but is used on normal candles, because H.A. candles price are an average of real candles and we want to know the real price. I did the trick by recalculating the H.A. open, high, low and close with the original formula based on the real candles's ohlc. This allows me to use the strategy tester and backtest with real results.
HOW TO USE
Creating a signal is as simple as adding the indicator called to your chart and click "Set alert". Select "Once per bar close" for your alert options.
There are 3 alerts:
- BUY
- SELL
- BUY OR SELL (for free TV users)
Sample Backtest results
Bitcoin/Dollar
Ethereum/Bitcoin
Basic Attention Token/Bitcoin
> > Start using the indicator now < <
Note: This version is the BACKTEST. You can find the Alert version in my profile scripts.
Cyatophilum H.A. Swing [ALERT SETUP]Hi guys, to celebrate the beginning of a new altcoins cycle, I created a Swing trade Indicator. (It's a joke, there will not be any altcoins cycle)
Cyatophilum Heikin Ashi Swing
This indicator will allow us to create one strategy for each pair and never miss those big swings ever again!
HOW BEAT BUY & HOLD WORKS
This kind of strategy is a safe long term investment , usually played in high timeframes such as 4H, 1D etc.
It is perfect for beginners in trading as the process is very simple: buy and sell when you receive the alert. The high timeframes allows to trade manually by receiving alerts on your phone or email, but you also can automate it if you prefer.
The primary goal of these strategies is to increase your capital faster than someone simply holding the asset .
The trades are made with no leverage and 100% equity . It is for those who want to grow their portfolio fast without risking to lose everything. You can use several strategies at once, in this case split your equity accordingly.
HOW DOES IT WORK?
The Heikin Ashi candles are very usefull. This strategy is built upon H.A. candles but is used on normal candles, because H.A. candles price are an average of real candles and we want to know the real price. I did the trick by recalculating the H.A. open, high, low and close with the original formula based on the real candles's ohlc. This allows me to use the strategy tester and backtest with real results.
HOW TO USE
Creating a signal is as simple as adding the indicator called to your chart and click "Set alert". Select "Once per bar close" for your alert options.
There are 3 alerts:
- BUY
- SELL
- BUY OR SELL (for free TV users)
Sample Backtest results
Bitcoin/Dollar
Ethereum/Bitcoin
Basic Attention Token/Bitcoin
> > Start using the indicator now < <
Note: This version is the ALERT SETUP. You can find the Backtest version on my profile scripts.

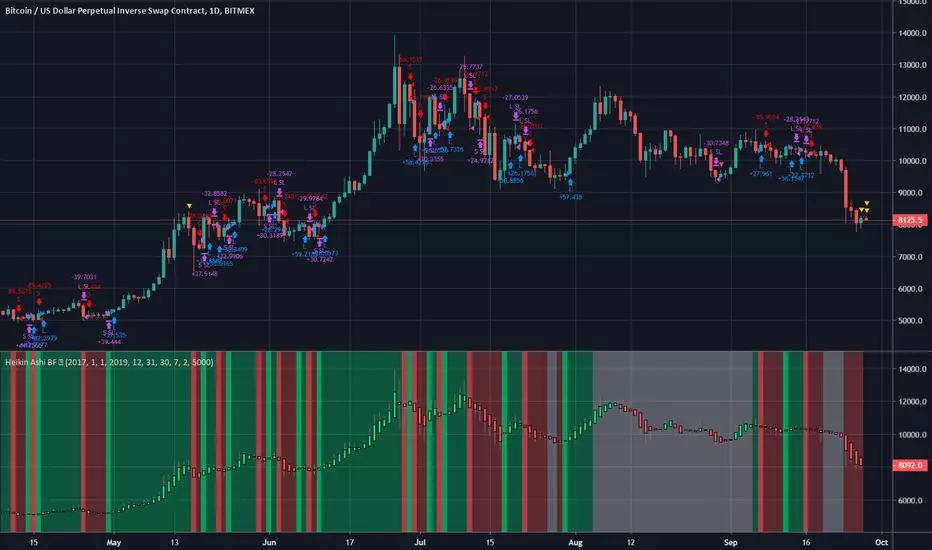
Heiken Ashi BF Heiken Ashi candles help us to identify a trend.
This strategy simply enters a long when the Heiken Ashi candles turn green and a short when they turn red.
Because of the way BTC price moves in medium term trends, this simple strategy seems effective.
There is a rate of change function applied to avoid some of the choppy sideways action (thanks again to kiasaki for the code)
There is a 2% fixed stop loss applied and an optional take-profit setting. You can change both in the settings.
As you can see from the code, this strategy does not enter trades based on the Heiken Ashi closes, rather the actual price close. This is an important distinction since the HA closes are based on an average of the OHLC values so attempting to enter at that price may not always be possible. There are some "strategies" that use this information to try and con people by appearing to have awesome entries that are actually not attainable in all cases.
Green = Long
Red = Short
White = No trade
4K+ Candlestacks/ColumnCandles Plus PerksFor all candle analysis enthusiasts out there, this is my cutting edge "4K+ Candlestacks/ColumnCandles Plus Perks" that I spontaneously invented long ago. Just when you may have thought it was the end of the evolutionary line for candle technology, it's not! There are candlesticks and now "candlestacks". Your eyes are presently gazing upon a NEW candle type intended for destiny well into the 21st century and onward to support much higher graphics resolutions including 4K, 8K, 16K+ yielding enhanced chart analytics. With extremely high resolution display technologies arriving within the affordable range, having thin 1 pixel wide traditional candle wicks are going to become more and more visually apprehensible. Particularly for folks with a visual acuity that is not par at 20/20 or have some degree of color blindness, the candlestacks have a "large" amount of different color schemes to select from.
"Candlestick charts" are suspected to have been invented by Munehisa Homma well over 200 years ago. We have been using technology that is older than the age of distributed electricity and the modern car combined with billions at stake, hour to hour of each day. While candlesticks are effective, by having an abundance of computing power, the old candlestick wick width is becoming indistinguishably lost in the fog of a plenitude of plots. After a short time of contemplating about it linguistically in Pine Script, I arrived at a eureka moment having an actual working candle that was entirely novel. However, I didn't want to stop there. It required color finesse for diagnosed visual impairments combined with methods such as Heikin Ashi variants. My intention while inventing this was to provide the ultimate experience in candle technology that could potentially exist.
"Candlestacks" are just like the original OHLC candlesticks, however the "wick" portion is more like a column displaying visually increased situational awareness. Immediately at first sight, I originally conceived of the name "ColumnCandles" upon initial inspection of the plot, being it was remarkably similar to overlapping column charts I have been seeing for years with data metrics. In my attempt to formulate a worthier name, I noticed their appearance looks like stacks of blocks. Stacks, sticks, it sounded rhythmically sweet. I decided candlestacks would be a more appropriate name for this candle type distinguishable from candlesticks, but all to similarly sounding. I am hopeful I chose candlestacks as a fitting name that the rest of the world may come to appreciate one day when the planet is powered by nuclear "compact fusion" reactors and everyone has personal aerial transportation availability. "Candlestacks" vs "ColumnCandles", leave your opinion below in the comments if you are compelled to do so, providing a consensus. I respect your opinion either way...
Heikin Ashi, with it's advantages of identifying current short term trends, seemed worthy of inclusion, so I decided to expand on candlestacks with three different formulations to select from, including a fourth OHLC basic type. There are two distinct methods of Hieken Ashi employing pre-smoothing and post-smoothing techniques, each of which having capabilities of using different smoothing filters that are selectable.
Other features include a brightening option for the first descending candle which is best suited while using Heikin Ashi. The candlestacks wick transparency is independently controllable. Descending candlestacks have a darker wick than the ascending kind. With the Heikin Ashi smoothing techniques, I included a selection to see traditional candlestick wicks in a supplementary fashion. Also, there is an option to control the amount of candlestacks that are displayable. This is also a multicator including my "SWIFT Moving Average Crossover", which is complimentary to the candlestacks, especially in one of the Heikin Ashi modes. This moving average crossover(MAC), having multiple color schemes, limits the divergences between the leading and lagging lines. Of notable mention, the crossover dots on the SWIFT MAC you see, are actually one bar late. Lastly, with this flagship indicator, I included a multi-color "neon source" line to view close, hl2, etc... in combination with the candlestacks yielding the best of both worlds selectively. Any one of the individual indicators may actually be enabled/disabled independently. Being this is an overlay chart, I "may" include other overlay indicators in the future where they provide an added benefit to what is already included.
I provided multiple color schemes for those of you who may have color blindness vision impairments. You may contact me in private, if these color schemes are not suitable for your diagnosed visual impairment, and you wish to contribute to seeing the color schemes improved along with other future indicators I shall release.
I.P.O.C.S.: "Initial Public Offering Clean Start" proprietary technology. Firstly, many of my other indicators already possess this capability. It allows suitable plotting from day one, minute one of IPO, remedying visually delayed signal analysis. It's basically accurate plotting from the very first bar (bar_index==0) on Tradingview. If you don't know what this is, most people don't, go back to the VERY beginning of any stock on the "All" chart and compare it to other similar indicators. What's so special about this? It is extremely difficult to get a healthy plot from bar_index==0 on any platform. However, I have become exceedingly talented performing this feat in most cases, but not all depending on the algorithm. This indicator is a successful accomplishment implementing IPOCS. It's inherent value is predominantly for IPO traders who in the past have had to wait 20, 50, and 150 bars before they obtain a precise indicator measurement for the simplest of algorithms in order to make a properly informed decision to potentially invest in an asset. How is this achieved? It's a highly protected secret of mine... but I will say I rarely use Pine built-in functions at all. When I do, I use them scarcely due to currently existing Pine language limitations.
Features List Includes:
I.P.O.C.S.(Initial Public Offering Clean Start) Technology
Enable/disable dark background for enhanced visibility
Color schemes for individual indicators
Controls for Heikin Ashi candlestacks smoothing
Historical bar controls
"Neon Source" options
Many, many more previously described...
This is not a freely available indicator, FYI. To witness my Pine poetry in action, properly negotiated requests for unlimited access, per indicator, may ONLY be obtained by direct contact with me using TV's "Private Chats" or by "Message" hidden in my member name above. The comments section below is solely just for commenting and other remarks, ideas, compliments, etc... regarding only this indicator, not others. When available time provides itself, I will consider your inquiries, thoughts, and concepts presented below in the comments section if you do have any questions or comments regarding this indicator. When my indicators achieve more prevalent use by TV members, I will implement more ideas when they present themselves as worthy additions. As always, "Like" it if you simply just like it with a proper thumbs up, and also return to my scripts list occasionally for additional postings. Have a profitable future everyone!
Smooth HA Candles MTF v1So this is last version of HA
this one has all MA type to choose from and MTF

HA Candles MTFJust try to make non repainting MTF candles
cross over of open and close , seen by small triangles


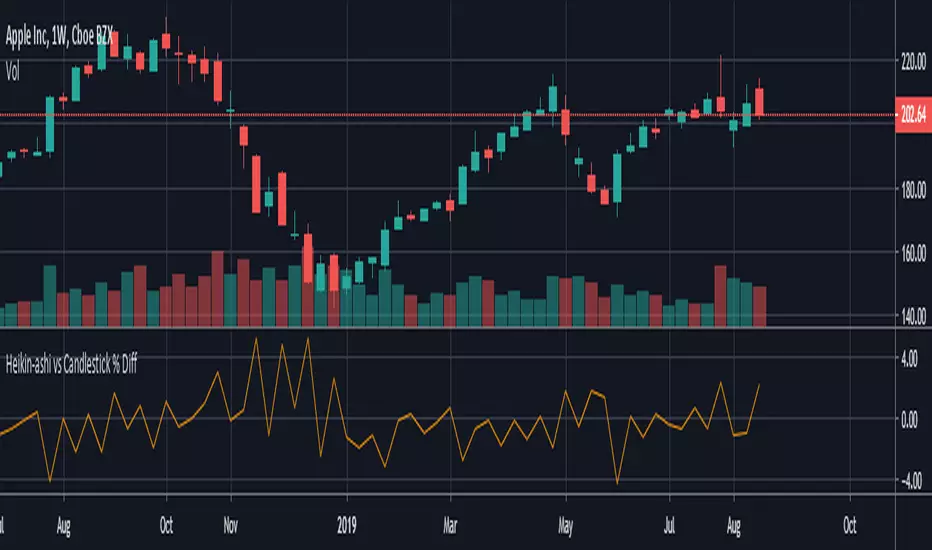
HeikinAshi - Candlestick % Difference This script shows the price difference ( %) between heikin ashi and candlestick for all investment instruments as Close, Open, High and Low. (Switchable )
In this way, you can see which instruments can easily use heikin ashi .
And by taking averages you can find the opportunity to compare which investment tools are more risk-free.
[RESEARCH] Chart Type IdentifierA viable and workable concept of chart type identification using Pine Script.
Was wollen wir trinken , sieben Tage lang
Was wollen wir trinken, so ein Durst!
Was wollen wir trinken, sieben Tage lang
Was wollen wir trinken, so ein Durst!

[RESEARCH] Heikin-Ashi Chart IdentifierA deterministic approach to identify Heikin-Ashi chart type.
The script checks the next statements about HA:
HA chart does not have any gaps in a classic sense
Every new HA open price is calculated using a specific recurrence formula. This fact also means that initial HA open price is used to calculate all the next and so on (a construction of Infinite Impulse Response filters)
The script works correctly being applied to other chart types:
Classic Candlestick
Range Bars
Line Break
Traditional Renko
ATR Renko
Traditional Point-and-Figure
ATR Point-and-Figure
Kagi
For special ones: this code allows you to check whether your script is being executed with Heikin-Ashi candles or not inside your script.
Ev sistr 'ta Laou!

DH: True-Price DOTS for Heikin AshiTrue-Price DOTS for Heikin Ashi (open/close/current)
USE:
Must Set Tradingview Candle Type to Heikin Ashi.
Works on all Timeframes and symbols.
BENEFITS:
Helps keep you aware of the actual price action as you trade and historically by adding subtle DOTS and step-lines over your Heikin Ashi candles. With this indicator, you can benefit from the price averaging and smoothing effects of Heikin Ashi while benefiting from the accuracy of traditional candles and true active price levels. Helps maximize your buy and sell entries and exits.
HOW IT WORKS:
Adds true-price DOTS (showing current-price & close)
Adds STEP-LINE (showing true open) price level to Heikin Ashi candles.
DOTS will move & update on active candle with current price movement (as candle forms) . This is beneficial for accurate entry and exits during candle development period.
Option (on/off) to add current True-Price LINE (blue line) in input settings (recommended) .
NOTE:
You may need to right-click candles and arrange "visual order" so that DOTS are on top layer of chart. Otherwise some DOTS might hide behind candles.
ENJOY!
Dan Hollings
Master Crypto Grid Trader
Host of the "High Leverage Lounge"
Please Explore My Other Indicators, Scripts, Grids and Educational Ideas.
@DanHollings on Tradingview

HTF Candle [Custom Time Period] by JustUncleL [SOMMI 1.0 edit]This is a custom High Time Frame indicator, originally created by JustUncleL. 💚
I have edited the Pine Script to allow a custom Time Period input. 💛
In the original version, you could only select from a few time periods as your High Time Frame. 💙
In this version you can put any time frame as your reference. 🧡
Example: 6-hour HTF or 2-Day HTF
SOMMI'S SPECIAL NOTES:
-This indicator works with Heikin-Ashi candles.
-Please change your candles to Heikin-Ashi and apply the indicator.
-Advised to disable "Body Wicks"
-Advised to also refresh your page a few times a day as it doesn't update properly due to limitations of TradingView / Pinescript currently.
💙💛💚🧡


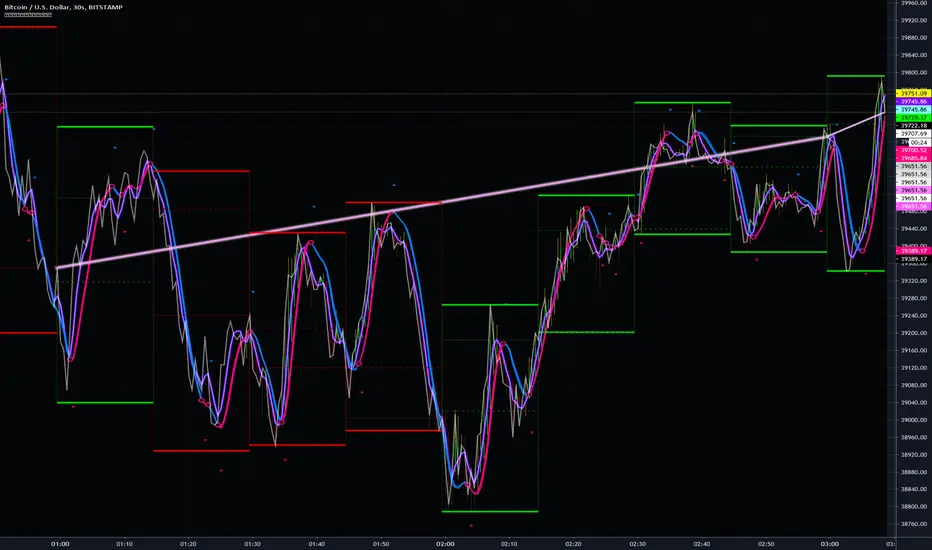
Momentum DivergenceTrading Divergence based on Momentum (Indicator below), If you want to make this a strategy i would use all those indicators above for extra confirmation.
"Momentum Divergence" indicator includes the following:
-"Momentum Waves" (blue waves)
-"Stochastic RSI" color change (green/red lines)
-"RSI" (purple line)
-"Money Flow Index" (green/red bar below)
-"Volume Weighted Average Price" ( (yellow/red areas ) (not included yet, but i will include it soon))
Green/Red circles added for possible trend Reversals
Alerts can be set on those Green/Red circles
How to Trade:
Draw Divergence between waves as shown on the chart for LONG/SHORT position (From a Big Wave to a small Wave ... The big Wave MUST be above Blue line in order to draw a divergence line (60 Threshold))
When to Sell:
There is no specific way to exit but with support/resistance zones will help to exit position AND the other indicators will help too (DONT GET GREEDY)
More info:
Since this is a combination of oscillators it should work in any time frame.
-MUST use Heikin Ashi candles.
Coming updates:
-Include VWAP
-Automatic draws divergence between HH HL LH LL waves with pine script version @4

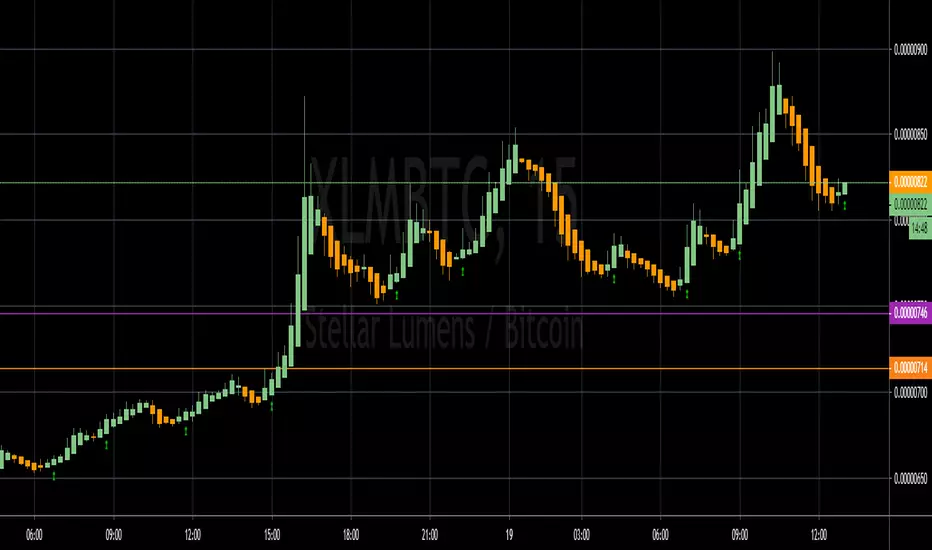
HTF Heikin AshiThis script colors standard candles or bars according to the Heikin Ashi trend at that time. (Timeframe is adjustable)
tips are always welcome at: 38uGQJDDZDL6wX48x4gYTccPeQ3ZHVYmY4 (btc)
I hope you enjoy the script :)

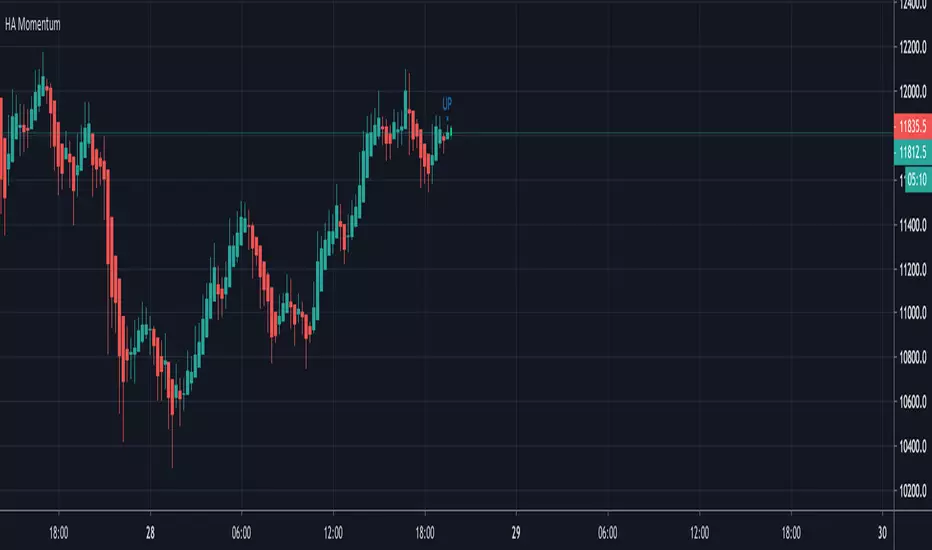
Next Candle HA MomentumVery simple script that updates realtime and shows possible next candle outcome and difference between current HA candle and current regular candle.
It's intended to use on Heikin Ashi and shows actual price on them, while on regular candles shows difference.
Idea was suggested by my husband and we decided to develop and publish it together.
Enjoy and check other scripts on my profile!
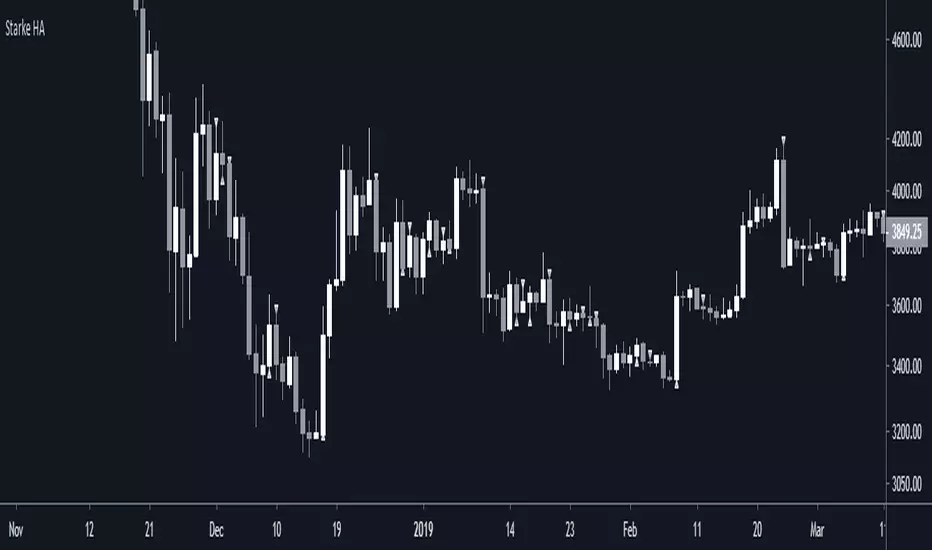
Starke Heikin AshiBasic script to show when Heikin Ashi changes up or down on-top of Japanese (regular) candles as opposed to using Heikin Ashi candles.
Heikin Ashi 1h Reversal Strategy [Mr_Orange]This my first published script, so if there are tips or questions, please let me know.
The goal of the script is to recognise a reversal pattern from bearish to bullish sentiment on a 1 hour chart. I want my trade entries to be "mechanically chosen" and not emotionally.
I have seen Heikin Ashi chart reversal scripts, as well as scripts to identify patterns on Stoch RSI , what I was looking for was a Heikin Ashi Reversal Candlestick Pattern which uses the Stochastic RSI as a confirmation for a reversal from bearish to bullish sentiment. I've yet to find one of those, so I decided to study pine scripts and make one myself that works the way I want, and because I've written it myself, I understand how it works. It is purely designed for the 1h chart and Heikin Ashi candles, please do not use it with regular candles. Other timeframes I have not studied, but in my experience, the smaller the timeframes, the trickier it gets, the higer, the more reliable.
At the moment I only included a Buy alert. I have not yet decided on a Sell signal/alert.
Thanks for checking it out!
If you think it is worth something:
- BTC: 1NrG3Sy2VW8u4wWHucj1CQjKQ6hXYwbSyX