Hybrid Heiken AshiThis indicator displays real price candles colored by Heiken Ashi trend direction, giving you the noise reduction benefits of HA without the price distortion.
Key Features:
Real candles with HA-based coloring (see actual price action with trend smoothing)
Gradient coloring based on trend strength (darker = stronger trend)
Optional HA close line overlay
Transition markers when HA flips bullish/bearish
Higher timeframe HA background for multi-timeframe confluence
Optional HA ribbon (HA close vs HA EMA)
Info panel showing current HA status, strength, and HTF alignment
Built-in alerts for HA transitions and timeframe alignment
Use Case:
Ideal for traders who want Heiken Ashi's trend-following benefits without losing sight of real price levels for entries and exits. The strength gradient helps identify conviction moves vs weak trends. HTF background helps avoid counter-trend trades.
Settings:
All visual elements are toggleable. Customize colors, choose your higher timeframe, and enable only the features you need.
Heiken
Heikin-Ashi Reversals with Region & DotsIf you want to use Heiken Ashi candles as a way to screen for bullish and bearish reversal.
Green background is stay long and strong. Red background = potential top or bearish continuation.
Yellow dots show strong red heiken ashi candles with small upside wicks. The next candle determines whether it should be green or red. If next heiken ashi candle closes above the current candle = green, bull trend still in line. If next heiken ashi candle closes below, then time to sell

Pivot Points with MID LevelsThis indicator shows the Standard Pivot Points level based on daily values that can act as support and resistance. It is used by a variety of traders around the world. You can select which time frame Pivot Point Levels you'd like. Daily, weekly etc... Perfect for swing trading or day trading.
Pivot Points- Shows 3 levels of resistance, the Pivot Point and 3 levels of support
(R3, R2, R1, PIVOT POINT, S1, S2, S3
MID Levels- The MID levels are 50% retracement from the pivot point level above it and below
Example- R3, MID, R2, MID, R1, MID, PIVOT POINT, MID, S1, MID, S2, MID, S3
With this indicator you will also have the option to show the Previous days High and Low that are also important levels. On gap up/down days it is always interesting to see if price will close the gap, hence the important level to note.
PDH= Previous Days High
PDL= Previous Days Low
I have added a feature that you can now select specific color to each level and the line style for each level to help understand which levels are being show by personal needs.
Happy Trading

RSI in Candlestick MODEDescription:
The "RSI Bar" indicator is a versatile tool designed to enhance your technical analysis on trading charts. This Pine Script™ code calculates the Relative Strength Index (RSI) for open, close, high, and low prices, and represents the results as bars on the chart. The bars are color-coded based on whether the closing RSI is higher or lower than the opening RSI.
Additionally, the indicator incorporates advanced features such as Pareto analysis and Gaussian smoothing. The Pareto analysis helps identify significant lows and highs in the RSI, providing insights into potential trend reversals. The Gaussian smoothing further refines the analysis, contributing to a more accurate representation of the average RSI trend.
Key Features:
RSI calculation for open, close, high, and low prices.
Color-coded bars for easy visualization of RSI trends.
Pareto analysis to highlight key RSI levels indicating potential reversals.
Gaussian smoothing for improved trend analysis and visualization.
Heiken-Ashi

Ultimate Heiken-AshiWhy ultimate?
It's very configurable (you can select to see the candles or a line, pick the colors, switch between Heiken-Ashi and normal candles, etc.).
In addition to standard Heiken-Ashi candles, it offers the option of a new, modified calculation of the candles different than the standard Heiken-Ashi calculation.
It can work based off the existing candles of the chart or it can force working based off normal candles regardless of any non-standard candles loaded in the current chart.
It can add the Heiken-Ashi calculation (or the modified one) twice, thus intensifying the effect.
FYI, you can disable the regular bars (so that they don't overlap with this indicator) by click on the eye icon next to the ticker on the very top left of the chart.
Manage risk and enjoy!
Candle Mania [starlord_xrp]This indicator locates and places markers on known bullish and bearish candles. All candles can be turned on/off in the settings. It also has a setting to display RSI/MFI/Stoch RSI indications of oversold and overbought areas in the background showing areas of higher interest. The last feature is a setting that allows you to see where Heiken-Ashi has switched from green to red and vice-versa. Please let me know if there is anything that you would like to see added or any improvements.

Heiken Ashi Swing Range FilterIt uses heiken-ashi candles to find swing highs and lows, then check if candles are inside the range of them. This way you can filter out ranging market.
It may be better to use it in higher timeframe than current.
Heiken Ashi Swing High/LowIt uses Heiken Ashi candles to detect recent swing high and low.
It can be used as a stop-loss or support/resistance indicator.
[HA] Heikin-Ashi Shadow Candles// For overlaying Heikin Ashi candles over basic charts, or for use in it's own panel as an oscillator.
// Enjoy the visual cues of HA candles, without giving up price action awareness.
// Good for learning and comparison.
// Aug 11 2022
Release Notes: * Bugfix: Candle color was based on classic direction not HA direction (did not update cover photo).
// Aug 12 2022
Release Notes: * Implemented true oscillator mode.
Provided as separate plot (styles tab) or mode switch option (Inputs tab). TV gets spazzy with "styles tab" "default hidden" plots, and will reset them if any variables are modified that affect them (i.e. wick color override). Mode switch should be sufficient for both users.
// Aug 21 2022
Republished because of typo in indicator name prevented search.

Fisher Transform of MACD w/ Quantile Bands [Loxx]Fisher Transform of MACD w/ Quantile Bands is a Fisher Transform indicator with Quantile Bands that takes as it's source a MACD. The MACD has two different source inputs for fast and slow moving averages.
What is Fisher Transform?
The Fisher Transform is a technical indicator created by John F. Ehlers that converts prices into a Gaussian normal distribution.
The indicator highlights when prices have moved to an extreme, based on recent prices. This may help in spotting turning points in the price of an asset. It also helps show the trend and isolate the price waves within a trend.
What is Quantile Bands?
In statistics and the theory of probability, quantiles are cutpoints dividing the range of a probability distribution into contiguous intervals with equal probabilities, or dividing the observations in a sample in the same way. There is one less quantile than the number of groups created. Thus quartiles are the three cut points that will divide a dataset into four equal-size groups (cf. depicted example). Common quantiles have special names: for instance quartile, decile (creating 10 groups: see below for more). The groups created are termed halves, thirds, quarters, etc., though sometimes the terms for the quantile are used for the groups created, rather than for the cut points.
q-Quantiles are values that partition a finite set of values into q subsets of (nearly) equal sizes. There are q − 1 of the q-quantiles, one for each integer k satisfying 0 < k < q. In some cases the value of a quantile may not be uniquely determined, as can be the case for the median (2-quantile) of a uniform probability distribution on a set of even size. Quantiles can also be applied to continuous distributions, providing a way to generalize rank statistics to continuous variables. When the cumulative distribution function of a random variable is known, the q-quantiles are the application of the quantile function (the inverse function of the cumulative distribution function) to the values {1/q, 2/q, …, (q − 1)/q}.
What is MACD?
Moving average convergence divergence ( MACD ) is a trend-following momentum indicator that shows the relationship between two moving averages of a security’s price. The MACD is calculated by subtracting the 26-period exponential moving average ( EMA ) from the 12-period EMA .
Included:
Zero-line and signal cross options for bar coloring, signals, and alerts
Alerts
Signals
Loxx's Expanded Source Types
35+ moving average types

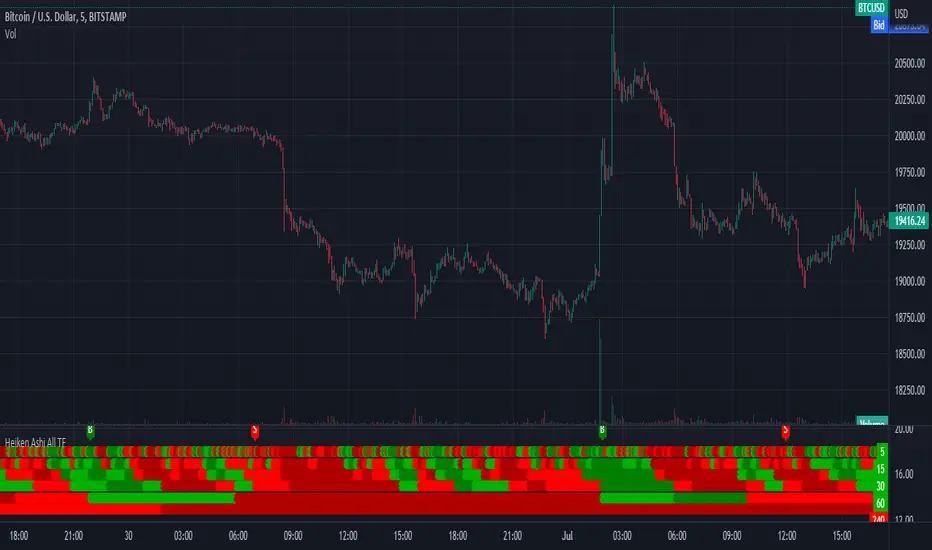
Heiken Ashi All TFI have always fighted to understand the market direction because it looks different on different timeframes.
I wanted an indicator where I can see all the different timeframes at once.
This indicator shows the Heiken Ashi candle colors for different time frames at once.
Use it on the 5 Minute timeframe.
4 colors:
dark green: bullis green HA candle with no low shadow.
green: green HA candle.
red: red HA candle
datk red: bearish red HA candle with non existing upper shadow.
the timeframes are by default:
5m 15m 30m 1H 4H 1D
can be adjusted if needed.
signals:
in the top line the Buy / Shell Signals are shown when the selected timeframes are all changed.
for example after a buy signal a sell signal will be printend when all the selected timeframes are turned into red or dark red.
Do not use it as a tranding signal, us it for confirmation.
It doesn't predict. it shows the market's current state.
Don't forget that the latest candles are based on the current value. The higher timeframe candle color depends on the current price.
If the higher timeframe close price so different that the HA candle color changes it reprins for all the affected 5m dots.
Fusion: Heiken Ashi candlesHeiken Ashi is good for cleaning up noise but I don't want it to obscure real price action like all the ones I have come across do.
This very simple indicator just puts Heiken Ashi candles off the main chart so you can see the real price action and the Heiken Ashi version of price action at the same time. I find the dual view far more useful than completely replacing real price action with Heiken Ashi smoothing.
Better Heiken-Ashi Candles w/ Expanded Source Types [Loxx]Better Heiken-Ashi Candles w/ Expanded Source Types is an indicator to compare regular candles to traditional Heiken-Ashi candles to "better" Heiken Ashi candles. This indicator and comparison study appears an oscillator. The purpose of this indicator is to demonstrate a better way to calculate HA candles and also to demonstrate expanded source types. This indicator is meant to be used by advanced Pine Coders who wish to add fine-tuning to their indicators and strategies.
What are Heiken Ashi "better" candles?
The "better formula" was proposed in an article/memo by BNP-Paribas (In Warrants & Zertifikate, No. 8, August 2004 (a monthly German magazine published by BNP Paribas, Frankfurt), there is an article by Sebastian Schmidt about further development (smoothing) of Heikin-Ashi chart.)
They proposed to use the following :
(Open+Close)/2+(((Close-Open)/(High-Low))*ABS((Close-Open)/2))
instead of using :
haClose = (O+H+L+C)/4
According to that document the HA representation using their proposed formula is better than the traditional formula.
What are traditional Heiken-Ashi candles?
The Heikin-Ashi technique averages price data to create a Japanese candlestick chart that filters out market noise.
Heikin-Ashi charts, developed by Munehisa Homma in the 1700s, share some characteristics with standard candlestick charts but differ based on the values used to create each candle. Instead of using the open, high, low, and close like standard candlestick charts, the Heikin-Ashi technique uses a modified formula based on two-period averages. This gives the chart a smoother appearance, making it easier to spots trends and reversals, but also obscures gaps and some price data.
What's going on with this indicator?
- First, we have the options to select the candlestick type: Regular, HA, HA Better
- Next, and to demonstrate the expanded source types, I've added a simple moving average. In the drop down for the SMA source you'll notice something very different from the typical TradingView source selector. Here's how to decode the new names for the sources:
Close = close
Open = open
High = high
Low = low
Median = hl2
Typical = hlc3
Weighted = hlcc4
Average = ohlc4
Average Median Body = (open+close)/2
Trend Biased = (see code, too complex to explain here)
Trend Biased (extreme) = (see code, too complex to explain here)
... for HA and HA better, see the same set up as above but with different open and close values to calcualate the other source types
- For the HA better calculations, we run the close value through either an Adaptive, Kaufman, or T3 smoothing filter. The length for these smoothing filters, either 2 or 3, can be found in the code and is a constant value that shouldn't be changed. This smoothing is in inline with what is described in the article mentioned above
- Lastly, I've placed an SMA over the oscillator so that the user can test out the various sources explained above
Included:
- Toggle on/off bar coloring

Trend Ribbon on Heiken AshiThis indicator shows mini trends using 2 Simple Moving Averages based on Heiken Ashi candles.
This indicator also shows overlay of Heiken Ashi candles, so you can stay on standard candles and see actual price.
This indicator helps finding entries on Heiken Ashi breaking up/down at M1-M5 timeframe.
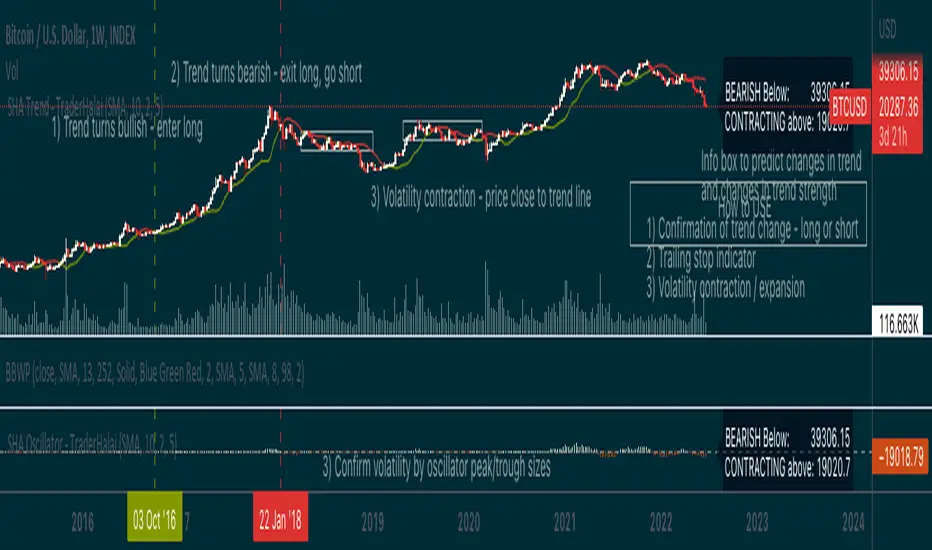
Smoothed Heikin Ashi Trend on Chart - TraderHalaiThis indicator is a predictive tool using Heikinashi to calculate shifts in trade direction.
It works by reverse-engineering the regular candle stick closing price required, to flip the Heiken Ashi candle from Red to Green and vice-versa.
Below, is an earlier indicator that I released and created. This plots this price as an oscillator, which allows traders to get a predictive indicator of a trend change.
This indicator extends upon this functionality by adding a smoothing function to the reverse-engineered regular candle stick closing price, to reduce the choppiness of signals. It also plots the indicator on the chart to allow for easier visual confirmation.
How to use
1) As a directional bias - Bullish or bearish
2) Volatility expansion/contraction - further distance from line means volatility expansion - am planning to release an oscillator version also
3) Trailing stop loss - once you are in a trade
Other Features
Select a moving average period and smoothing calculation method (e.g. SMA / EMA)
Non-repaint mode for backtesting and use/integration with higher timeframes
Final note - Open Source
I am releasing this as open-source for the benefit of the community and to allow further development, scrutiny and criticism. Please feel free to use this indicator as you see fit. If you do use this indicator to create another script, feel free to drop me a note, as I would be highly interested in your idea.
Thanks, and Enjoy!
Heikin Ashi OscillatorThis indicator plots a delta between the Heiken Ashi close price and the regular candlestick closing price as a histogram, which allows you to quickly analyse changes in trend
direction.
It also provides a reverse-engineered closing price for regular candlesticks, to reach in order to maintain the momentum, which allows you to be forewarned of potential pivot points to change in bias in direction.
Feel free to use this indicator to modify and add to your charts as you wish.

Heikin-Ashi Candle ColorOne of the biggest complaints about Heikin Ashi is the lack of real price data you receive. This attempts to give you as much information as possible by displaying both the candle color and the Heikin Ashi color. The wick takes on the original color while the body of the candle gets the Heikin Ashi color. The only downside to this method is that you do not get to see candle patterns. As always I hope you enjoy this release!

Market Bias (CEREBR)Hello Everyone. I hope you are all doing great. It's been a long time since I posted my first script here, and I got a lot of response from that.
So, I thought I should share this script also to everyone, and anyone that may find it useful. Personally, I use it to tell the general market conditions.
Here's how I works : The script tries to determine the overall direction of the market, using smoothed Heiken Ashi candles. The coloring system (using bright and dark colors) is an attempt to detect strong market and weak market conditions. There's also an oscillator within the script, but for now it isn't plotted. Credits to @jackvmk, I used part of his open-script code in this indicator.\
I have considered using the slope of the indicator plot as a filter for ranging market conditions. The plot goes relatively flat in 'flat' markets. However, I have not done anything about that yet. Maybe some other time.
I hope you find this useful. If you find a way to use this, please share it with the community in the comment section.
NOTE: THIS IS BY NO MEANS FINANCIAL ADVICE. You'll have to make your studies and come up with a way to apply this indicator to your trading style and strategy.
By the way, I would be going with the name 'CEREBR' for any subsequent scripts I release from now on.
Happy Trading, guys.

SuperJump Multi Time Frame Heiken Ashi ColorThis is my first public simple script.
It expresses the color of Heiken ashi Candle on a different time chart.
As you already know about it, If you change your chart directly to Heiken ashi, the value of candle changes.
For eaxmple, moving average lines change little by little from Non Heiken ashi Candle.
I was very uncomfortable with this.
If you use this, you can check the Heiken ashi color while using a Non Heiken ashi Candle.

Candles HTF on Heikin Ashi ChartThis script enables calling and/or plotting of traditional Candles sources while loaded on Heikin Ashi charts.
Thanks to @PineCoders for rounding method: www.pinecoders.com
Thanks to @BeeHolder for method to regex normalize syminfo.tickerid.
NOTICE: While this script is meant to be utilized on Heikin Ashi charts it does NOT enable ability to backtest!
NOTICE: For more info on why non standard charts cannot be reliably backtested please see:
NOTICE: This is an example script and not meant to be used as an actual strategy. By using this script or any portion thereof, you acknowledge that you have read and understood that this is for research purposes only and I am not responsible for any financial losses you may incur by using this script!

Smoothed Heiken AshiIt is a Heiken Ashi candle overlay. It has a selectable moving average before HA calculation and another after HA calculation, to smooth original Heiken Ashi candles.
It can be used:
Detecting Short/Long term trend direction
Dynamic support/resistance, not just a line, but it has a height
Trailing stop
Trend reversal detection, when price cross above/below Heiken Ashi candle
A lot of moving averages can be selected to adjust it to the selected market.
It uses my TAExt library, so you can use it in your strategies as well.

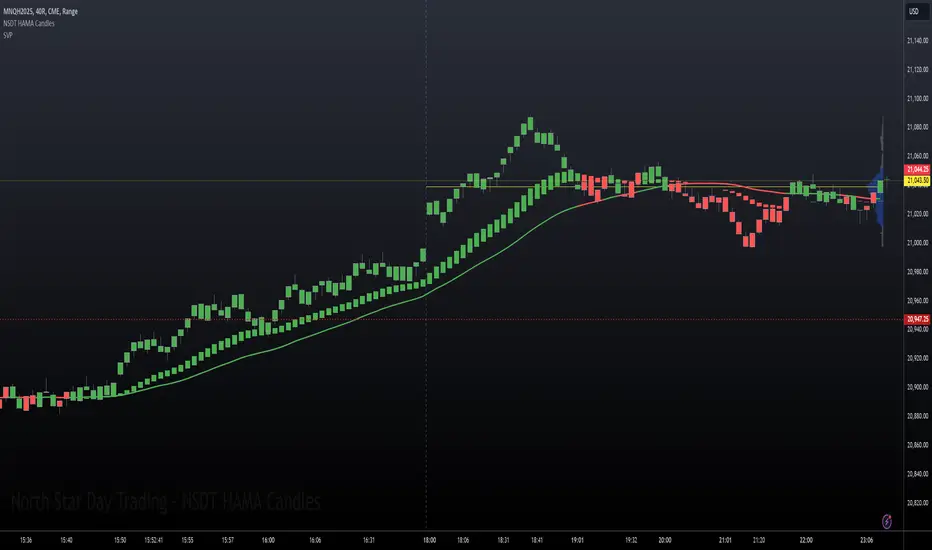
NSDT HAMA CandlesHAMA (Heiken-Ashi Moving Average) Candles are built using different moving average lengths for the open, high, low, and close. Those levels are then run through the Heiken-Ashi Candle formula to create a new hybrid candle on the chart. There is an additional Moving Average plotted as well for overall direction.
This may be used best for identifying trending markets. By referencing the HAMA Candle indicator, it may help guide you to stay in a trade a bit longer, or wait a bit longer before entering at the beginning of a potential trend.
We added a Gradient Color scheme option for a more colorful view of potential trend directional changes. The gradient code is taken from the Pinecoders Gradient Framework (Pro Advance/Decline Gradient example) at
There are three different Moving Average types to choose from. (EMA, SMA, WMA). All MA lengths can be modified. All colors can be modified. All options can be turned on or off.
This was previously an "invite-only" indicator, but we decided to publish it publicly and open source.
Indicator Functions with Factor and HeikinAshiHello all,
This indicator returns below selected indicators values with entered parameters.
Also you can add factorization, functions candles, function HeikinAshi and more to the plot.
VERSION:
Version 1: returns series only source and Length with already defined default values
Version 2: returns series with source, Length, p1 and p2 parameters according to the indicator definition (ex: )
PARAMETERS p1 p2
for defining multi arguments (See indicators list) indicator input value usable with verison=V2 selected.. ex: for alma( src , len ,offset=0.85,sigma=6), set source=source, len=length, p1=0.85 an p2=6
FACTOR:
Add double triple, Quadruple factors to selected indicator (like converting EMA to 2-DEMA, 3-TEMA, 4-QEMA...)
1-Original
2-Double
3-Triple
4-Quadruple
LOG
Log: Use log, log10 on function entries
PLOTTING:
PType: Plotting type of the function on the screen
Original :use original values
Org. Range (-1,1): usable for indicators between range -1 and 1
Stochastic: Convert indicator values by using stochastic calculation between -1 & 1. (use AT/% length to better view)
PercentRank: Convert indicator values by using Percent Rank calculation between -1 & 1. (use AT/% length to better view)
ST/%: length for plotting Type for stochastic and Percent Rank options
Smooth: Use SWMA for smoothing the function
DISPLAY TYPES
Plot Candles: Display the selected indicator as candle by implementing values
Plot Ind: Display result of indicator with selected source
HeikinAshi: Display Selected indicator candles with Heikin Ashi calculation
INDICATOR LIST:
hide = 'DONT DISPLAY', //Dont display & calculate the indicator. (For my framework usage)
alma = 'alma( src , len ,offset=0.85,sigma=6)', // Arnaud Legoux Moving Average
ama = 'ama( src , len ,fast=14,slow=100)', //Adjusted Moving Average
acdst = 'accdist()', // Accumulation/distribution index.
cma = 'cma( src , len )', //Corrective Moving average
dema = 'dema( src , len )', // Double EMA (Same as EMA with 2 factor)
ema = 'ema( src , len )', // Exponential Moving Average
gmma = 'gmma( src , len )', //Geometric Mean Moving Average
hghst = 'highest( src , len )', //Highest value for a given number of bars back.
hl2ma = 'hl2ma( src , len )', //higest lowest moving average
hma = 'hma( src , len )', // Hull Moving Average .
lgAdt = 'lagAdapt( src , len ,perclen=5,fperc=50)', //Ehler's Adaptive Laguerre filter
lgAdV = 'lagAdaptV( src , len ,perclen=5,fperc=50)', //Ehler's Adaptive Laguerre filter variation
lguer = 'laguerre( src , len )', //Ehler's Laguerre filter
lsrcp = 'lesrcp( src , len )', //lowest exponential esrcpanding moving line
lexp = 'lexp( src , len )', //lowest exponential expanding moving line
linrg = 'linreg( src , len ,loffset=1)', // Linear regression
lowst = 'lowest( src , len )', //Lovest value for a given number of bars back.
pcnl = 'percntl( src , len )', //percentile nearest rank. Calculates percentile using method of Nearest Rank.
pcnli = 'percntli( src , len )', //percentile linear interpolation. Calculates percentile using method of linear interpolation between the two nearest ranks.
rema = 'rema( src , len )', //Range EMA (REMA)
rma = 'rma( src , len )', //Moving average used in RSI . It is the exponentially weighted moving average with alpha = 1 / length.
sma = 'sma( src , len )', // Smoothed Moving Average
smma = 'smma( src , len )', // Smoothed Moving Average
supr2 = 'super2( src , len )', //Ehler's super smoother, 2 pole
supr3 = 'super3( src , len )', //Ehler's super smoother, 3 pole
strnd = 'supertrend( src , len ,period=3)', //Supertrend indicator
swma = 'swma( src , len )', //Sine-Weighted Moving Average
tema = 'tema( src , len )', // Triple EMA (Same as EMA with 3 factor)
tma = 'tma( src , len )', //Triangular Moving Average
vida = 'vida( src , len )', // Variable Index Dynamic Average
vwma = 'vwma( src , len )', // Volume Weigted Moving Average
wma = 'wma( src , len )', //Weigted Moving Average
angle = 'angle( src , len )', //angle of the series (Use its Input as another indicator output)
atr = 'atr( src , len )', // average true range . RMA of true range.
bbr = 'bbr( src , len ,mult=1)', // bollinger %%
bbw = 'bbw( src , len ,mult=2)', // Bollinger Bands Width . The Bollinger Band Width is the difference between the upper and the lower Bollinger Bands divided by the middle band.
cci = 'cci( src , len )', // commodity channel index
cctbb = 'cctbbo( src , len )', // CCT Bollinger Band Oscilator
chng = 'change( src , len )', //Difference between current value and previous, source - source.
cmo = 'cmo( src , len )', // Chande Momentum Oscillator . Calculates the difference between the sum of recent gains and the sum of recent losses and then divides the result by the sum of all price movement over the same period.
cog = 'cog( src , len )', //The cog (center of gravity ) is an indicator based on statistics and the Fibonacci golden ratio.
cpcrv = 'copcurve( src , len )', // Coppock Curve. was originally developed by Edwin "Sedge" Coppock (Barron's Magazine, October 1962).
corrl = 'correl( src , len )', // Correlation coefficient . Describes the degree to which two series tend to deviate from their ta. sma values.
count = 'count( src , len )', //green avg - red avg
dev = 'dev( src , len )', //ta.dev() Measure of difference between the series and it's ta. sma
fall = 'falling( src , len )', //ta.falling() Test if the `source` series is now falling for `length` bars long. (Use its Input as another indicator output)
kcr = 'kcr( src , len ,mult=2)', // Keltner Channels Range
kcw = 'kcw( src , len ,mult=2)', //ta.kcw(). Keltner Channels Width. The Keltner Channels Width is the difference between the upper and the lower Keltner Channels divided by the middle channel.
macd = 'macd( src , len )', // macd
mfi = 'mfi( src , len )', // Money Flow Index
nvi = 'nvi()', // Negative Volume Index
obv = 'obv()', // On Balance Volume
pvi = 'pvi()', // Positive Volume Index
pvt = 'pvt()', // Price Volume Trend
rise = 'rising( src , len )', //ta.rising() Test if the `source` series is now rising for `length` bars long. (Use its Input as another indicator output)
roc = 'roc( src , len )', // Rate of Change
rsi = 'rsi( src , len )', // Relative strength Index
smosc = 'smi_osc( src , len ,fast=5, slow=34)', //smi Oscillator
smsig = 'smi_sig( src , len ,fast=5, slow=34)', //smi Signal
stdev = 'stdev( src , len )', //Standart deviation
trix = 'trix( src , len )' , //the rate of change of a triple exponentially smoothed moving average .
tsi = 'tsi( src , len )', //True Strength Index
vari = 'variance( src , len )', //ta.variance(). Variance is the expectation of the squared deviation of a series from its mean (ta. sma ), and it informally measures how far a set of numbers are spread out from their mean.
wilpc = 'willprc( src , len )', // Williams %R
wad = 'wad()', // Williams Accumulation/Distribution .
wvad = 'wvad()' //Williams Variable Accumulation/Distribution
I will update the indicator list when I will update the library
Thanks to tradingview, @RodrigoKazuma for their open source indicators
