Doubled Numbered Square of Nine Progression | RegressionThe Doubled Number Square of Nine Progression | Regression Indicator enables forecasting of support and resistance levels using the SQ9 progression or regression from a user-selected pivot price. The indicator also plots adjustable pivots on both the chart and the Square of Nine.
How to use to forecast support and resistance levels:
1. Select a Pivot Point: Choose a top or bottom pivot to use as the starting point. Select High or Low in the indicator to set the correct price to the pivot.
2. Set Price Increment or Decrement: Select a price increment to advance the starting price on the Square of Nine (for example 1 or -0.01).
3. Rotate to add or decrease the number of rungs on the Square on Nine: Rotate the Square of Nine and adjust the dimensions. The horizontal levels correlate to the rotation of the Square of Nine.
4. Plot Levels: Select a Square of Nine angle to plot the support and resistance levels based on the selected increments. These levels auto expand and decrease depending on the number of rotations in step 3. The price values from each of the selected diagonal or cardinal cross are applied to the chart with labels on both left and right. Left labels represent the cell the time variable and the right label is price.
5. Review Levels: Conduct a simple review of the plotted support and resistance levels in relation to recent market pivots.
6. Identify Correlations: Identify the Square of Nine cardinal cross or diagonal cross angle that correlates with the most market pivots.
7. The indicator plots user-adjustable pivots on both candles/bars and displays their placement on the Square of Nine in both Progression and Regression. The close price is plotted on the Square of Nine in real-time with a white background. This helps users identify which angles the highs and lows favor from the selected pivot. The pivot levels' colors can be adjusted.
Each market has its tendencies, favoring specific angles from the cardinal or diagonal cross. The basic idea is to choose between the diagonal cross and cardinal cross angles to forecast support and resistance levels.
Settings:
Overview:
Example on Forecasting Support and resistance level using this indicator:
In the image above, I'm progressing from the significant low at a rate of $200 per cell. Based on the plotted pivots, I've selected the 315-degree angle on the diagonal cross as it aligns with a few recent pivots. Now, I've drawn a vertical line to show that as we add rungs to the Square of Nine, we introduce support and resistance levels based on the identified angle that aligns with these early pivots from the low.
In the image below, I've moved forward in time to show how the initial angle selected based on the early pivot forecasted support and resistance levels around the high in BTC. Do not expect the price to turn sharply at the levels the indicator generates, but use it to help identify SQ9 levels that may form market turns. As P. Mikula mentions in his work, "The Square of Nine successfully defines market price swings but it does not make the market form pivots."
This indicator includes enhancements made to the Gann Square of Nine indicator originally created by @ThiagoSchmitz.
This indicator is inspired by the methodologies detailed by Patrick Mikula in his book " The Definitive Guide to Forecasting using W.D Gann's Square of Nine ." I recommend checking it out. He also mentions another use case as a Price and Time chart in his " Gann Scientific Method Unveiled, Volume 2 ." FYI, I am not affiliated with Patrick Mikula in any way.
Known Issues:
Close price plotted on the Square of Nine in Regression "from a high pivot" takes a current candle to close in order to be plotted. Progression works as expected.
Gann

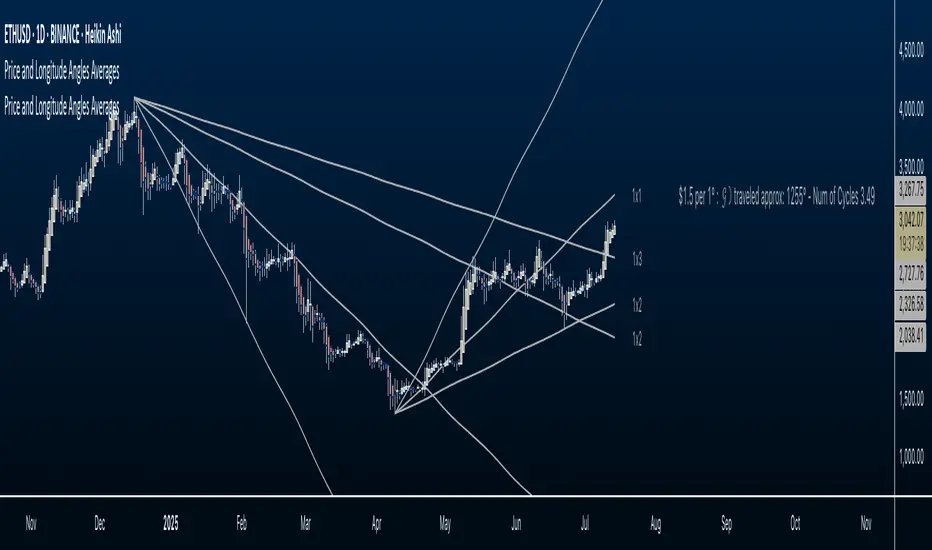
Price and Longitude Angles Planetary Price & Longitude Angles Indicator
This indicator plots planetary price and longitude angles starting from a user-selected date and time, offering a distinctive lens to explore the relationship between price and planetary timing. It supports both heliocentric and geocentric, enabling flexible and in-depth planetary analysis. The angles can be plotted across any time frame for maximum versatility.
How to Use
Once the indicator is loaded, you’ll be prompted to select a starting date and time for your analysis. From there, customize it as follows:
Select Planetary Options:
To plot the price and longitude for a single planet, choose the same planet in both dropdown menus.
To plot the average of two planets, select a different planet in each dropdown.
Set the Price Per Degree of Longitude: Adjust this value to define the scaling of the planetary angles relative to price.
Customize Fan Settings:
Toggle the mirroring of the fan on or off based on your needs.
Show or hide specific angle divisions to tailor the display to your preferences.
Display or conceal the information label that indicates the price per longitude and the number of degrees traveled.
This indicator is inspired by the methodologies of W.D. Gann and Patrick Mikula, expanding on concepts from Gann Scientific Method Unveiled, Volume 2. It was built using Astrolib by @BarefootJoey
I crafted this tool through dedication to support my own study of these ideas. I’m sharing it open-source not only to deepen my understanding and honor the work of Gann and Mikula, but also to invite collaboration. There’s always room for improvement—whether in functionality, accuracy, or design—and I hope others will join me in refining it. This is for those like me: eager to explore these concepts but lacking tools to experiment with. Let’s build on it together.
WD Gann: Vertical Lines for Predefined Days/Bars AgoThis Pine Script draws vertical lines on the chart at specific time intervals, inspired by WD Gann’s theories of time cycles . WD Gann, a famous trader, believed that market movements were influenced by predictable time cycles. This script enables traders to visualize these key time cycles on the chart by placing vertical lines at predefined intervals (in bars ago), helping to identify potential turning points in the market.
The time intervals used in this script are inspired by Gann’s work, as well as astrological and numerological principles , which many traders believe influence market behavior . You can customize which time intervals (such as 3, 7, 9, 21, etc.) you want to track by enabling or disabling specific vertical lines on the chart.
Key Features:
Time Cycles Based on Gann’s Theory: Draws vertical lines at significant time intervals such as 3, 7, 9, 21, 27 bars ago, which are commonly used by Gann traders.
Astrological & Numerological Significance: The predefined intervals also align with key numerological and astrological values, allowing for a broader perspective on market cycles.
Customizable Intervals: You can choose which time intervals to display by enabling or disabling checkboxes for each cycle, allowing flexibility in chart analysis.
Visual Labels: Each vertical line is labeled with its corresponding "bars ago" value, providing clear reference points for the selected time cycles.
What Users Can Do:
Track and analyze market movements based on time cycles that are significant to Gann’s theory, as well as numerological and astrological influences.
Enable or disable vertical lines for specific cycles, like the 3-bar cycle, 9-bar cycle, or 365-bar cycle, depending on the intervals that align with your trading strategy.
Combine with other technical analysis tools and Gann techniques (e.g., Gann Angles, Gann Fans, or Square of Nine) for a more comprehensive trading approach.
This tool is designed for traders who believe in the power of time cycles to influence market behavior, and is especially useful for predicting turning points or key price movements based on these cycles.

WD Gann: Close Price X Bars Ago with Line or Candle PlotThis indicator is inspired by the principles of WD Gann, a legendary trader known for his groundbreaking methods in time and price analysis. It helps traders track the close price of a security from X bars ago, a technique that is often used to identify key price levels in relation to past price movements. This concept is essential for Gann’s market theories, which emphasize the relationship between time and price.
WD Gann’s analysis often revolved around specific numbers that he considered significant, many of which correspond to squared numbers (e.g., 1, 4, 9, 16, 25, 36, 49, 64, 81, 100, 121, 144, 169, 196, 225, 256, 289, 324, 361, 400, 441, 484, 529, 576, 625, 676, 729, 784, 841, 900, 961, 1024, 1089, 1156, 1225, 1296, 1369, 1444, 1521, 1600, 1681, 1764, 1849, 1936). These numbers are believed to represent natural rhythms and cycles in the market. This indicator can help you explore how past price levels align with these significant numbers, potentially revealing key price zones that could act as support, resistance, or reversal points.
Key Features:
- Historical Close Price Calculation: The indicator calculates and displays the close price of a security from X bars ago (where X is customizable). This method aligns with Gann's focus on price relationships over specific time intervals, providing traders with valuable reference points to assess market conditions.
- Customizable Plot Type: You can choose between two plot types for visualizing the historical close price:
- Line Plot: A simple line that represents the close price from X bars ago, ideal for those who prefer a clean and continuous representation.
- Candle Plot: Displays the close price as a candlestick chart, providing a more detailed view with open, high, low, and close prices from X bars ago.
- Candle Color Coding: For the candle plot type, the script color-codes the candles. Green candles appear when the close price from X bars ago is higher than the open price, indicating bullish sentiment; red candles appear when the close is lower, indicating bearish sentiment. This color coding gives a quick visual cue to market sentiment.
- Customizable Number of Bars: You can adjust the number of bars (X) to look back, providing flexibility for analyzing different timeframes. Whether you're conducting short-term or long-term analysis, this input can be fine-tuned to suit your trading strategy.
- Gann Method Application: WD Gann's methods involved analyzing price action over specific time periods to predict future movements. This indicator offers traders a way to assess how the price of a security has behaved in the past in relation to a chosen time interval, a critical concept in Gann's theories.
How to Use:
1. Input Settings:
- Number of Bars (X): Choose the number of bars to look back (e.g., 100, 200, or any custom period).
- Plot Type: Select whether to display the data as a Line or Candles.
2. Interpretation:
- Using the Line plot, observe how the close price from X bars ago compares to the current market price.
- Using the Candles plot, analyze the full price action of the chosen bar from X bars ago, noting how the close price relates to the open, high, and low of that bar.
3. Gann Analysis: Integrate this indicator into your broader Gann-based analysis. By looking at past price levels and their relationship to significant squared numbers, traders can uncover potential key levels of support and resistance or even potential reversal points. The historical close price can act as a benchmark for predicting future market movements.
Suggestions on WD Gann's Emphasis in Trading:
WD Gann’s trading methods were rooted in several key principles that emphasized the relationship between time and price. These principles are vital to understanding how the "Close Price X Bars Ago" indicator fits into his overall analysis:
1. Time Cycles: Gann believed that markets move in cyclical patterns. By studying price levels from specific time intervals, traders can spot these cycles and predict future market behavior. This indicator allows you to see how the close price from X bars ago relates to current market conditions, helping to spot cyclical highs and lows.
2. Price and Time Squaring: A core concept in Gann’s theory is that certain price levels and time periods align, often marking significant reversal points. The squared numbers (e.g., 1, 4, 9, 16, 25, etc.) serve as potential key levels where price and time might "square" to create support or resistance. This indicator helps traders spot these historical price levels and their potential relevance to future price action.
3. Geometric Angles: Gann used angles (like the 45-degree angle) to predict market movements, with the belief that prices move at specific geometric angles over time. This indicator gives traders a reference for past price levels, which could align with key angles, helping traders predict future price movement based on Gann's geometry.
4. Numerology and Key Intervals: Gann paid particular attention to numbers that held significance, including squared numbers and numbers related to the Fibonacci sequence. This indicator allows traders to analyze price levels based on these key numbers, which can help in identifying potential turning points in the market.
5. Support and Resistance Levels: Gann’s methods often involved identifying levels of support and resistance based on past price action. By tracking the close price from X bars ago, traders can identify past support and resistance levels that may become significant again in future market conditions.
Perfect for:
Traders using WD Gann’s methods, such as Gann angles, time cycles, and price theory.
Analysts who focus on historical price levels to predict future price action.
Those who rely on numerology and geometric principles in their trading strategies.
By integrating this indicator into your trading strategy, you gain a powerful tool for analyzing market cycles and price movements in relation to key time intervals. The ability to track and compare the historical close price to significant numbers—like Gann’s squared numbers—can provide valuable insights into potential support, resistance, and reversal points.
Disclaimer:
This indicator is based on the methods and principles of WD Gann and is for educational purposes only. It is not intended as financial advice. Trading involves significant risk, and you should not trade with money that you cannot afford to lose. Past performance is not indicative of future results. The use of this indicator is at your own discretion and risk. Always do your own research and consider consulting a licensed financial advisor before making any investment decisions.

Gann Square of 9Understanding the Gann Square of 9
Delve into the fascinating realm of W.D. Gann’s Square of 9, a tool that has intrigued traders for generations. As we explore the insights behind this unique structure, we’ll show you how our Gann Square of 9 Indicator can become a valuable asset in your trading toolkit.
The History of the Gann Square of 9
The story behind the Gann Square of 9 is as fascinating as the man who created it. W.D. Gann, a pioneering trader from the early 20th century, introduced a method that highlighted the connection between time and price. Rooted in ancient mathematics and geometry, Gann’s theory suggests that financial markets follow cyclical patterns, which are captured in the design of the Square of 9.
Core Principles of the Gann Square of 9
At its heart, the Gann Square of 9 is based on a numerical system that spirals outward from a central point. This unique arrangement allows traders to identify potential support and resistance levels in the market. Each number represents a possible pivot point, indicating shifts in market direction, aligned with Gann’s time-price equilibrium theory.
Applying the Gann Square in Market Analysis
The strength of the Gann Square of 9 lies in its ability to predict key moments in the market where significant price movements may occur. By utilizing our Gann Square of 9 Indicator, traders can easily pinpoint these crucial points, applying Gann’s principles to anticipate both market highs and lows. This section will guide you through practical applications of the Gann Square for making both short-term and long-term trading decisions.
Market Timing with the Gann Square of 9 Indicator
Unlock the potential of market timing and price prediction using our Gann Square of 9 Indicator. This versatile tool brings Gann’s trading insights into the modern world of finance. Here, you’ll find a detailed walkthrough on how to use the indicator to enhance your trading strategies.
Step-by-Step Guide
Input the Source Price: Open, High, Low, Close on specific Timeframe.
Set the Pip Value: Adjust the pip value according to the scale of your trades. The pip value helps define the precision of the price levels the calculator will generate.
Analyze Results: The generated grid displays a central value (your input price) surrounded by numbers representing possible support and resistance levels.
Use the Support and Resistance Levels: Below the grid, you’ll find specific support and resistance points. These are key price levels that can help you plan your trading strategy, such as entry or exit points.
Apply Gann's Trading Entries: At the bottom, suggested long and short trade entries, with targets and stop-loss levels, giving you essential tools for managing risk effectively.
By following these steps, you can effectively incorporate Gann’s time-tested techniques into modern market analysis. Our Gann Square of 9 Indicator simplifies complex calculations while offering powerful insights, helping you make informed trading decisions rooted in one of market analysis’s most influential theories.
Whether you’re new to Gann’s approach or a seasoned trader, this indicator is designed to provide valuable insights aligned with Gann’s original concepts while delivering a seamless user experience for today’s traders. With just a few clicks, you can transform market data into a geometric pattern of time and price, setting the stage for strategic trading based on the cyclical nature of financial markets.

Gann Levels 360
This indicator plots a series of horizontal lines on a chart based on pre-defined levels and the current market price. These levels are believed to be significant for potential support and resistance zones according to the Gann trading methodology.
This code defines a custom indicator that plots a set of Gann levels and dynamically adjusts them based on the current market price. Users can change the line color through the input option.

Historical Swing High-Low Gann IndicatorThe Historical Swing High-Low Gann Indicator is a powerful tool designed to track and visualize key market swing points over time. This indicator identifies significant swing highs and lows within a specified time frame and draws connecting lines between these points, allowing traders to observe the natural ebb and flow of the market.
What sets this indicator apart is its ability to maintain all previously drawn swing lines, creating a comprehensive historical view of market movements. Additionally, the indicator projects Gann-style lines from the most recent swing highs and lows, providing traders with potential future support and resistance levels based on the geometric progression of price action.
Features:
Swing Detection: Automatically detects significant swing highs and lows over a user-defined period (default is 3 hours).
Persistent Historical Lines: Keeps all previously drawn lines, offering a complete visual history of the market's swing points.
Gann-Style Projections: Draws forward-looking lines from the latest swing points to help predict possible future market levels.
Customizable Parameters: Allows users to adjust the swing detection period to suit different trading styles and time frames.
This indicator is ideal for traders who rely on price action, support and resistance levels, and Gann theory for their analysis. Whether used in isolation or as part of a broader strategy, the Historical Swing High-Low Gann Indicator provides valuable insights into the market's behavior over time.

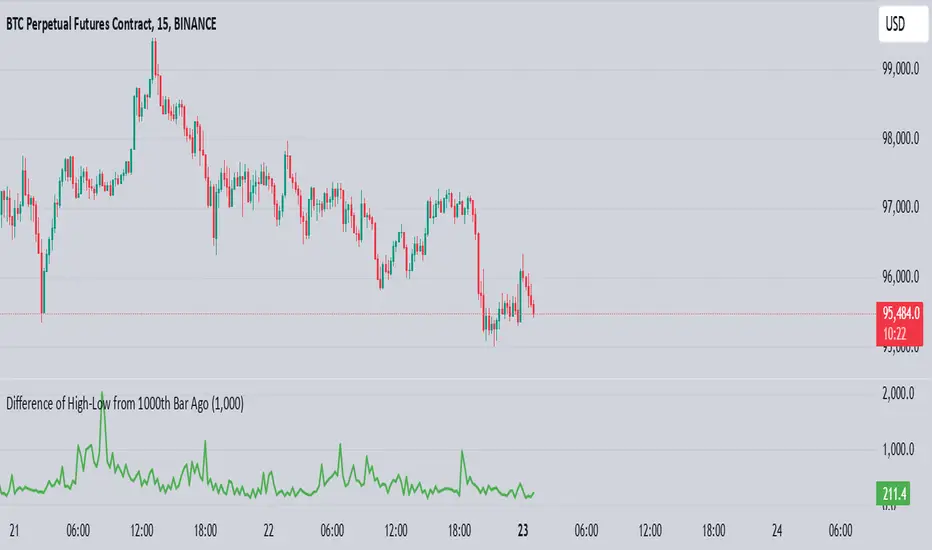
High-Low of X BarOverview
The High-Low of X Bar indicator allows traders to visualize historical high and low values from a specific number of bars ago directly on the chart.
Provides insight into past price action by displaying high, low, and their difference at the most recent bar.
Customizable inputs and color settings for labels enhance usability and visual integration with your chart.
Key Features
Historical Data Analysis: Displays the high, low, and the difference between these values from a specified number of bars ago.
Customizable Inputs: Set the number of bars ago to review historical price points, with a range from 1 to 2000 bars. Premium users can exceed this range.
Dynamic Labeling: Option to show high, low, and difference values as labels on the chart, with customizable text and background colors.
Color Customization: Customize label colors for high, low, and difference values, as well as for cases with insufficient bars.
Inputs
Number of Bars Ago: Enter the number of bars back from the current bar to analyze historical high and low values.
Show High Value: Toggle to display the historical high value.
Show Low Value: Toggle to display the historical low value.
Show Difference Value: Toggle to display the difference between high and low values.
Color Settings
High Label Background Color: Set the background color of the high value label.
High Label Text Color: Choose the text color for the high value label.
Low Label Background Color: Set the background color of the low value label.
Low Label Text Color: Choose the text color for the low value label.
Difference Label Background Color: Set the background color of the difference label.
Difference Label Text Color: Choose the text color for the difference label.
Not Enough Bars Label Background Color: Set the background color for the label shown when there are insufficient bars.
Not Enough Bars Label Text Color: Choose the text color for the insufficient bars label.
Usage Instructions
Add to Chart: Apply the High-Low of X Bar indicator to your TradingView chart.
Configure Settings: Adjust the number of bars ago and display options according to your analysis needs.
Customize Appearance: Set the colors for the labels to match your chart's style.
Analyze: Review the high, low, and their difference directly on your chart for immediate insights into past price movements.
Notes
Ensure your chart has sufficient historical data for the indicator to function properly.
Customize label visibility and colors based on your preference and trading strategy.
GL Gann Swing IndicatorIntroduction
The GL Gann Swing Indicator is a versatile tool designed to help traders identify market trends, support and resistance areas, and potential reversals. This indicator applies the principles of Gann Swing Charts, a technique developed by W.D. Gann, which focuses on market swings to determine the overall direction and turning points of price action. Gann Swing Charts are a time-tested method of technical analysis that simplifies price action by focusing on significant highs and lows, thereby eliminating market noise and providing a clearer view of the trend.
By analyzing price action and determining swing directions and turning points, the indicator filters out market noise using four distinct bar types:
Up Bar: Higher High, Higher Low
Down Bar: Lower High, Lower Low
Inside Bar: Lower High, Higher Low
Outside Bar: Higher High, Lower Low
This approach helps traders to:
Identify the primary trend direction.
Determine key support and resistance levels.
Recognize potential reversal points.
Filter out minor price fluctuations that do not affect the overall trend.
Features
Bar Types: Display bar types by checking the Show Bar Type box in the indicator's settings. Up bars appear as green upward-pointing triangles, down bars as red downward-pointing triangles, inside bars as grey circles, and outside bars as blue diamonds. These visual aids help traders quickly identify the type of bar and its significance.
Break Lines: These lines highlight when the price rises above a previous swing high or falls below a prior swing low. Green lines indicate breaks of swing highs, while red lines indicate breaks of swing lows. Break lines are enabled by default but can be turned off in the indicator's settings. Break lines provide visual confirmation of trend continuation or reversal.
Bar Count: Bar counts help determine if a swing is overextended and if a reversal is likely. This feature is off by default but can be enabled in the indicator's settings. Users can set a minimum bar count to focus on significant swings. Analyzing the number of bars in a swing can help traders gauge the strength and potential exhaustion of a trend.
Swing MA (Moving Averages): This feature plots the average of a user-defined number of previous swing highs and lows. Options are available to add two moving averages, allowing for both fast and slow averages. Swing MAs can be enabled in the indicator's settings. These moving averages smooth out the price data, making it easier to identify the underlying trend direction.
Why This Indicator is Useful
The GL Gann Swing Indicator is particularly useful for several reasons:
Trend Identification: By focusing on significant price swings, the indicator helps traders identify the primary trend direction, making it easier to align trades with the overall market movement.
Noise Reduction: The indicator filters out minor price fluctuations, allowing traders to focus on meaningful market movements and avoid being misled by short-term volatility.
Support and Resistance Levels: By highlighting key swing highs and lows, the indicator helps traders identify crucial support and resistance levels, which are essential for making informed trading decisions.
Potential Reversals: The indicator's ability to identify overextended swings and potential reversal points can help traders anticipate market turning points and adjust their strategies accordingly.
Customizability: With options to display bar types, break lines, bar counts, and swing moving averages, traders can customize the indicator to suit their specific trading style and preferences.
By incorporating Gann Swing principles, the GL Gann Swing Indicator offers traders a powerful tool to enhance their technical analysis, improve their trading decisions, and ultimately achieve better trading outcomes.

Dynamic Gann Levels [XrayTrades]This indicator dynamically captures the highest and lowest points visible on the chart and calculates Gann Support and Resistance Levels. The inputs are detailed below.
Why create this indicator?
There is no other indicator with the same functionality on TradingView.
These calculations are time-consuming; the speed at which this indicator calculates any number of rotations and degrees and visually displays them on the chart is invaluable to me, and hopefully others who use/perform these calculations.
Works on any time frame:
Year, month, week, day, etc. Smaller timeframes (intraday) for higher prices may require adjusting the y-axis of the chart after the calculation of levels due to the nature of squaring numbers.
Inputs:
Resistance: Up (from pivot low) - This toggles on/off levels calculated from the lowest point visible on the chart’s current view.
Support: Down (from pivot high) - This toggles on/off levels calculated from the highest point visible on the chart’s current view.
360 - Toggles on/off the levels of full rotations (360 degrees) from price
180 - Toggles on/off the levels of half rotations (180 degrees) from price
90 - Toggles on/off the levels of quarter rotations (90 degrees) from price
45 - Toggles on/off the levels of eighth rotations (45 degrees) from price
Full Rotations Visible - The number of rotations to be displayed on the chart
How to use this indicator:
Adjust chart window to change the highs and lows.
Select the degrees, direction, and number of rotations in the indicator settings.
The colored values beside the indicator represent the values (high and low) used in generating the Gann levels. Should the cursor be on the chart, ensure it is to the right of the high and low pivots, as this is dynamic in TradingView depending upon cursor location. Note: This is only for the user to know which value(s) are used; cursor position does not impact actual calculations and levels displayed.
The levels will be drawn to the right of the most recent price, labeled with the degrees and direction as well as the price value at the level.
About the calculations:
These calculations are derived from the Natural Square Calculator of Gann Theory, also known as the Square of Nines.
Details:
Take the square root of the selected value (lowest and or highest point).
Add (for up or subtract for down) 0.25 for every 45 degrees of rotation to the desired calculation.
Square this. Round to two decimal places.
Ex: Low of 100. Calculate Gann resistance level for 360 degrees. (√(100)+2)² = 144.
Ex: High of 100. Calculate Gann support level for 180 degrees. (√(100)-1)² = 81.

Gann Box (Zeiierman)█ Overview
The Gann Box (Zeiierman) is an indicator that provides visual insights using the principles of W.D. Gann's trading methods. Gann's techniques are based on geometry, astronomy, and astrology, and are used to predict important price levels and market trends. This indicator helps traders identify potential support and resistance levels, and forecast future price movements.
Gann used angles and various geometric constructions to divide time and price into proportionate parts. Gann indicators are often used to predict areas of support and resistance, key tops and bottoms, and future price moves.
█ How It Works
The indicator operates by identifying high and low points within a visible range on the chart and drawing a Gann Box between these points. The box is divided into segments based on selected percentages, which represent key levels for observing market reactions. It includes options to display labels, a Gann fan, and Gann angles for analysis. Advanced features allow extending the box into the future for predictive analysis and reversing its orientation for alternative viewpoints.
High and Low Points Identification: It starts by locating the highest and lowest price points visible on the chart.
Gann Box Construction: Draws a box from these points and divides it according to specified percentages, highlighting potential support and resistance levels.
█ How to Use
Support and Resistance Levels
Using a Gann angle to forecast support and resistance is probably the most popular way they are used. This technique frames the market, allowing the analyst to read the movement of the market inside this framework.
The lines within the Gann Box, drawn at the key percentages, create a grid of potential support and resistance levels. As prices fluctuate, these lines can act as barriers to price movement, with the price often pausing or reversing at these intervals.
Forecasting with the 'Extend' Feature: The indicator's ability to extend lines and boxes into the future provides traders with a forward-looking tool to anticipate potential market movements and prepare for them.
Gann Fan: This feature draws lines at a significant price angle, helping traders identify potential support and resistance levels based on the theory that prices move in predictable patterns.
Gann Curves: Gann Curves display dynamic support and resistance levels, aiding in the analysis of momentum and trend strength.
█ Settings
The indicator includes several settings that allow customization of its appearance and functionality:
⚪ General Settings
Reverse: This setting changes the orientation of labels and calculations within the Gann Box, providing alternative analytical perspectives. It essentially flips the Gann Box's direction, which can be useful in different market conditions or analysis scenarios.
Extend: Extends the drawing of Gann lines or boxes into the future beyond the current last bar. This feature is essential for forecasting future price movements and identifying potential support or resistance levels that lie outside the current price action.
⚪ Gann Box
Show Box: Toggles the visibility of the Gann Box on the chart. The Gann Box is a fundamental tool in Gann analysis, highlighting key levels based on selected high and low points to identify potential support and resistance areas.
Show Fibonacci Labels: Controls the display of Fibonacci labels within the Gann Box. These labels mark specific Fibonacci retracement levels, aiding traders in recognizing significant levels for potential reversals.
Box Visibility: Allows users to enable or disable individual boxes within the Gann Box, providing flexibility in focusing on specific levels of interest.
Percentage Levels: Defines the Fibonacci levels within the Gann Box. Traders can adjust these levels to customize the Gann Box according to their specific analysis needs.
Coloring: Customizes the color of each level within the Gann Box, enhancing visual clarity and differentiation between levels.
⚪ Gann Fan
Show Fan: Enables the Gann Fan, which draws lines at significant Gann angles from a particular point on the chart, helping identify potential support and resistance levels.
Fan Percentages and Coloring: Similar to the Gann Box, these settings allow traders to customize which Gann angles are displayed and how they are colored.
⚪ Gann Curves
Show Curves: When enabled, this setting draws Gann Curves on the chart. These curves are based on Gann percentages and provide a dynamic view of support and resistance levels as they adapt to changing market conditions.
Curve Percentages and Coloring: Define which curves are displayed and their colors, allowing for a tailored analysis experience.
⚪ Gann Angles
Show Angles: Toggles the display of Gann Angles, which are crucial for understanding the market's price and time dynamics, offering insights into future support and resistance levels.
Coloring: Customizes the color of the Gann Angles, making it easier to differentiate between various angles on the chart.
█ Alerts
The indicator includes several alert conditions for price breakouts from the Gann Box and specific levels, enabling traders to be notified of significant market movements.
-----------------
Disclaimer
The information contained in my Scripts/Indicators/Ideas/Algos/Systems does not constitute financial advice or a solicitation to buy or sell any securities of any type. I will not accept liability for any loss or damage, including without limitation any loss of profit, which may arise directly or indirectly from the use of or reliance on such information.
All investments involve risk, and the past performance of a security, industry, sector, market, financial product, trading strategy, backtest, or individual's trading does not guarantee future results or returns. Investors are fully responsible for any investment decisions they make. Such decisions should be based solely on an evaluation of their financial circumstances, investment objectives, risk tolerance, and liquidity needs.
My Scripts/Indicators/Ideas/Algos/Systems are only for educational purposes!

Astro: Planetary Aspects v2.0I have updated the excellent script originally written by @BarefootJoey with additional functionality as listed below the script's original description:
@BarefootJoey:
In astrology, planetary aspects refer to the angles formed between two or more planets in a horoscope or birth chart. These angles are created by the positions of the planets in the sky and are thought to represent a particular energy or influence that can impact events on Earth.
The most common planetary aspects are the conjunction (when two planets are in the same position in the zodiac), the opposition (when two planets are direct across from each other in the zodiac), the trine (when two planets are 120 degrees apart in the zodiac), and the square (when two planets are 90 degrees apart in the zodiac).
This oscillator plots the current geocentric/heliocentric aspect for up to two planets and features a customizable precision of degree (up to +/- 15 degrees) for each aspect.
Additional functionality added in by @Yevolution:
1. Overlay the indicator plot on top of the main chart, with the indicator's scale placed on the left - I found it easier to spot price reactions at a given planetary aspect vs seeing the plot in a separate frame
2. Add options to plot a vertical bar for every occurrence of chosen aspects
The script source code has remained open and additional comments have been added by me to explain the changes where relevant.
When I get some more spare time I will add a function to enable future planetary aspect events to also be displayed on the chart to make forecasting using this data easier.

Gann Square of 9Here it is, the Gann Square of 9. An easy-to-use tool to determine possible support and resistance levels. Input a starting value to be the starting point of the square. Then the increasing value will be used to get the value of each cell on the table.
It's possible to show the diagonals and a spot number to see what cell value the current price is close to. The diagonals are known to be the key support and resistance levels in Gann's analysis. That way, it's possible to show those diagonals in the chart for easy reading of those levels.

Gann Spiral / Square of 9The Gann Spiral, more commonly known as the Square of 9 is one of the most well known tools that Gann used. Today, it is most commonly used to find possible support and resistance levels, and possible reversals in time.
This indicator is a more flexible version of the traditional Gann Spiral / Square. This is achieved by allowing you to change:
Price and Time direction
The timeframe
How often to draw lines based on degrees
Toggles for Price and Time
Price and Time line customization
How to use:
1 - Select your desired starting value of Price and Time.
2 - Choose the direction of Price and Time.
3 - Choose the amount of lines to display.
4 - Choose how often for lines to be drawn (Rotation Degree Value).
==================================================================
Side Note:
This uses a more proper and more accurate formula to "navigate the square". (Sqr x + 2)^2 is not the formula used, but rather (Sqr x + 1)^2.
If you wish to use the formula you're used to, change Full Revolution Value to 180.
The reasoning behind this formula change is because I re-created the square in the form of an actual spiral. The issue with such a conversion is that the formula used to construct it uses one Pi. If you understand circles, you should know that we're off by 180 degrees. A full rotation is 360, not 180.
Correcting for this error requires a slight but important change in the formula, that being +1 instead of +2. This not only corrects it to fit for a proper spiral, but also makes it easier to use fractions. 1/360 results in 1 degree. This slight formula change makes it incompatible when used on the actual Square of 9, however it is technically the more accurate formula.

Gann Square This indicator build by Gann Square of 19.
you select start and end of big trend in daily timeframe and calculate date range.
by draw trend line in Gann square and enter the numbers cross by line in settings input you could recognize future pivot points
remember : first) this tool worked only in daily timeframe. second) better using this in dark theme :)
chart example :
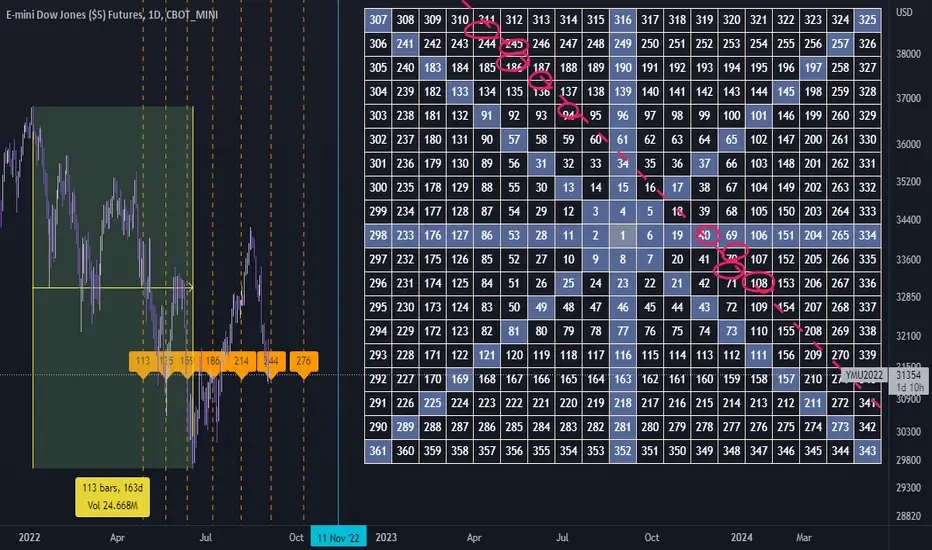
Gann Square of 144This indicator will create lines on the chart based on W.D. Gann's Square of 144. All the inputs will be detailed below
Why create this indicator?
I didn't find it on Tradingview (at least with open source). But the main reason is to study the strategy and be able to draw it fast. Manually drawing the square is not hard, but moving all together to the right spots and scale was time-consuming.
It has a lot of inputs...
Yes, each square point divisible by 6 has information with some options, so the user can create any configuration he wants. Also, it has the advantage of having the square built in seconds and adjusting itself on each new calculation.
About the inputs
Starting Date
This input will be used when the "Set Upper/Lower Prices and Start Bar Automatically" checkbox is not selected. The indicator will calculate all the line locations on the chart using the selected start date. When selecting this input, change the Manual Max and Min Prices to the better calculation
Manual Max/Min Price
This input will be used when the "Set Upper/Lower Prices and Start Bar Automatically" checkbox is not selected. The indicator will calculate all the line's locations on the chart using these prices
Set Upper/Lower Prices and Start Bar Automatically
Selects if the starting date will be automatically selected by the system or based on the input data. When it's set, the indicator will use the most recent bar as the middle point of the square, using the higher price as the Upper Price and the lowest price as the Lower Price in the latest 72 bars (or more based on the Candles Per Division parameter)
Update at a new bar
When this option is market, the indicator will update all created lines to match the new bar position, together with all the possible new Upper/Lower prices. Let it unchecked to watch the progression of the price while the square remains fixed in the chart.
Top X-Axis
When checked, it will display the labels on the Top of the square
Bottom X-Axis
When checked, it will display the labels on the Bottom of the square
Left X-Axis
When checked, it will display the labels on the left of the square
Right X-Axis
When checked, it will display the labels on the right of the square
Show Prices on the Right Y-Axis
When checked, it will display the prices together with the labels on the right of the square
Show Vertical Divisions
Show the lines that will divide the square into 9 equal parts
Show Extra Lines
Show unique lines that will come from the Top and bottom middle of the square, connecting the center to the 36 and 108 levels
Show Grid
When selected, it will display a grid in the square
Line Patterns
A selector with some options of built-in lines configuration. When any option besides None is selected, it will override the lines inputs below
Numbers Color
Select the color of each number on the Axis
Vertical Lines Color
Select the color of the vertical lines
Grid Color
Select the grid line color
Connections from corners to N
Each corner is represented by 2 characters, so they all fit in a single line
It will indicate where the line starts and where it ends
┏ ↓ = Top Left to Bottom
┏ → = Top Left to Right
┗ ↑ = Bottom Left to Top
┗ → = Bottom Left to Right
┓ ← = Top Right to Left
┓ ↓ = Top Right to Bottom
┛ ← = Bottom Right to Left
┛ ↑ = Bottom Right to Top
Besides selecting what line will be created, it's possible to select the color, the style, and the extension
How to use this indicator
When you dig into Gann's books for more information about the square of 144, you find that it was part of his setup with multiple indicators (technical and fundamental, and astrological). It is not a "one indicator" setup, so it's hard to say that you will find entries, exits, stop loss, and take profit in this. Still, it will help see trendiness, support, and resistance levels.
Mixing this with other indicators is probably a good idea, but some may find this indicator the only one needed.
Some aspects of the square
The end of the square is important, so where it starts is crucial. The end is important because it is where the price and time expire. The other parts of the square are defined based on their start and end, so placing them right is essential.
So, where to set the start of the square?
The last major low is the most indicated. The minimum price will be the lowest, and the max price will be the last major Top. Note that the indicator uses 1 candle on each point.
After finding the start, the minimum, and the maximum prices for the square, it will draw all lines. Another essential part of the square is The Midpoint.
The midpoint is the most crucial part of the square and is the best way to see if you positioned the square correctly. When the price is inside the square, using the starting candle as the start, a second higher low or a lower high occurs in that spot. When using the Vertical lines in the indicator, it's the middle square inside Gann's square.
The other divisions will be opposing each other most of the time. So if the price is rising in the 1/3 of the square, it's common to see the price fall in the 3/3 of the square.
More information about these aspects here
Considerations
This indicator was meant for price targets and a time calculator for possible support/resistances in the chart. It was created by William Delbert Gann and was part of his setup for trading almost a century ago. The lines will form geometric figures, which Gann used with high accuracy to predict tops/bottoms and when they would occur.

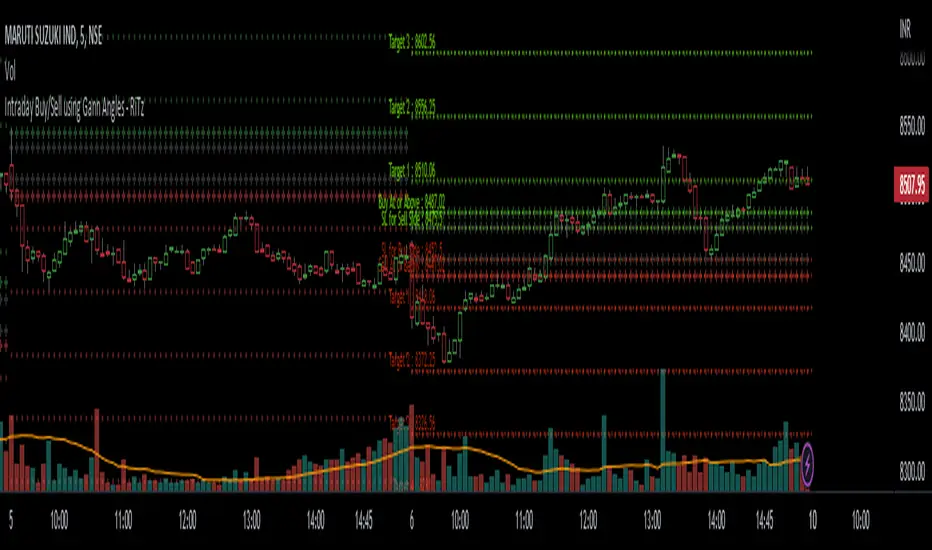
Intraday Buy/Sell using Gann Angles - RiTzIntraday Buy/Sell Levels using Gann Angles based on Todays Open/previous Day High/Low/Close prices
How to use this :
The Buy/Sell levels will be calculated on 1 of 4 things (you can choose any one which you prefer)
1. Todays Open price
2. Previous Day High
3. Previous Day Low
4. Previous Day Close
The Buy/Sell levels will be displayed in these ways
1. In a Table
2. on the Chart
You can turn them on/off according to your preference!
I can't seem to find the original documentation or a link to it.
i have it's excel file, in which we have to enter following data :
1. Todays Open price
2. Previous Day High
3. Previous Day Low
4. Previous Day Close
and the buy/sell levels are calculated by using the above data in following manner :
Based On Today's Opening Price
(lets call it TDO)
Degree's````````````````` Degree Factor```````````````````````` Buy````````````````````````` Sell
11.25```````````````````` =degree/180=11.25/180=0.0625````````` =(sqrt(TDO)-0.0625)^2``````` =(sqrt(TDO)+0.0625)^2````` SL
22.5````````````````````` =degree/180=22.5/180=0.125``````````` =(sqrt(TDO)+0.125)^2```````` =(sqrt(TDO)-0.125)^2`````` Buy/Sell At
45``````````````````````` =degree/180=45/180=0.25`````````````` =(sqrt(TDO)+0.25)^2````````` =(sqrt(TDO)-0.25)^2``````` Target-1
90``````````````````````` =degree/180=90/180=0.5``````````````` =(sqrt(TDO)+0.5)^2`````````` =(sqrt(TDO)-0.5)^2```````` Target-2
135`````````````````````` =degree/180=135/180=0.75````````````` =(sqrt(TDO)+0.75)^2````````` =(sqrt(TDO)-0.75)^2``````` Target-3
180`````````````````````` =degree/180=180/180=1```````````````` =(sqrt(TDO)+1)^2```````````` =(sqrt(TDO)-1)^2`````````` Target-4
225`````````````````````` =degree/180=225/180=1.25````````````` =(sqrt(TDO)+1.25)^2````````` =(sqrt(TDO)-1.25)^2``````` Target-5
270`````````````````````` =degree/180=270/180=1.5`````````````` =(sqrt(TDO)+1.5)^2`````````` =(sqrt(TDO)-1.5)^2```````` Target-6
315`````````````````````` =degree/180=315/180=1.75````````````` =(sqrt(TDO)+1.75)^2````````` =(sqrt(TDO)-1.75)^2``````` Target-7
360`````````````````````` =degree/180=360/180=2```````````````` =(sqrt(TDO)+2)^2```````````` =(sqrt(TDO)-2)^2`````````` Target-8
sqrt = square root
TDO = Today's Opening Price
PDH = Previous Days High
PDL = Previous Days Low
PDC = Previous Days Close
Based On Previous Days High Price
(lets call it PDH)
Degree's````````````````` Degree Factor```````````````````````` Buy````````````````````````` Sell
11.25```````````````````` =degree/180=11.25/180=0.0625````````` =(sqrt(PDH)-0.0625)^2``````` =(sqrt(PDH)+0.0625)^2````` SL
22.5````````````````````` =degree/180=22.5/180=0.125``````````` =(sqrt(PDH)+0.125)^2```````` =(sqrt(PDH)-0.125)^2`````` Buy/Sell At
45``````````````````````` =degree/180=45/180=0.25`````````````` =(sqrt(PDH)+0.25)^2````````` =(sqrt(PDH)-0.25)^2``````` Target-1
90``````````````````````` =degree/180=90/180=0.5``````````````` =(sqrt(PDH)+0.5)^2`````````` =(sqrt(PDH)-0.5)^2```````` Target-2
135`````````````````````` =degree/180=135/180=0.75````````````` =(sqrt(PDH)+0.75)^2````````` =(sqrt(PDH)-0.75)^2``````` Target-3
180`````````````````````` =degree/180=180/180=1```````````````` =(sqrt(PDH)+1)^2```````````` =(sqrt(PDH)-1)^2`````````` Target-4
225`````````````````````` =degree/180=225/180=1.25````````````` =(sqrt(PDH)+1.25)^2````````` =(sqrt(PDH)-1.25)^2``````` Target-5
270`````````````````````` =degree/180=270/180=1.5`````````````` =(sqrt(PDH)+1.5)^2`````````` =(sqrt(PDH)-1.5)^2```````` Target-6
315`````````````````````` =degree/180=315/180=1.75````````````` =(sqrt(PDH)+1.75)^2````````` =(sqrt(PDH)-1.75)^2``````` Target-7
360`````````````````````` =degree/180=360/180=2```````````````` =(sqrt(PDH)+2)^2```````````` =(sqrt(PDH)-2)^2`````````` Target-8
Based On Previous Days Low Price
(lets call it PDL)
Degree's````````````````` Degree Factor```````````````````````` Buy````````````````````````` Sell
11.25```````````````````` =degree/180=11.25/180=0.0625````````` =(sqrt(PDL)-0.0625)^2``````` =(sqrt(PDL)+0.0625)^2````` SL
22.5````````````````````` =degree/180=22.5/180=0.125``````````` =(sqrt(PDL)+0.125)^2```````` =(sqrt(PDL)-0.125)^2`````` Buy/Sell At
45``````````````````````` =degree/180=45/180=0.25`````````````` =(sqrt(PDL)+0.25)^2````````` =(sqrt(PDL)-0.25)^2``````` Target-1
90``````````````````````` =degree/180=90/180=0.5``````````````` =(sqrt(PDL)+0.5)^2`````````` =(sqrt(PDL)-0.5)^2```````` Target-2
135`````````````````````` =degree/180=135/180=0.75````````````` =(sqrt(PDL)+0.75)^2````````` =(sqrt(PDL)-0.75)^2``````` Target-3
180`````````````````````` =degree/180=180/180=1```````````````` =(sqrt(PDL)+1)^2```````````` =(sqrt(PDL)-1)^2`````````` Target-4
225`````````````````````` =degree/180=225/180=1.25````````````` =(sqrt(PDL)+1.25)^2````````` =(sqrt(PDL)-1.25)^2``````` Target-5
270`````````````````````` =degree/180=270/180=1.5`````````````` =(sqrt(PDL)+1.5)^2`````````` =(sqrt(PDL)-1.5)^2```````` Target-6
315`````````````````````` =degree/180=315/180=1.75````````````` =(sqrt(PDL)+1.75)^2````````` =(sqrt(PDL)-1.75)^2``````` Target-7
360`````````````````````` =degree/180=360/180=2```````````````` =(sqrt(PDL)+2)^2```````````` =(sqrt(PDL)-2)^2`````````` Target-8
Based On Previous Days Close Price
(lets call it PDC)
Degree's````````````````` Degree Factor```````````````````````` Buy````````````````````````` Sell
11.25```````````````````` =degree/180=11.25/180=0.0625````````` =(sqrt(PDC)-0.0625)^2``````` =(sqrt(PDC)+0.0625)^2````` SL
22.5````````````````````` =degree/180=22.5/180=0.125``````````` =(sqrt(PDC)+0.125)^2```````` =(sqrt(PDC)-0.125)^2`````` Buy/Sell At
45``````````````````````` =degree/180=45/180=0.25`````````````` =(sqrt(PDC)+0.25)^2````````` =(sqrt(PDC)-0.25)^2``````` Target-1
90``````````````````````` =degree/180=90/180=0.5``````````````` =(sqrt(PDC)+0.5)^2`````````` =(sqrt(PDC)-0.5)^2```````` Target-2
135`````````````````````` =degree/180=135/180=0.75````````````` =(sqrt(PDC)+0.75)^2````````` =(sqrt(PDC)-0.75)^2``````` Target-3
180`````````````````````` =degree/180=180/180=1```````````````` =(sqrt(PDC)+1)^2```````````` =(sqrt(PDC)-1)^2`````````` Target-4
225`````````````````````` =degree/180=225/180=1.25````````````` =(sqrt(PDC)+1.25)^2````````` =(sqrt(PDC)-1.25)^2``````` Target-5
270`````````````````````` =degree/180=270/180=1.5`````````````` =(sqrt(PDC)+1.5)^2`````````` =(sqrt(PDC)-1.5)^2```````` Target-6
315`````````````````````` =degree/180=315/180=1.75````````````` =(sqrt(PDC)+1.75)^2````````` =(sqrt(PDC)-1.75)^2``````` Target-7
360`````````````````````` =degree/180=360/180=2```````````````` =(sqrt(PDC)+2)^2```````````` =(sqrt(PDC)-2)^2`````````` Target-8
example based On Today's Opening Price = 4339
Degree's```````` Degree Factor```````` Buy`````````` Sell
11.25``````````` 0.0625``````````````` 4330.77`````` 4347.24```````` SL
22.5```````````` 0.125```````````````` 4355.48`````` 4322.55```````` Buy/Sell At
45`````````````` 0.25````````````````` 4372.00`````` 4306.13```````` Target-1
90`````````````` 0.5`````````````````` 4405.12`````` 4273.38```````` Target-2
135````````````` 0.75````````````````` 4438.37`````` 4240.76```````` Target-3
180````````````` 1```````````````````` 4471.74`````` 4208.26```````` Target-4
225````````````` 1.25````````````````` 4505.24`````` 4175.88```````` Target-5
270````````````` 1.5`````````````````` 4538.86`````` 4143.64```````` Target-6
315````````````` 1.75````````````````` 4572.61`````` 4111.51```````` Target-7
360````````````` 2```````````````````` 4606.48`````` 4079.52```````` Target-8
Note : ignore the '`' , inserted them to fill up the spaces , it was looking very weird!, tried to fix it as much as I can.
Note :- Please correct me if I'm wrong , as I've already mentioned I don't have it's original documentation.
if anyone can find it or already has it then please feel free to share it.
nifty gann & 100 levelsnifty gannlevels with 100 points defference
gann levels with manual entry of cuurent gann level
manual entry of diffeence between two gann levels

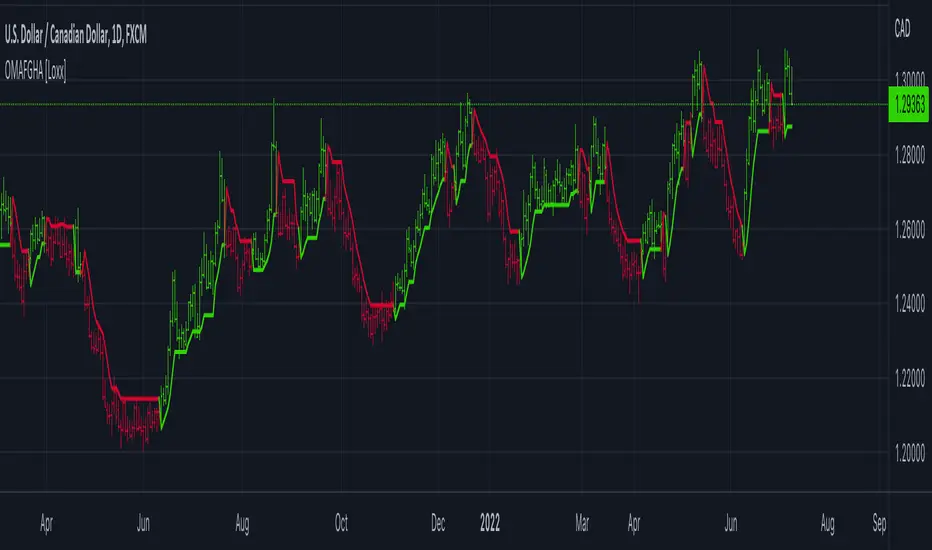
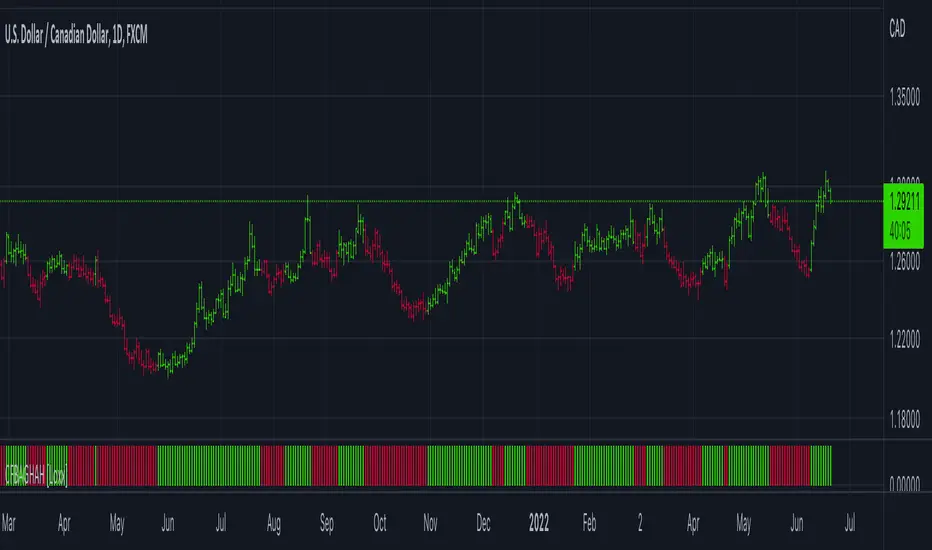
OMA-Filtered, Gann HiLo Activator [Loxx]OMA-Filtered, Gann HiLo Activator is a Gann HiLo activator that uses OMA filtering instead SMA filtering. This GHA calculation also includes a variable for close period to further tune the indicator.
What is Gann HiLo?
The HiLo Activator study is a trend-following indicator introduced by Robert Krausz as part of the Gann Swing trading strategy. In addition to indicating the current trend direction, this can be used as both entry signal and trailing stop.
Here is how the HiLo Activator is calculated:
1. The system calculates the moving averages of the high and low prices over the last several candles. By default, the average is calculated using the last three candles.
2. If the close price falls below the average low or rises above the average high, the system plots the opposite moving average. For example, if the price crosses above the average high, the system will plot the average low. If the price crosses below the average low afterward, the system will stop plotting the average low and will start plotting the average high, and so forth .
The plot of the HiLo Activator thus consists of sections on the top and bottom of the price plot. The sections on the bottom signify bullish trending conditions. Vice versa, those on the top signify the bearish conditions.
Included
-Toggle bar color on/off
Gann Levels For Nifty Gann Levels for nifty 50 is very important to trade in options. so i create 50 gann levels for intraday trading.
CFB Adaptive Gann HiLo Activator Histogram [Loxx]CFB Adaptive Gann HiLo Activator Histogram is a Composite-Fractal-Behavior-adaptive Gann HiLo activator in histogram form that has been smoothed using Jurik Filtering to reduce noise and better identify trending markets. This indicator is the CFB adaptive version of Jurik-Filtered, Gann HiLo Activator .
What is Gann HiLo
The HiLo Activator study is a trend-following indicator introduced by Robert Krausz as part of the Gann Swing trading strategy. In addition to indicating the current trend direction, this can be used as both entry signal and trailing stop.
Here is how the HiLo Activator is calculated:
1. The system calculates the moving averages of the high and low prices over the last several candles. By default, the average is calculated using the last three candles.
2. If the close price falls below the average low or rises above the average high, the system plots the opposite moving average. For example, if the price crosses above the average high, the system will plot the average low. If the price crosses below the average low afterward, the system will stop plotting the average low and will start plotting the average high, and so forth .
The plot of the HiLo Activator thus consists of sections on the top and bottom of the price plot. The sections on the bottom signify bullish trending conditions. Vice versa, those on the top signify the bearish conditions.
What is Composite Fractal Behavior ( CFB )?
All around you mechanisms adjust themselves to their environment. From simple thermostats that react to air temperature to computer chips in modern cars that respond to changes in engine temperature, r.p.m.'s, torque, and throttle position. It was only a matter of time before fast desktop computers applied the mathematics of self-adjustment to systems that trade the financial markets.
Unlike basic systems with fixed formulas, an adaptive system adjusts its own equations. For example, start with a basic channel breakout system that uses the highest closing price of the last N bars as a threshold for detecting breakouts on the up side. An adaptive and improved version of this system would adjust N according to market conditions, such as momentum, price volatility or acceleration.
Since many systems are based directly or indirectly on cycles, another useful measure of market condition is the periodic length of a price chart's dominant cycle, (DC), that cycle with the greatest influence on price action.
The utility of this new DC measure was noted by author Murray Ruggiero in the January '96 issue of Futures Magazine. In it. Mr. Ruggiero used it to adaptive adjust the value of N in a channel breakout system. He then simulated trading 15 years of D-Mark futures in order to compare its performance to a similar system that had a fixed optimal value of N. The adaptive version produced 20% more profit!
This DC index utilized the popular MESA algorithm (a formulation by John Ehlers adapted from Burg's maximum entropy algorithm, MEM). Unfortunately, the DC approach is problematic when the market has no real dominant cycle momentum, because the mathematics will produce a value whether or not one actually exists! Therefore, we developed a proprietary indicator that does not presuppose the presence of market cycles. It's called CFB (Composite Fractal Behavior) and it works well whether or not the market is cyclic.
CFB examines price action for a particular fractal pattern, categorizes them by size, and then outputs a composite fractal size index. This index is smooth, timely and accurate
Essentially, CFB reveals the length of the market's trending action time frame. Long trending activity produces a large CFB index and short choppy action produces a small index value. Investors have found many applications for CFB which involve scaling other existing technical indicators adaptively, on a bar-to-bar basis.
What is Jurik Volty used in the Juirk Filter?
One of the lesser known qualities of Juirk smoothing is that the Jurik smoothing process is adaptive. "Jurik Volty" (a sort of market volatility ) is what makes Jurik smoothing adaptive. The Jurik Volty calculation can be used as both a standalone indicator and to smooth other indicators that you wish to make adaptive.
What is the Jurik Moving Average?
Have you noticed how moving averages add some lag (delay) to your signals? ... especially when price gaps up or down in a big move, and you are waiting for your moving average to catch up? Wait no more! JMA eliminates this problem forever and gives you the best of both worlds: low lag and smooth lines.
Ideally, you would like a filtered signal to be both smooth and lag-free. Lag causes delays in your trades, and increasing lag in your indicators typically result in lower profits. In other words, late comers get what's left on the table after the feast has already begun.
Included
-Toggle bar color on/off
Jurik-Filtered, Gann HiLo Activator [Loxx]Jurik-Filtered, Gann HiLo Activator is a Gann HiLo activator that has been smoothed using Jurik Filtering to reduce noise and better identify trending markets.
What is Gann HiLo
The HiLo Activator study is a trend-following indicator introduced by Robert Krausz as part of the Gann Swing trading strategy. In addition to indicating the current trend direction, this can be used as both entry signal and trailing stop.
Here is how the HiLo Activator is calculated:
1. The system calculates the moving averages of the high and low prices over the last several candles. By default, the average is calculated using the last three candles.
2. If the close price falls below the average low or rises above the average high, the system plots the opposite moving average. For example, if the price crosses above the average high, the system will plot the average low. If the price crosses below the average low afterward, the system will stop plotting the average low and will start plotting the average high, and so forth.
The plot of the HiLo Activator thus consists of sections on the top and bottom of the price plot. The sections on the bottom signify bullish trending conditions. Vice versa, those on the top signify the bearish conditions.
What is Jurik Volty used in the Juirk Filter?
One of the lesser known qualities of Juirk smoothing is that the Jurik smoothing process is adaptive. "Jurik Volty" (a sort of market volatility ) is what makes Jurik smoothing adaptive. The Jurik Volty calculation can be used as both a standalone indicator and to smooth other indicators that you wish to make adaptive.
What is the Jurik Moving Average?
Have you noticed how moving averages add some lag (delay) to your signals? ... especially when price gaps up or down in a big move, and you are waiting for your moving average to catch up? Wait no more! JMA eliminates this problem forever and gives you the best of both worlds: low lag and smooth lines.
Ideally, you would like a filtered signal to be both smooth and lag-free. Lag causes delays in your trades, and increasing lag in your indicators typically result in lower profits. In other words, late comers get what's left on the table after the feast has already begun.
Included
-Toggle bar color on/off

Gann Swing Chart [One-Bar]"Gann used three types of swings chart.
One-Bar Swing Chart (1-Bar Swing Chart): The One-Bar Swing Chart, or Minor Trend Chart, follows the one-bar movements of the market. From a low price, each time the market makes a higher-high than the previous bar, a One-Bar trend line moves up from the recent low to the new high. This action makes the previous low price a One-Bar bottom. From a high price each time the market makes a lower-low than the previous bar, a One-Bar swing line moves down from the recent high to the new low. This action makes the previous high price a One-Bar top.
The combination of One-Bar tops and bottoms forms the One-Bar trend indicator chart. The crossing of a One-Bar swing top changes the One-Bar trend to up. The penetration of a One-Bar swing bottom changes the One-Bar trend to down."
This Indicator only show Gann Swing Chart use One-Bar type.
