Stock Dissect DashboardI developed this script, to help me in my analysis process of Stocks.
In it I have combined several things that I look at when evaluating a company.
First, there is the Macro part, where I have added the most important (at least for me) macro indicators, such as inflation, interest rates, initial jobless claims etc.
Under the last is the latest reported value, next we have the previous, and next to them is the change.
Underneath it is the technical part.
I have added the 1-Week, 1-Month, 3-Month, and 1-Year returns. This way I can easily see the performance of the stock over time.
We have a market regime indicator, which tells us whether the stock is Trending, Mean-Reverting, or Neutral.
Also, I've added the RSI and 50 and 200 Day Moving Averages for additional analysis
At the bottom, I've included some of the fundamentals that I look at in my analysis process. We have the PE and PB ratio, as well as the debt-to-equity and profit margins.
I hope you guys like it and saves you as much time and energy as it did for me.
Happy trading!
Fundamental-analysis

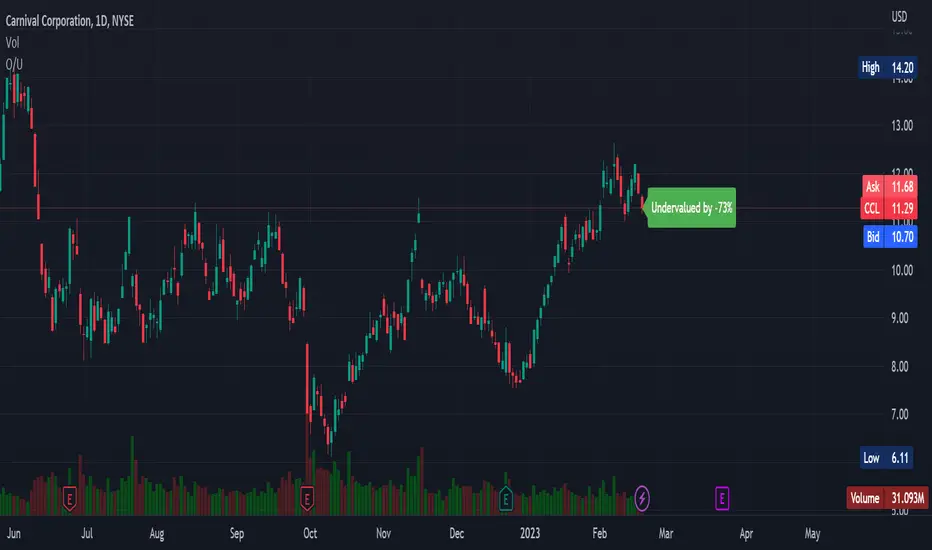
Overvalued/Undervalued OverlayThis indicator will tell you whether the security you are looking at is overvalued or undervalued using a company's total assets and their market cap. In theory, a company's total assets is everything that they own, which then should technically be how much the company is worth. Therefore, if the company's market cap is higher than their total assets, the indicator will read "Overvalued by X%". However, if the company's market cap is lower than their total assets, the indicator will read "Undervalued by X%". If you have any questions, feel free to let me know. Keep in mind that this indicator should be only used for long-term investing.
Financial MetricsGives a sneak peak into some of the important financial ratios described below:
1. P/E : price to earnings ratio (Green when P/E<15)
2. PEG: Price to earnings growth ratio (Green when PEG<1)
3. P/S: Price to sales ratio (Green when P/S<2)
4. EV/FCF: Enterprise Value to Free Cashflow ratio
5. OPM: Operating Profit Margin % (Green when OPM>15%)
6. D/E: Debt to equity ratio (Green when D/E<1)
7. ROE: Return on equity % (Green when ROE>15%)
8. Div_Yield: Dividend yield
Disclaimer: All the limits defined are based on the widely accepted general values, but are subjective to particular sector or group of stocks. For example IT stocks command higher valuation than cyclical stocks like metal. So Compare with other stocks of the same sector to reach any conclusion.

Volume Price and FundamentalsVolume Price and Fundamentals indicators contains 4 exponential moving averages based upon Fibonnaci numbers as period (8, 21, 55 & 144) with crossovers and crossunders.
It also contain a table for volume and 50 Day Avg. Volume, Relative volume, Change in Volume, Volume Value, Up-Down Closing Basis days in last 50 days, Volume ratio (U/D Ratio) on last 50-day Up / Down days and along with fundamental analysis table with various Fundamental Analysis parameters and QoQ & YoY comparison basis for better investment decision making.

Blockchain Fundamentals: 200 Week MA Heatmap [CR]Blockchain Fundamentals: 200 Week MA Heatmap
This is released as a thank you to all my followers who pushed me over the 600 follower mark on twitter. Thanks to all you Kingz and Queenz out there who made it happen. <3
Indicator Overview
In each of its major market cycles, Bitcoin's price historically bottoms out around the 200 week moving average.
This indicator uses a color heatmap based on the % increases of that 200 week moving average. Depending on the rolling cumulative 4 week percent delta of the 200 week moving average, a color is assigned to the price chart. This method clearly highlights the market cycles of bitcoin and can be extremely helpful to use in your forecasts.
How It Can Be Used
The long term Bitcoin investor can monitor the monthly color changes. Historically, when we see orange and red dots assigned to the price chart, this has been a good time to sell Bitcoin as the market overheats. Periods where the price dots are purple and close to the 200 week MA have historically been good times to buy.
Bitcoin Price Prediction Using This Tool
If you are looking to predict the price of Bitcoin or forecast where it may go in the future, the 200WMA heatmap can be a useful tool as it shows on a historical basis whether the current price is overextending (red dots) and may need to cool down. It can also show when Bitcoin price may be good value on a historical basis. This can be when the dots on the chart are purple or blue.
Over more than ten years, $BTC has spent very little time below the 200 week moving average which is also worth noting when thinking about price predictions for Bitcoin or a Bitcoin price forecast.
Notes
1.) If you do not want to view the legend do the following: Indicator options > Style tab > Uncheck "Tables"
2.) I use my custom function to get around the limited historical data for bitcoin. You can check out the explanation of it here:

Inflation Adjusted Performance: Ticker/M2 money supplyPlots current ticker / M2 money supply, to give an idea of 'inflation adjusted performance'.
~In the above, see the last decade of bullish equities is not nearly as impressive as it seems when adjusted to account for the FED's money printing.
~Works on all timeframes/ assets; though M2 money supply is daily data release, so not meaningful to plot this on timeframe lower than daily.
~To display on same pane; comment-out line 6 and un-comment line 7; then save, remove and re-add indicator.
~Scale on the right is meaningless; this indicator is just to show/compare the shape of the charts.

Operating Cash Flow on Total Assets RatioThis indicator divides the company's Operating Cash Flow (TTM) by the company's Total Assets (FY). This ratio gives potential investors the amount of operating cash flow generated from every dollar of asset owned and is a measure of financial efficiency.
BTC Active Address Momentum (On-chain)This indicator shows the difference between the % change in BTC price and the % change in BTC’s active addresses (BTC’s utility value).
- Dark red: Extreme overbought conditions
BTC price is increasing too fast and outgrows the increase in its utility value
(RSI of % change difference > 70)
- Light red: Overbought conditions
BTC price is increasing too fast and outgrows the increase in its utility value
(RSI of % change difference > 60)
- Dark green: Extreme oversold conditions
BTC price is dropping too fast and outruns the decrease in its utility value
(RSI of % change difference < 30)
- Light green: Oversold conditions
BTC price is dropping too fast and outruns the decrease in its utility value
(RSI of % change difference < 40)
*Not financial advice.

BTC Active Address Trend (On-chain)This indicator compares the % change in BTC price and the % change in BTC’s active addresses (BTC’s utility value).
1. % changes in BTC price & active addresses
- Orange line: BTC’s price change (%)
- Gray line: BTC’s active address change (%)
- Red/Yellow/Green lines: Bollinger bands for change in active address
2. Trend:
- Green circles: Bullish Sentiment Trend
Market sentiment is bullish and BTC price outgrows the increase in its utility value (overpricing)
- Red circles: Bearish Sentiment Trend
Market sentiment is bearish and BTC price drops more than the decrease in its utility value (underpricing)
3. Potential Re-Entries:
- Green/Red triangles: potential bullish/bearish entries
When % change of BTC price gets similar to that of active addresses
*Not financial advice.


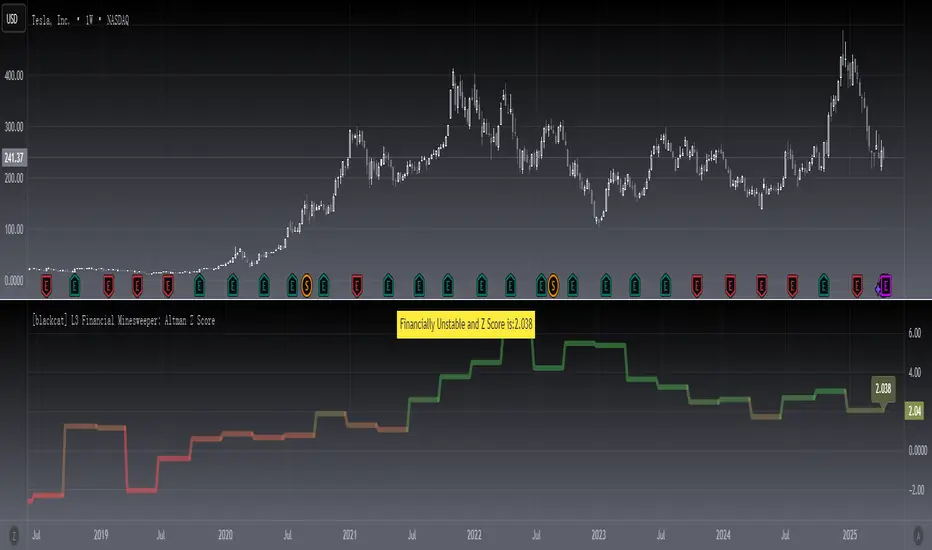
[blackcat] L3 Financial Minesweeper: Altman Z ScoreLevel: 3
Background
The Altman Z-score is the output of a credit-strength test that gauges a publicly traded manufacturing company's likelihood of bankruptcy. The Altman Z-score is a formula for determining whether a company, notably in the manufacturing space, is headed for bankruptcy.
Function
The possibility of financial failure or bankruptcy of the enterprise is analyzed and predicted through the comprehensive score. The lower the Z value, the more likely the enterprise will go bankrupt. By calculating the Z value of an enterprise for several consecutive years, we can find out whether the enterprise has signs of financial crisis. Generally speaking, when the Z value is greater than 2.675, it indicates that the financial situation of the enterprise is good, and the possibility of bankruptcy is small; When the value is less than 1.81, it indicates that the enterprise is in a potential bankruptcy crisis; when the Z value is between 1.81 and 2.675, it is called a "gray area, indicating that the financial situation of the enterprise is extremely unstable.
Remarks
STOCKs ONLY which require financial data.
X1~X5 coefficients can be customized for different stock markets.
Compared to TradingView official Altman Z-Score Indicator.
Feedbacks are appreciated.
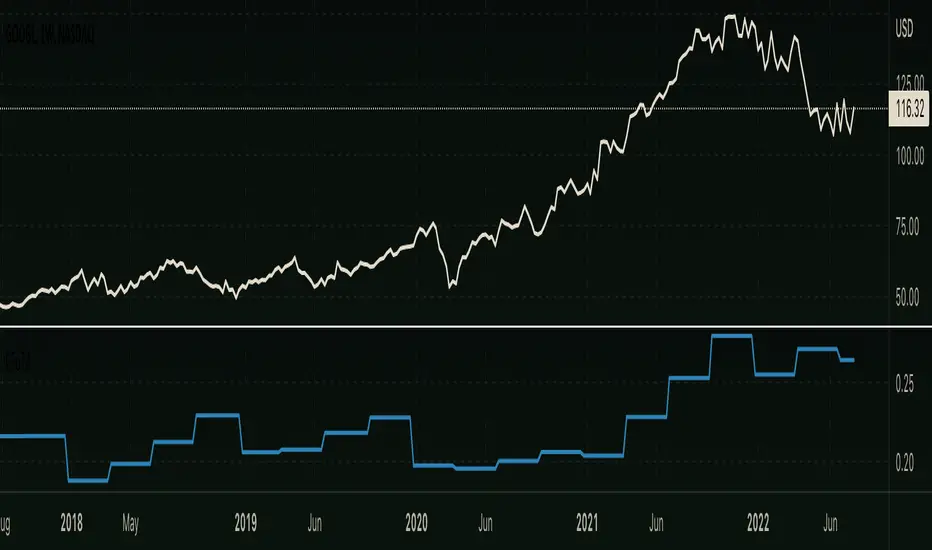
Financial Fundamental Analysis (FFA)- Finansal Temel Analiz (TA)The main purpose of the Fundamental Analysis (TA) indicator; It is to determine whether the rising or falling movements in prices are supported by basic indicators. TA can be used in equity markets. With the financial data transferred to the platform by the companies, the development rates, intrinsic values, true values and expensiveness-cheapness situations of the stocks are estimated. In addition to technical data, it provides an impression of the long-term performance of the stock.
Growth Rate (Blue line): It is a percentage data calculated by focusing on companies' periodic net margin, operating margin and return on equity. It is expected to be higher than 0.2. It symbolizes the possibility of holding and returning cash. It is one of the indicators that the development of the company will be negative or positive in the following periods.
Earnings Per Share (Purple line): It is an important indicator of the sustainability of the company. The periodic increase is expected to be above the inflation figures.
Stock true price (Gray line): Data calculated based on the growth rate. Known book value is recalculated by reflecting the effect of growth rate on earnings per share. In a sense, revaluation is done.
Intrinsic value 1 (red line): It is determined by reevaluating the current price with the growth rate. Whether the value here is too high or too low than the stock price is related to the interest of the sector in which the stock is located.
Intrinsic value 2 (green line): The 50-day average price is determined by reassessing with the growth rate. Whether the value here is too high or too low than the stock price is related to the interest of the sector in which the stock is located.
The desired performance is to remain above 0.2, periodic earnings per share to increase above the inflation rate, and to have a regular increase graph without fluctuations in the stock true price. The fact that intrinsic value 1 crosses intrinsic value 2 is also an increase indicator and acts as an oscillator.
Sudden increases in the stock true price indicate that the stock price will increase in the coming periods. However, the current price of the stock should also be examined with technical indicators.
Temel Analiz (TA) indikatörünün temel amacı; fiyatlardaki yükseliş ya da düşüş hareketlerinin temel göstergelerle desteklenip desteklenmediğinin tespit edilmesidir. TA, hisse pay piyasalarında kullanılabilmektedir. Şirketler tarafından platforma aktarılan finansal veriler ile hisselerin gelişim oranları, içsel değerleri, gerçek ederi ve pahalılık-ucuzluk durumları tahmin edilmektedir. Teknik verilere ek olarak hissenin uzun vadede gösterdiği performansa ilişkin izlenim sunmaktadır.
Büyüme Oranı (Mavi çizgi): şirketlerin dönemsel net marjı, faaliyet marjı ve özkaynak karlılığı üzerine odaklanarak hesaplanmış yüzdesel bir veridir. 0.2’den yüksek olması beklenir. Nakit bulundurma ve döndürme imkânını simgelemektedir. Sonraki dönemlerde şirketin gelişiminin negatif ya da pozitif olacağının göstergelerinden biridir.
Hisse Başı Kazanç (Mor çizgi): Şirketin sürdürülebilirliği hakkında önemli bir göstergedir. Dönemsel artışın enflasyon rakamları üzerinde olması beklenir.
Hisse eder fiyatı (Gri çizgi): Gelişim oranına bağlı olarak hesaplanan veridir. Bilinen defter değeri, gelişim oranının hisse başı kazanç üzerine etkisi yansıtılarak tekrar hesaplanmaktadır. Bir anlamda yeniden değerleme işlemi yapılmaktadır.
İçsel değer 1 (kırmızı çizgi): Mevcut fiyatın gelişim oranı ile tekrar değerleme yöntemiyle belirlenmesidir. Buradaki değerin hisse eder fiyatından aşırı yüksek ya da aşırı düşük olması hissenin bulunduğu sektörün çektiği ilgi ile alakalıdır.
İçsel değer 2 (yeşil çizgi): 50 günlük ortalama fiyatın gelişim oranı ile tekrar değerleme yöntemiyle belirlenmesidir. Buradaki değerin hisse eder fiyatından aşırı yüksek ya da aşırı düşük olması hissenin bulunduğu sektörün çektiği ilgi ile alakalıdır.
Gelişim oranının 0.2 üzerinde kalması, dönemsel hisse başı kazancın enflasyon oranı üzerinde artış göstermesi, hisse eder fiyatın dalgalanmalar göstermeden düzenli bir artış grafiğine sahip olması istenen performanstır. İçsel değer 1‘in içsel değer 2’yi yukarı kesmesi aynı zamanda bir artış göstergesi olup osilatör görevi görmektedir.
Hisse eder fiyatındaki ani yükselişler gelecek dönemlerde hisse fiyatının da artacağını göstergesi olmaktadır. Ancak hissenin mevcut fiyatı aynı zamanda teknik göstergelerle de incelenmelidir.

S&P 500 Earnings Yield SpreadThis indicator compares the attractiveness of equities relative to the risk-free rate of return, by comparing the earnings yields of S&P 500 companies to the 10Y treasury yields. "Earnings yield" refers to the net income attributable to shareholders divided by the stock's price - effectively the inverse of the PE ratio. The tangible meaning of this metric is "the annual income received by (attributable to) shareholders as a percent of the price paid to receive said income." Therefore, earnings yield is comparable to bond yields, which are "the annual income received by bond holders as a percent of the price paid to receive said income."
This indicator subtracts the earnings yield of S&P 500 companies from the current 10-year treasury bond yield, creating a "spread" between the yields that determines whether equities are currently an attractive investment relative to bonds. That is, if the S&P 500 earnings yield exceeds the 10Y treasury yield, then equity investors are receiving more attributable income per dollar paid than bondholders, which could be an indication that equities are an attractive purchase relative to the risk-free rate. The same applies vice-versa; if the 10Y treasury yield exceeds that of the S&P 500 earnings yield, then equities may not be an attractive investment relative to the risk-free rate.
Since data on S&P 500 companies' earnings yields are pulled on a monthly basis, this indicator should be used on a monthly timeframe or longer. Historical data has shown that the critical zones for the indicator are at -4% and +3%, i.e. when equities are trading with a 4% greater yield than 10Y T-bonds and when equities are trading with a 3% lower yield than 10Y T-bonds, respectively. In the "Oversold" case (-4%), equities are trading at a steep discount to the risk-free rate and has often represented a strong buying opportunity. In the "Overbought" case (+3%), equities are trading at a premium to the risk-free rate, which may be an indication that caution should be exercised within the stock market. When the indicator first crosses into "Oversold" territory, this has historically been near a the bottom of a crash on the S&P 500. When the indicator first crosses into the "Overbought" territory, this has often precipitated a correction of 15% on the S&P 500.
Some notable "misses," crashes that this indicator missed, include the 1973 stock market crash and the 2008 global recession. However, both of these cases were largely precipitated by unprecedented economic events, as opposed to stocks simply being "Overbought" relative to treasury yields. Nonetheless, this indicator should form only a small portion of your fundamental analysis, as there are many macroeconomic factors that could lead to major corrections besides the impact of treasury yields. Furthermore, it should also be noted that since markets are "forward looking," future earnings growth or interest rate hikes may become "priced into" both the stock and bond markets, affecting the outputs of this indicator. However, since both the stock and bond markets should account for these factors simultaneously, the impact has historically been minimized.
I hope you find this indicator to be beneficial to your strategies. Stay safe, and happy trading.

Financials Index ComboFinancials Index Combo includes 2 languages Vietnamese and English:
Note the abbreviations:
Rev: Total revenue (Diluted EPS)
Gross: Gross profit
OI: Operating Income
C: Deferred Income, Current
N: Deferred Income, Non-Current
INV: Total inventories (Inventory turnover)
TAS: Total assets (Asset turnover)
Ev/Ed: Enterprise value to EBITDA ratio
ROIC: Return on invested capital
ROA: Return on assets
ROE: Return on equity
TA: Return on tangible assets
TE: Return on tangible equity
G: Sustainable growth rate
FCO: Cash From Operating Activities
FCF: Free Cash Flow
D: Debt to equity ratio
L: Long term debt to total assets ratio
E: Debt to EBITDA ratio
M: Current ratio
S: Sloan ratio -10 -> 10 --> safe zone
H: Fulmer H <0 --> struggling with its finances
>0 --> stable condition
F_score: Piotroski F-score 0 - 9
TCA: Total Current Assets
Rev/TCA: Total revenue to Total Current Assets ratio
Graham: Graham's number
NCAVPS: Net current asset value per share
Convert to billions:
Real Time Table:
Quarterly or annual financial statements
Financials Index For Bank:

Financial Intelligent Eval [Fundamental] (MYTRIC)█ OVERVIEW
Financial Algorithm is a system to quickly understanding company fundamental, and judge the company type based on their financial condition.
All evaluation from the system is the result of combination with Balancing Calculation and Company Historical Financial Data(Financial Report) by using over than 30 financial ratios.
This indicator are classified into 5 level (Very Weak, Weak, Moderate, Good, Excellent)
Advantages of Financial Algorithm
• By combining and calculating company's latest 4 quarterly report, provide rating to help investor quickly know about company's fundamentals and financial performance.
• Able to identify company have what kind of strength, weakness, chance and threat. For instance, according to current economic situation, is it an advantages or a threat for a company, investor can identify it via Financial Algorithm.
• Able to identify which company have better business management by keep following the company rating, observe the improvement level of company's.
Application
*When notice there are not improvement on a company's fundamentals or financial performance which is profitable without further developing, it usually reveals the lack of management capability to generate more value, company unable to fully utilise its profit, reinvest and expanding its business to become more competitive. Sometimes this kind of company may be suspected accounting fraud.
█ BENEFITS
• Avoid investing in companies suspected of financial fraud.
• To quickly understanding company's fundamental and financial structure.
• Able to analyze whether the company build profit after it is used to optimize the company's internal
█ FEATURES
You can configure the following attributes of the display:
• Table position on your chart.
• The size and colour of text.
• Language between English and Chinese.
• Rating bar chart colour.
• On / Off Statement Review Helper Function
• On / Off 3 Years Evaluation Function
• On / Off Basic Information
• Full descriptions of each evaluation and content are included in the settings
█ LIMITATIONS
• When changing the indicator's inputs, allow around 20 seconds calculation for the change to be reflected in the display.
• This system only able to evaluate non-financial industry.
• This system is based on company's historical financial report data to generate the results and rating, it does not includes prediction from any external factor.
(External Factor: Business Model, Business Distribution & Geography, Corporate Structure, Competitor and Peer company's, Prospect, Costing Breakdown, Disaster and etc)
• Any results calculated by this system all is based on data provided by Tradingview, Data may have some tolerance, we recommend that users pay attention to the official quarterly/annual report.
█ FINANCIALS INTELLIGENT ALGORITHM FUNCTION
This lists all combination calculate financials.
01. Total Revenue
02. Earnings before interest and tax
03. Net Income
04. Property, Plant, and Equipment
05. Total Receivables
06. Cash and short-term Investments
07. Cash & Cash equivalents
08. Total Liability
09. Working Capital
10. Total Debt
11. Total Equity
12. Retained Earnings
13. Total Asset
14. Cash From Operating Activities
15. Income before extraordinary items
16. Total depreciation and amortization
17. Free Cash Flow
18. Altman Z-score
19. Cash to Debt Ratio
20. Current Ratio
21. Debt to Assets Ratio
22. Debt to Equity ratio
23. EBITDA Margin
24. Free Cash Flow Margin
25. Grahams Number
26. Net Margin
27. Price Book Ratio
28. Piotroski-F Score
29. Quick Ratio
30. Return on Assets
31. Return on Equity
32. Return on Invested Capital
33. Float Shares Outstanding
34. Total Common Shares Outstanding
35. Cash to Revenue
36. Cash to Market Capital
37. Cash to Debt
38. Receivable Turnover
39. Quality of Earning
40. Market Capital
8 financial evaluation :
3 years financial evaluation tracking :
Statement Review Helper :
█ HOW TO MAKE THE RIGHT INVESMENT OR TREND TRADING DECISION BASED ON OUR EVALUATION
Avoid mid/long term invest in companies with poor financial evaluation, only suite for trend trading. The below following assessments need to be focused.
• Comprehensive rating is poor or below.
• Quality of Earning is very poor or below.
• Receivability is very poor or below (Total Receivable is too high)
• Before : Poor Financial Strength with revenue growth
• After : The price dropped by about -80% within 2 months
███████████████████████████████████████████████████████████████████████████████████████████
• Before : Poor Financial Strength with revenue growth
• After : The price dropped by about -90% within 1 year
███████████████████████████████████████████████████████████████████████████████████████████
• Before : Excellent Financial Strength
• After : Steady growth
Steady growth
• Conclusion :
Do not judge it as a good company just because it has continuous income.
When we analyze the company's financial report, we should not only look at the company's revenue,
we should pay more attention to the company's finances and weaknesses.
Only companies with strong financial strength that can expand their business in a stable manner.
Disclaimer :
*The following conclusion are purely based on my personal opinions and views, it’s only for study and research, without any trading and investment advice.

Key Financials on ChartA simple table with a couple of key financials
The metrics are (top to bottom and left to right):
- Market cap
- P/S-ratio and forward P/S-ratio
- P/E-ratio and P/FCF-ratio
- Debt/Equity and Assets/Equity ratios
- Price/Book-ratio and Operating Margin
- Pietrosky F-Score and current Dividend Yield
should be enough to get a first idea about fundamentals of growth or value-stocks...

TradingGroundhog - Fundamental Analysis - Multiple RSI Ema(Script Available Version of my previous Fundamental Analysis - Multiple RSI Ema )
As the number of crypto currencies is expanding, we need to find the one which will boom in the next months, weeks or even days.
Therefore, I present to you a Fundamental Analysis tool based on RSI built in order to compare the RSI between the diverse cryptocurrencies.
When cryptocurrencies start to trend, become active, minable and especially "buyable", people are investing their money into them.
As a result,the Daily RSI rises and the price of the crypto in question increases steadily.
With "Fundamental Analysis - Multiple RSI EMA" you can :
Follow up to 20 RSI from different exchanges at the same time.
Find easily Increasing/Decreasing RSI as the lines get transparent if their RSI decrease.
You can also select market with high potential of booming as :
Booming Market : 60 < Daily RSI <= 100 (Strong green background)
Potent Market : 55 < Daily RSI <= 60 (Light green background)
Sleepy Market : 50 < Daily RSI <= 55 (Light red background)
Dying Market : 0 < Daily RSI <= 50 (Strong red background)
Futur booming crypto will go from the Potent Market to the Booming Market
Can be used with the following time frames depending on the necessity:
4H
Daily (Preferred)
Weekly
Monthly
Good trades !
Disclaimer (As it should always be one to any script)
***
This script is intended for and only to be used for personal purposes only. No such information provided by it constitutes advice or a recommendation for any investment or trading strategy for any specific person. There is no guarantee presented or implied as to the accuracy of specific forecasts, projections, or predictive statements offered by the script. Users of the script agree that its original developer does not take responsibility for any of your investment decisions. Please seek professional advice before trading.
***

Fundamental Analysis - Multiple RSI EMAAs the number of crypto currencies is expanding, we need to find the one which will boom in the next months, weeks or even days.
Therefore, I present to you a Fundamental Analysis tool based on RSI built in order to compare the RSI between the diverse cryptocurrencies.
When cryptocurrencies start to trend, become active, minable and especially "buyable", people are investing their money into them.
As a result,the Daily RSI rises and the price of the crypto in question increases steadily.
With "Fundamental Analysis - Multiple RSI EMA" you can :
Follow up to 20 RSI from different exchanges at the same time.
Find easily Increasing/Decreasing RSI as the lines get transparent if their RSI decrease.
You can also select market with high potential of booming as :
Booming Market : 60 < Daily RSI <= 100 (Strong green background)
Potent Market : 55 < Daily RSI <= 60 (Light green background)
Sleepy Market : 50 < Daily RSI <= 55 (Light red background)
Dying Market : 0 < Daily RSI <= 50 (Strong red background)
Futur booming crypto will go from the Potent Market to the Booming Market
Can be used with the following time frames depending on the necessity:
4H
Daily (Preferred)
Weekly
Monthly
Good trades !
Disclaimer (As it should always be one to any script)
***
This script is intended for and only to be used for personal purposes only. No such information provided by it constitutes advice or a recommendation for any investment or trading strategy for any specific person. There is no guarantee presented or implied as to the accuracy of specific forecasts, projections, or predictive statements offered by the script. Users of the script agree that its original developer does not take responsibility for any of your investment decisions. Please seek professional advice before trading.
***

© AlpHay : SECURITY FUNDAMENTAL TABLE// Equity Fundamental Data Report Table:
// Data Provider: Tradingview
// I am not a financial advisor or expert.
// This is my interpretation of this data. Consider this data doesn't represent the whole picture of what is going on!
// If you find some fundamentally wrong thinking about this approach, please inform me.
// I am open to suggestions. I am also looking for answers.
// Use it with a daily timeframe for data consistency.
// You can change or customize the threshold values whatever you want.
// www.tradingview.com

Percentile - Price vs FundamentalsThis is done in the same lines of below scripts
Drawdown-Price-vs-Fundamentals
Drawdown-Range
Instead of using drawdown, here we are only plotting percentile of drawdown. Also added few more fundamental stats to the indicator. Also using part of the code from Random-Color-Generator/ to automatically generate colors. This in turn uses code from @RicardoSantos for convering color based on HSL to RGB
This is how the study can be used:
Study plots percentile of price and each of the listed fundamentals based on history. History can be chose All time or particular window. If any fundamental or price is near 100 - which means it is nearer to its peak. And if something is near its bottom, it is nearer to its 0th percentile.
Price of the stock is considered undervalued based on historical levels when it is below most of the fundamentals. Price is considered overvalued based on historical levels when it is above all the fundamentals. Please note, being undervalued does not guarantee immediate mean reversion. Stocks can stay undervalued for prolonged time and can go further down. Similarly overvalued stock can stay overvalued for prolonged time before correcting itself or justifying the position. Hence, further discretion needs to be used while using this study.
Few examples:
AMZN seems to be trading in range and so are the fundamentals:
MSFT at peak along with half of the fundamentals. But, debt levels are going up along with margins reducing.
LPX is trading at 15% discount whereas most of the fundamentals are at the peak.
FLGT price seems to have gone down further whereas fundamentals look pretty healthy.

Drawdown RangeHello death eaters, presenting a unique script which can be used for fundamental analysis or mean reversion based trades.
Process of deriving this table is as below:
Find out ATH for given day
Calculate the drawdown from ATH for the day and drawdown percentage
Based on the drawdown percentage, increment the count of basket which is based on input iNumber of ranges . For example, if number of ranges is 5, then there will be 5 baskets. First basket will fit drawdown percentage 0-20% and each subsequent ones will accommodate next 20% range.
Repeat the process from start to last bar. Once done, table will plot how much percentage of days belong to which basket.
For example, from the below chart of NASDAQ:AAPL
We can deduce following,
Historically stock has traded within 1% drawdown from ATH for 6.59% of time. This is the max amount of time stock has stayed in specific range of drawdown from ATH.
Stock has traded at the drawdown range of 82-83% from ATH for 0.17% of time. This is the least amount of time the stock has stayed in specific range of drawdown from ATH.
At present, stock is trading 2-3% below ATH and this has happened for about 2.46% of total days in trade
Maximum drawdown the stock has suffered is 83%
Lets take another example of NASDAQ:TSLA
Stock is trading at 21-22% below ATH. But, historically the max drawdown range where stock has traded is within 0-1%. Now, if we make this range to show 20 divisions instead of 100, it will look something like this:
Table suggests that stock is trading about 20-25% below ATH - which is right. But, table also suggests that stock has spent most number of days within this drawdown range when we divide it by 20 baskets instad of 100. I would probably wait for price to break out of this range before going long or short. At present, it seems a stage ranging stage. I might think about selling PUTs or covered CALLs outside this range.
Similarly, if you look at AMEX:SPY , 36% of the time, price has stayed within 5% from ATH - makes it a compelling bull case!!
NYSE:BABA is trading at 50-55% below ATH - which is the most it has retraced so far. In general, it is used to be within 15-20% from ATH
NOW, Bit of explanation on input options.
Number of Ranges : Says how many baskets the drawdown map needs to be divided into.
Reference : You can take ATH as reference or chose a time window between which the highest need to be considered for drawdown. This can be useful for megacaps which has gone beyond initial phase of uncertainity. There is no point looking at 80% drawdown AAPL had during 1990s. More approriate to look at it post 2000s where it started making higher impact and growth.
Cumulative Percentage : When this is unchecked, percentage division shows 0-nth percentage instad of percentage ranges. For example this is how it looks on SPY:
We can see that SPY has remained within 6% from ATH for more than 50% of the time.
Hope this is helpful. Happy trading :)
PS: this can be used in conjunction with Drawdown-Price-vs-Fundamentals to pick value stocks at discounted price while also keeping an eye on range tendencies of it.
Thanks to @mattX5 for the ideas and discussion today :)

Drawdown - Price vs FundamentalsIn this study, we are trying to compare drawdown from ATH of price and fundamentals to understand if price drawdown is really justifyable or if this is the buying opportunity.
For example, NYSE:BABA in the chart below shows that price has come down by more than 50%. But, the fundamentals has not changed upto this extent.
This may be viewed as buying opportunity from the eyes of fundamental based trader.
Similarly NYSE:LPX is trading at 15% below ATH whereas fundamentals are at peak. This again can be considered as buying opportunity.
NASDAQ:AAPL on the other hand is trading almost near ATH whereas fundamentals are having higher drawdown.
Well, this is just one factor to consider. I am about to release another script which can demonstrate amount of time (in terms of percentage) instrument trades at certain drawdown range. This looks something like this:
These two scripts can be used in conjunction to define your fundamental based trade.
I can add more funcamentals to the list. But, the higher value of fundamental should correlate to better position. Hence we cannot use things such as PE (which inversely correlates to value). Also need to keep the factor which includes total number of shares in it so that it is not affected by share dilution. Hence, have considered Total Revenue per Share instead of Total Revenue in this script.
Thanks to @mattX5 for suggesting fundamental based ideas in this line :)

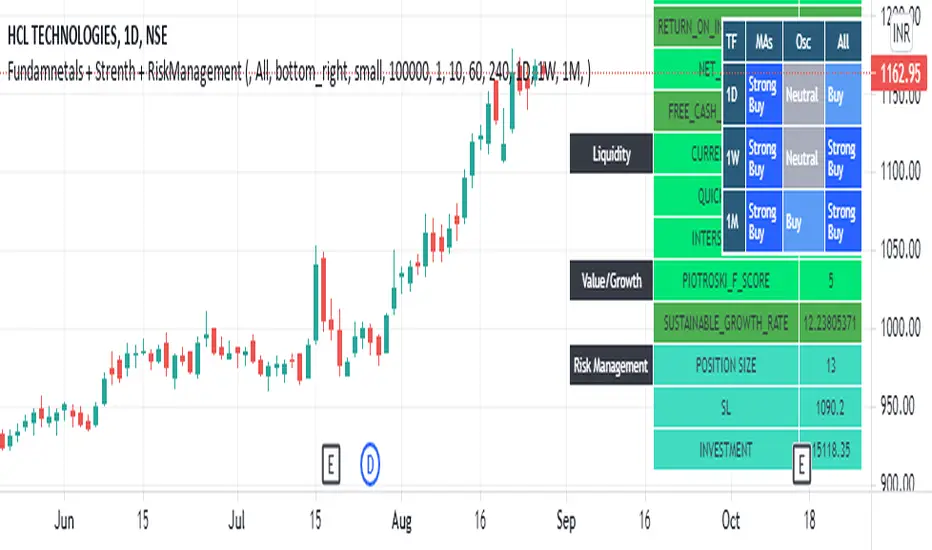
Fundamnetals + Strength + RiskManagementCreated indicator to help investors by providing fundamental, technical and Risk Management information on screen for better decision making
you can see
Fundamentals
- Solvency,
- Liquidity
- Growth,
- Profitability
- Patrioski Score
- Altman Z-Score
Technicals
- MAs
- Oscillators
Risk Management
- Position Size
- Stop Loss
- Total Investment