ADR - Average Daily Range RobertsFXThe most overlooked but powerful indicator makes you see the markets for what they are.
You will see how much the markets move on average per day. This is fantastic info if you are an intraday trader and want to set your take profit within the average range, so you have as high a probability as possible of reaching your take profit today.
You can also trade reversals from ADR high and low. Very often the price changes direction back into the middle of the ADR high and low, at around 50%.
Forex

Garman and Kohlhagen (1983) for Currency Options [Loxx]Garman and Kohlhagen (1983) for Currency Options is an adaptation of the Black-Scholes-Merton Option Pricing Model including Analytical Greeks and implied volatility calculations. The following information is an excerpt from Espen Gaarder Haug's book "Option Pricing Formulas". This version of BSMOPM is to price Currency Options. The options sensitivities (Greeks) are the partial derivatives of the Black-Scholes-Merton ( BSM ) formula. Analytical Greeks for our purposes here are broken down into various categories:
Delta Greeks: Delta, DDeltaDvol, Elasticity
Gamma Greeks: Gamma, GammaP, DGammaDSpot/speed, DGammaDvol/Zomma
Vega Greeks: Vega , DVegaDvol/Vomma, VegaP, Speed
Theta Greeks: Theta
Rate/Carry Greeks: Rho, Rho futures option, Carry Rho, Phi/Rho2
Probability Greeks: StrikeDelta, Risk Neutral Density
(See the code for more details)
Black-Scholes-Merton Option Pricing for Currency Options
The Garman and Kohlhagen (1983) modified Black-Scholes model can be used to price European currency options; see also Grabbe (1983). The model is mathematically equivalent to the Merton (1973) model presented earlier. The only difference is that the dividend yield is replaced by the risk-free rate of the foreign currency rf:
c = S * e^(-rf * T) * N(d1) - X * e^(-r * T) * N(d2)
p = X * e^(-r * T) * N(-d2) - S * e^(-rf * T) * N(-d1)
where
d1 = (log(S / X) + (r - rf + v^2 / 2) * T) / (v * T^0.5)
d2 = d1 - v * T^0.5
For more information on currency options, see DeRosa (2000)
Inputs
S = Stock price.
X = Strike price of option.
T = Time to expiration in years.
r = Risk-free rate
rf = Risk-free rate of the foreign currency
v = Volatility of the underlying asset price
cnd (x) = The cumulative normal distribution function
nd(x) = The standard normal density function
convertingToCCRate(r, cmp ) = Rate compounder
gImpliedVolatilityNR(string CallPutFlag, float S, float x, float T, float r, float b, float cm , float epsilon) = Implied volatility via Newton Raphson
gBlackScholesImpVolBisection(string CallPutFlag, float S, float x, float T, float r, float b, float cm ) = implied volatility via bisection
Implied Volatility: The Bisection Method
The Newton-Raphson method requires knowledge of the partial derivative of the option pricing formula with respect to volatility ( vega ) when searching for the implied volatility . For some options (exotic and American options in particular), vega is not known analytically. The bisection method is an even simpler method to estimate implied volatility when vega is unknown. The bisection method requires two initial volatility estimates (seed values):
1. A "low" estimate of the implied volatility , al, corresponding to an option value, CL
2. A "high" volatility estimate, aH, corresponding to an option value, CH
The option market price, Cm , lies between CL and cH . The bisection estimate is given as the linear interpolation between the two estimates:
v(i + 1) = v(L) + (c(m) - c(L)) * (v(H) - v(L)) / (c(H) - c(L))
Replace v(L) with v(i + 1) if c(v(i + 1)) < c(m), or else replace v(H) with v(i + 1) if c(v(i + 1)) > c(m) until |c(m) - c(v(i + 1))| <= E, at which point v(i + 1) is the implied volatility and E is the desired degree of accuracy.
Implied Volatility: Newton-Raphson Method
The Newton-Raphson method is an efficient way to find the implied volatility of an option contract. It is nothing more than a simple iteration technique for solving one-dimensional nonlinear equations (any introductory textbook in calculus will offer an intuitive explanation). The method seldom uses more than two to three iterations before it converges to the implied volatility . Let
v(i + 1) = v(i) + (c(v(i)) - c(m)) / (dc / dv (i))
until |c(m) - c(v(i + 1))| <= E at which point v(i + 1) is the implied volatility , E is the desired degree of accuracy, c(m) is the market price of the option, and dc/ dv (i) is the vega of the option evaluaated at v(i) (the sensitivity of the option value for a small change in volatility ).
Things to know
Only works on the daily timeframe and for the current source price.
You can adjust the text size to fit the screen
Related indicators:
BSM OPM 1973 w/ Continuous Dividend Yield
Black-Scholes 1973 OPM on Non-Dividend Paying Stocks
Generalized Black-Scholes-Merton w/ Analytical Greeks
Generalized Black-Scholes-Merton Option Pricing Formula
Sprenkle 1964 Option Pricing Model w/ Num. Greeks
Modified Bachelier Option Pricing Model w/ Num. Greeks
Bachelier 1900 Option Pricing Model w/ Numerical Greeks

Ultra Moving Average Rating Trend StrategyThis is a technical analysis strategy based initially on the rating strategy, but fully adapted and converted to moving average rating.
In this case we are using: Ichimoku, SMA, EMA, ALMA, SMMA, LSMA, VWMA, DEMA, HMA, KAMA FRAMA, VIDYA, JMA, TEMA, ZLEMA, TRIMA and T3 moving averages.
With all of them together I am making an index.
Rules for entry and exit:
If % percentage of all the moving averages is telling to go long , we go long or exit short. And viceversa for short.
If there are any questions, please let me know !

Moving Average Directional IndexMADX is ADX-inspired indicator with moving averages that determines strength of a trend, as well as its direction. Indicator works following:
As the value of MADX increases, so does the strength of a trend
If MADX+ ( green line - bullish MADX ) crosses above MADX- ( red line - bearish MADX ) we consider trend as bullish and vice versa..
There will be situations where MADX- and MADX+ cross multiple times in a short period of time -> that will mean that market indecision is happening and big move will most likely happen after it.
For the calculation of MADX+ and MADX- we need Moving Averages or Exponential Moving Averages with three specific sources ( high, close, low ).
Now, the calculation of each MADX will differ
=> for MADX+: Moving Average (high) / Moving Average (close)
=> for MADX-: Moving Average (close) / Moving Average (low)
Length of Moving Average is editable.

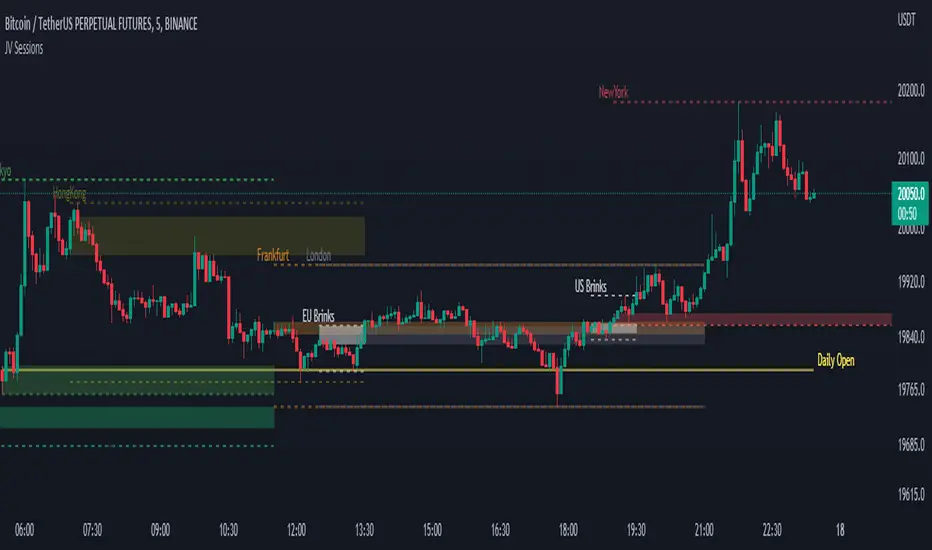
JV SessionsThis indicator serves as the Tradingview equivalent of an MT4 indicator suite.
It differentiates from existing TV indicators in its style and total feature set (most notably PVSRA and PVSRA Override)
It was originally designed for forex markets, and it will work for crypto as well, but it has not been tested on stocks.
List of Forex Market:
Market boxes (NY/JP/ HK /UK/ FR and Brinks Boxes)
BTMM R.NOODLEThis script aims to encompass the style of Traders Reality, Steve M (BTTM), and Stacey Burke (youtube)
yesterday and last wk high and low
Custom watermark with examples (good for fullscreen multicharts)
can set it to show the year and week x of year
Colored candles for ays of week.
The theory behind these colors are that monday and tuesday set your initial balance for the week . having color seperation helps identify the balance
mon-tues = initial balance :green
wed +thu : blue
friday: red
Session boxes and daily initial balance
displays the asian and european trading session as one
displays the ny session first 3 hrs
how to combine sessions, weekly ib, daily ib, and sessions
will add pip lines 00/.50 increments at a later date

Forex Master Pattern Contraction Finder by nnamThis script is for use with the FOREX Master Pattern to assist the user with drawing in True Value areas.
The script uses a combination of LOWER HIGHS and HIGHER LOWS to pinpoint areas of potential contraction and marks them with an X.
Using these X symbols as visual guidance, the user can easily locate areas of contraction or "tightening" of the price as it comes out of the expansion phase.
In addition, the daily highs and lows create a visible red or green box (depending on price in relation to the previous days close). These boxes also assist the user in determining the average price for the day and whether or not the price is contracting. A WIDE box is indicative of an expansion phase or widening in price swings and a "skinny" box is indicative of a tightening in price swings .
A combination of both plotted X contraction signals and a tightening box are highly indicative of a contraction phase. These contraction phases appear early in the beginning stage of the FOREX MASTER PATTERN giving the user ample time to plan trades and spot breakouts from the contraction into expansion.
The Image above shows a prime example of a potential contraction in price on the ETH/USDT 1 hour chart.
A series of highs and lows shows an expansion. The indicator settings allow the user to turn ON a visual text label showing each higher high, lower high, higher low and lower low in any combination.
Lower High and Higher low is ON by default and is represented by BOTH an X and the initials LH above bar and HL below bar for easier identification of the actual bar that triggered the signal.
In the absence of an X signal or initials LH + HL the contraction is not confirmed. As you can see in the screenshot below, the boxes alone are not indicative of a contraction and can be false positives. It is important to wait for both.
INPUTS AND SETTINGS
To make the indicator more user friendly, I have added several on off buttons for certain attributes. Many are OFF by default for a clean look when firs t starting the indicator. Below is a list of settings and what they are.
Contraction Settings
- Show potential contractions on chart?
on by default - shows the Lower Highs and Lower Lows with an X sumbol
Moving Average Settings
Exponential Moving Average Length
default is 50EMA but can be changed
- Show Moving Average on chart?
off by default and must be checked to add the ema
RSI Settings
- Show RSI Overbought and Oversold?
off by default
Users can turn this on and use in conjunction with higher high and lower high to spot potential reversals
RSI Source - default is CLOSE
RSI Length - default is 6
RSI Overbought Level - default is 85
RSI Oversold Level - default is 15
Chart Type Settings
- Use Renko Style Pivots?
Allows Renko to be used (open/close for high/low)
off by default
LOWER HIGHS AND LOWER LOWS (VIEW BULLISH TRENDS)
Show higher highs?
Show Higher Lows?
These can be turned on or off depending on your preference for trend spotting.
LOWER HIGHS AND LOWER LOWS (VIEW BEARISH TRENDS)
Show Lower Highs?
Show Lower Lows?
These can be turned on or off depending on your preference for trend spotting.
BUY AND SELL SIGNALS SETTINGS
(these are experimental)
- Show Potential BUY signals on chart?
- Show Potential SELL signals on chart?
These 'experimental signals' combine overbought RSI with Higher Highs and Oversold RSI with Lower Lows to signal a potential turn in price.
During major corrections you may get several BUY signals in a row as the price plummets and during FOMO bull runs, you may get several SELL signals in a row.
To help minimize this, you can turn ON the Renko option listed above and change the RSI to a higher number.
The signals work best using Heikin Ashi and on 1 hour time frames.
In order for a trigger to occur, the script ensures there are several RSI overbought and oversold signals in a row.
RSI and Higher High, Lower Low options do not have to be turned on to get the signals.
BOX Settings
You can change the border width and color of the boxes.
You may also JOIN the boxes if you want to.
I really hope you enjoy this indicator and I hope it brings you good luck in your trading.
Don't forget to follow so you are notified when I upload any new indicators.
nnamdert

Auto Fibonacci Levels + Auto Trend Line generatorAnother indicator for you guys!!!
This indicator consists of the 5 key Fibonacci retracement levels, plotted automatically to user input settings. I also have included an auto support/resistance trend line generator.
What is a Fibonacci retracement?
'Fibonacci retracement is a method of technical analysis for determining support and resistance levels. It is named after the Fibonacci sequence of numbers, whose ratios provide price levels to which markets tend to retrace a portion of a move before a trend continues in the original direction.' - Wikipedia
How to use the Fibonacci retracement?
- The Fibonacci levels are default. These percentiles from price to the average of the high in a sample and low in a sample give you a guideline of where a bottom may be, where a top may be, and where a range is being created.
- Look for the price to reject from 61.8% and 76.4%, and also look for price to bounce from 38.2% and 23.6%. If a lower low/higher high is made, the fib levels will follow and the percentiles within will be recalculated after a 5 candle offset period.
- If you see price trending towards the lower percentiles (38&23) and using the 50% as resistance, look for a break downwards and vice versa.
-This Fibonacci set as all others is subject to fake-out, always use this with another series indicator, or don't use it as a signal for entry at all (unless you have a backdated strategy)
How to use the trend line generator?
-The trend line generator will only plot when a lower low/higher high has taken place within the input amount of candles. It is also offset by a user amount.
-The check box will give the option to have the trend line's plot or not.
- If you see a green/red dot it means that that will be your first coordinate for the trend line, and until the computations are complete it will give you an idea of which direction it will be in (resistance or support)
-When opening this indicator zoom out all the way to connect any trend lines that do not load automatically.
Let me know if you have any questions, suggestions or issues! Thank you everyone!
-Cheatcode1 :)
SP:SPX TVC:DXY BMFBOVESPA:EUR1! CME:BTC1! BINANCE:BTCUSDT

Forex Midpoint Stratejisi For Nasdaq English Knowledge:
Midpoint Strategy;
The general calculation method is a strategy that helps determine direction by the intersection of a MA line and the value obtained by dividing the lowest and highest price in the specified length range.
Başlangıç Periyodu: The data length of the Midpoint Line.
Kaydırma Seviyesi: The number of steps forward or backward of the Midpoint Line.
Yüzde Seviyesi: the amount of vertical scrolling.
Uzunluk: The length of the MA line
represents.
This strategy is prepared for the Nasdaq 5-minute period. It needs to be optimized for use on other instruments.
There are take profit and stop loss levels within the codes. Friends who want to use it can remove the invisibility from the relevant sections. Also, I removed the midpoint and the MA line so that it does not crowd the image, you can add it if you want.
Thank you.
Turkish Knowledge:
Midpoint Stratejisi;
Genel hesaplama yöntemi, belirlenen uzunluk aralığındaki en düşük ve en yüksek fiyatın ikiye bölümü ile elde edilen değer ve bir ortalama çizgisinin kesişimleriyle yön belirlemeye yardımcı bir stratejidir.
Başlangıç Period: Midpoint Çizgisinin veri uzunluğunu.
Kaydırma Seviyesi: Midpoint Çizgisinin ileri veya geri adım sayısını.
Yüzde Seviyesi: dikey kaydırma miktarını.
Uzunluk: Ortalama çizgisinin uzunluğunu
temsil etmektedir.
Bu strateji Nasdaq 5 dakikalık periot için hazırlanmıştır. Diğer enstrümanlarda kullanılması için optimize edilmesi gerekir.
Kodların içinde Kar alma , zarar durdurma seviyeleri mevcuttur. Kullanmak isteyen arkadaşlar ilgili bölümlerden görünmezliği kaldırabilirler. ayrıca midpoint ve ortalama çizgisinide görüntü kalabalığı yapmaması için ben kaldırdım isterseniz siz ekleyebilirsiniz.
Teşekkürler.

Bullish Engulfing AlertThis is a Bullish Engulfing Candle Indicator with Alerts.
This is not like any other Bullish Engulfing candle indicator present on TV. There are some special rules that are being used to identify specific engulfing candles.
Also, the user can choose if they like nice body engulfing or they want to ignore them.
The indicator have the following highlights:
1) Ability to choose the color of the engulfing candle body.
2) Ability to choose a different color for the Liq (liquidity) swap engulfing candle body.
3) With above 2 options, you can get the desired information without plotting any extra information on the chart.
4) You can put the alerts for getting notified when these patterns forms on the chart.
5) Ability to choose between getting notified or not on the chart if the engulfing candle body is less than 40% of the whole candle size. This is useful in order to identify if the engulfing is really powerful or not.
6) Ability to choose between getting notified or not on the chart if the engulfed candle body is really small. This is in particular useful for avoiding the engulfing of Doji which in turn might not be that powerful.
We will keep on making the improvements/Enhancements over the time (Check the changelog for such features)
NOTE: The indicator is of best use if you have a defined & back tested strategy which relies on this type of candlestick pattern.

Bearish Engulfing AlertThis is a Bearish Engulfing Candle Indicator with Alerts.
This is not like any other Bearish Engulfing candle indicator present on TV. There are some special rules that are being used to identify specific engulfing candles.
Also, the user can choose if they like nice body engulfing or they want to ignore them.
The indicator have the following highlights:
1) Ability to choose the color of the engulfing candle body.
2) Ability to choose a different color for the Liq (liquidity) swap engulfing candle body.
3) With above 2 options, you can get the desired information without plotting any extra information on the chart.
4) You can put the alerts for getting notified when these patterns forms on the chart.
5) Ability to choose between getting notified or not on the chart if the engulfing candle body is less than 40% of the whole candle size. This is useful in order to identify if the engulfing is really powerful or not.
6) Ability to choose between getting notified or not on the chart if the engulfed candle body is really small. This is in particular useful for avoiding the engulfing of Doji which in turn might not be that powerful.
We will keep on making the improvements/Enhancements over the time (Check the changelog for such features)
NOTE: The indicator is of best use if you have a defined & back tested strategy which relies on this type of candlestick pattern.

Triple RSI strategyThis strategy is commonly used both in forex and stock markets for reversal trading. when the rsi line reaches and crosses simultaneously at 3 rsi setups i.e at 7, 14, and 21, a signal is generated.
This strategy works best in 1-hour timeframe. It provides over 60 to 80 percent accuracy in 1-hour timeframe.
In the stock market, this strategy provides an excellent entry point, if one is seeking small profits.
One can expect to make around 10 to 50 pips in the forex market easily. However, I advise seeking support from price action from the lower timeframe in the forex market.
I hope you like it.
Follow for more strategies and scripts like this.

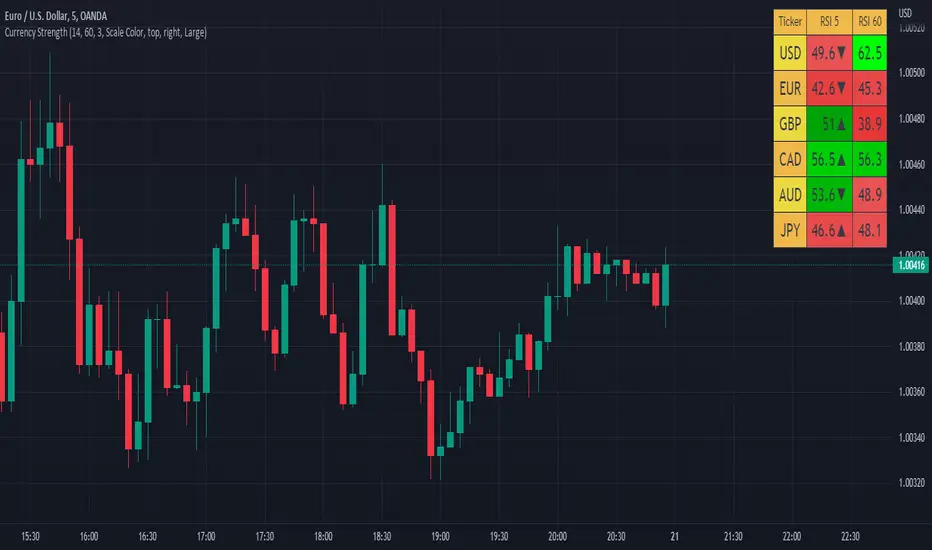
Currency Strength V2An update to my original Currency Strength script to include a 2nd timeframe for more market context.
Changed the formatting slightly for better aesthetics, as the extra column and colors became unsightly.
Also added a new setting for "Flat Color", which changes the value background to a simple green/red for above or below 50, rather than using the Color Scale that increases color intensity the further it gets from 50.
________________________________________________________________________________
This script measures the strength of the 6 major currencies USD, EUR, GBP, CAD, AUD and JPY.
Simply, it averages the RSI values of a currency vs the 5 other currencies in the basket, and displays each average RSI value in a table with color coding to quickly identify the strongest and weakest currencies over the past 14 bars (or user defined length).
The arrow in the current RSI column shows the difference in average RSI value between current and X bars back (user defined), telling you whether the combined RSI value has gone up or down in the last X bars.
Using the average RSI allows us to get a sense of the currency strength vs an equally weighted basket of the other majors, as opposed to using Indexes which are heavily weighted to 1 or 2 currencies.
The additional security calls for the extra timeframe make this slower to load than the original, but this was a user request so hopefully it will prove worthwhile for some people.
Those who find the loading too slow when switching between charts may be better off still using the original, which is why this is posted as a separate script and not an update to the original.
This is the table with Flat Color option enabled.
Munich's Momentum Wave V2MUNICH'S MOMENTUM WAVE VERSION 2 IS LIVE!!!
There are a few big things to note with this one.
I decided to upload this as an entirely new script due to the number of changes differing from the first version, but as the last one, this will still work on ANY TIMEFRAME, ANY ASSET CLASS, ANY PRICE! .
This momentum wave indicator now will give you data for when trend could turn, and two momentum indicators to help you decide when to take an entry.
First off,
*I have added an alma ma (alma) that will track momentum alongside price action and further lead the indicator consisting of the Munich waves.
* The background feature will track the price using a method derived from the Bollinger bands, after calculations, it will color the background based on the average of the momentum's ema's, the alma ma, and also the alma in comparison to the alma's value pre offset ( the offset is 3, following the basis).
*There are now 5 basis values given from the increase in ema samples.
If anyone has any questions feel free to pm me or comment below. Thank you guys for the support! :)
INDEX:BTCUSD TVC:NDQ AMEX:SPY BITSTAMP:ETHUSD BINANCE:BTCUSDT FX:USDJPY NASDAQ:AAPL

Rob Booker - ADX Breakout updated to pinescript V5Rob Booker - ADX Breakout. The strategy remains unchanged but the code has been updated to pinescript V5. This enables compatibility with all new Tradingview features. Additonally, indicators have been made more easily visible, default cash settings as well as input descriptions have been added.
Rob Booker - ADX Breakout: (Directly taken from the official Tradingview V1 version of the script)
Definition
Rob Booker’s Average Directional Index (ADX) Breakout is a trend strength indicator that affirms the belief that trading in the direction of a trend and continuing to follow its pull is more profitable for traders, while simultaneously reducing risk.
History
ADX was traditionally used and developed to determine a price’s trend strength. It is commonly known as a tool from the arsenal of Rob Booker, experienced entrepreneur and currency trader.
Calculations
Calculations for the ADX Breakout indicator are based on a moving average of price range expansion over a specific period of time. By default, the setting rests at 14 bars, this however is not mandatory, as other periods are routinely used for analysis as well.
Takeaways
The ADX line is used to measure and determine the strength of a trend, and so the direction of this line and its interpretation are crucial in a trader’s analysis. As the ADX line rises, a trend increases in strength and price moves in the trend’s direction. Similarly, if the ADX line is falling, a trend decreases in strength and price then enters a period of consolidation, or retracement.
Traditionally, the ADX is plotted on the chart as a single line that consists of values that range from 0-100. The line is non-directional, meaning that it always measures trend strength regardless of the position of a price’s trend (up or down). Essentially, ADX quantifies trend strength by presenting in both uptrends and downtrends of the line.
What to look for
The values associated with the ADX line help traders determine the most profitable trades and where risk lies in the current trend. It is important to know how to quantify trend strength and distinguish between the varying values in order to understand the differences in trending vs. non-trending conditions. Let’s take a look at ADX values and what they mean for trend strength.
ADX Value:
0-25: Signifies an absent of weak trend
25-50: Signifies a strong trend
50-75: Signifies a very strong trend
75-100: Signifies an extremely strong trend
To delve into this a bit further, let’s assess the meaning of ADX if it is valued below 25. If the ADX line remains below 25 for more than 30 or so bars, price then enters range conditions, making price patterns more distinguishable and visible to traders. Price will move up and down between resistance and support in order to determine selling and buying interest and may then eventually break out into a trend or pattern.
The way in which ADX peaks, ebs, and flows is also a signifier of its overall pattern and trend momentum. The line can clearly indicate to the trader when trend strength is strong versus when it is weak. When ADX peaks are pictured as higher, it points towards an increase in trend momentum. If ADX peaks are pictured as lower - you guessed it - it points towards a decrease in trend momentum. A trend of lower ADX peaks could be a warning for traders to watch prices and manage and assess risk before a trade gets out of hand. Similarly, whenever there is a sudden move that seems out of place or a change in trend character that goes against what you’ve seen before, this should be a clear sign to watch prices and assess risk.
Summary
The ADX Breakout indicator is a trend strength indicator that analyzes price movements relative to trend strength to signal a user when is best for a trade and when is best to manage risk and assess patterns. As long as a trader recognizes strong trends and assesses the risk of each trade properly, they should have no problem using this indicator and utilizing it to work in their favor. In addition, the ADX helps identify trending conditions, but while doing so, also aids traders in finding strong trends to trade. The indicator can even alert traders to specific changes in trend momentum, allowing them to be primed for risk management.

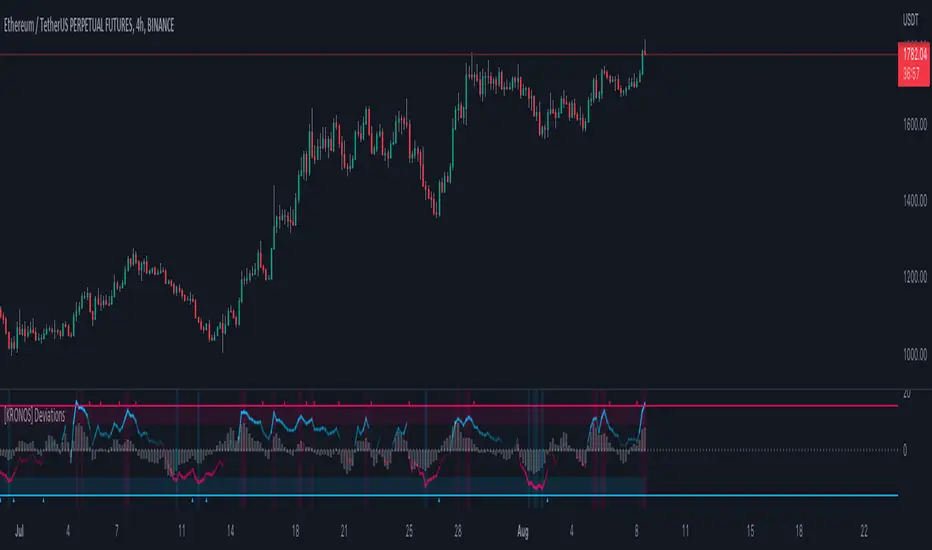
[KRONOS] DeviationsDescription
This indicator calculates the differences between the current price and the local support or resistance, and normalizes it into a range.
The value basis is calculated from a defined period of time that is then multiplied to get a standard deviations and a max. and min. value subtracted and divided into a final value.
It includes
Extreme zones. This value appears as blue and red lines which deviates from the oversold to overbought range.
Momentum. Lower time frame momentum is represented by a gray histogram as well as a signal line oscillating from a red to blue color.
Strong reversal. Red ( bearish ) and blue ( bullish ) columns will appear on the histogram when our algorithm detects that the strength of momentum is coming to an end indicative of a trend reversal.
Trend confirmation. Red or blue arrows will act as a trend confirmation.
Support and resistance . The zero line will frequently serve as a S/R area.
Divergences. You can use this indicator to detect potential pivot areas.
How to use?
Sell/Short when the histogram shows a red column and the signal line is in or above the overbought area (colored in red).
Buy/Long when the histogram shows a blue column and the signal line is in or below the oversold area (colored in blue).
extra tip: if you entered a trade based on the above conditions, you can partially increase your position each time you see a confirmation arrow.
[KRONOS] FlowDescription
The main indicator component is a white signal line calculated from the price and strength of the current market pair filtered using the Fourier transformation formula (by Joseph Fourier).
It includes
Trend confirmation. The grayish line is the signal line moving average which can either be used as a support/resistance line or as a strong trend confirmation in the case of a crossover/crossunder.
Oversold and overbought areas. These areas are marked with multiple hues of red and blue color for them to be more easily noticeable.
Extreme areas. Arrows around extreme areas are showing points where a reversal is very likely to occur.
How to use?
Buy/Long on a blue arrow (or after a crossover if you want more confirmations)
Sell/Short on a red arrow (or after a crossunder if you want more confirmations)
extra tip: use the zero line and overbought/oversold areas as a take profit area and place your stop loss at the previous swing low.

[KRONOS] MomentumDescription
This indicator is based on an algorithm which provides accurate momentum tracking on every timeframe. It is visualized as a colored histogram and through some other tools.
The value is calculated from an exponentially weighted moving average that is used to get a high and a low deviation, merging the last value into a range.
It includes
Overbought and oversold fixed areas. Their purpose is to facilitate the recognition of areas where the trend is likely to end or cool down. They are also marked with a background coloring.
Zero line. It typically represents a change of trend when the price crosses under or over it.
Volume shifts. Colored arrows will appear whenever a volume change is detected.
How to use?
Buy/Long on a blue confirmation arrow
Sell/Short on a red confirmation arrow
Take profit when the indicator starts showing a blue background
Take profit when the indicator starts showing a red background
extra tip: the zero line often acts as support / resistance similarly to the overbought and oversold areas

[KRONOS] Gamma StrengthDescription
This indicator's main component is the signal line which represents a very responsive market strength value calculated from real time data and normalized into a range (0 - 0.5 - 1). Indicator is using Stochastic and RSI functions to get raw value filtered through a linear regression, helping users predict imminent market directions. Lastly, this value oscillation is converted into a range to notice overbought and oversold zones at a quick glance.
It includes
Divergence. Indicator plots R for regular divergence and H for hidden with minimal possible delay which can be used to notice irregularity in the market.
Extreme overbought and oversold areas. Colored background extreme areas are showing points where a reversal is approaching.
How to use?
Buy/Long when the indicator line goes out of the blue/oversold area.
Sell/Short when the indicator line goes out of the red/overbought area.
extra tip: you can use the zero line and overbought/oversold zones as either a take profit or an entry area.

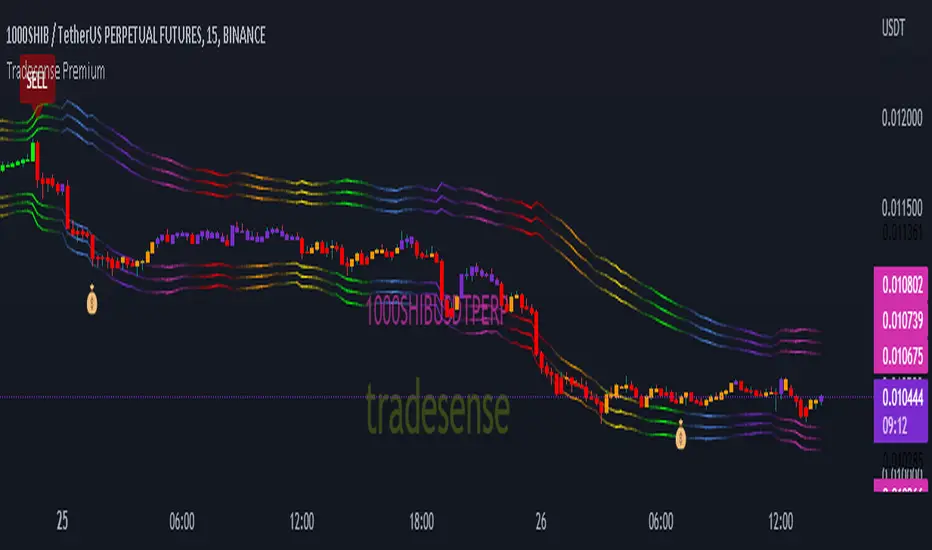
Tradesense PremiumTradesense Premium
Tradesense Premium indicator offers a buy & sell signal that is based from our senior analyst who have more than 10years of experience in Forex, Stock and Crypto trading and made it possible by our pine script developers.
Our script can detect market volatility based on the price direction and the absolute value of exponential moving average are multiplied to specific numbers to get a different trading style such as Scalper, Swing Trader and Trend Follower. We also filtered out all the signals using a different known indicators such as RSI, ATR, and ADX, and the results will allow you to enter a trade before the big moves occur. We also included all the important indicator which appears in real-time to get a competitive advantage in any market environment.
If you are a trader for a long time you should know that there is no way to avoid risk in trading. Every single trade could, theoretically at least, end up a loser. That is why our script also provides automatic risk management system which can gives you the ability to know exactly where to take the profit and to stop.
Trading style preset options - Will allows you to get the signals the way you wanted depending on your trading style. Ex. Scalper, Swing Trader or a Trend follower.
Bar color - Our bar colors are based on the price actions which detects the weakness of the bar or if the bar is ranging.
Reversal Zone - This indicator would identify possible price reversal zones.
Support & Resistance - This indicator draw a line at the pivot point to show possible support and resistance area.
Target Profit indicator based on price actions - This indicator will gives you an option to reduce your position or go out of the trade before the reversal happens.
Target Profit / Stop Loss based on ATR - This indicator will gives you a simple but effective risk management system to protect your capital. The TP/SL is based from the ATR.
Alert System - We are giving you an options to customize your alerts.
Our mission is to provide systematic way to build your success.
Release notes: Tradesense Premium V1.1
✅Trading style preset options
✅Bar color
✅Reversal Zone
✅Support & Resistance
✅Target Profit indicator based on price actions
✅Target Profit / Stop Loss based on ATR
✅Alert System
❓Trading style
Currently we have 3 sets of preset options that the user can use.
Scalp - this preset is made for the trader that wants a quick in and out of the trade. The best timeframe to this is 1min to 5mins chart.
Swing - this preset is for the trader who can wait a little bit longer in a trade. The best timeframe to use is 15mins to 1hour chart.
Trend - this preset is made for the busy people that can hold a trade more than a day. The best timeframe to use is 4hours to 1day chart.
❓Bar color
This options will change the color of your bars to lessen the noise of your chart.
Green Color is a bullish indicator
Red Color is a bearish indicator
Orange Color will signify that the trend is weakening
Purple Color is a consolidation/ranging price action
❓Reversal Zone
From the name it self, once the price is already hit the Reversal Zone the price will more likely to reverse or will make a correction.
❓Support & Resistance
When this option is enabled, the support and resistance levels will show up.
❓Target Profit indicator based on price actions
When this option is enabled, you will see a "💰" which means it's time to take profit or reduce your positions.
❓Target Profit / Stop Loss based on ATR
Most of the trader uses ATR as a stop loss level. When this option is enabled, the indicator for Stop Loss and Take Profit will show up and the TP/SL levels can be changed by changing the ATR Multiplier (Default is 1.8).
❓Alert System
Function alert is added and the user can customize it the way they want it.
Watchlist Screening Hammer & Engulfing Strategies [By MUQWISHI]A trading strategy screener is an idea of a visual alert for those who're trading particular strategies and facing a lack of capability of monitoring many symbols simultaneously, so this kind of tool could be more efficient to keep managing trading plans smoothly and quickly. I developed this screener as an idea more than providing legend strategies.
This screener indicator performs scanning 4 different strategies with customizable 10 symbols inputs, and 5 min is the preferable timeframe.
Strategies
1. Hammer at Low of the day.
2. Shooting Star at High of the day.
3. Bull Engulfing at Low of the day.
4. Bear Engulfing at High of the day.
Screener Overview
Disclaimer
I'm an amateur, and I'm not a qualified licensed investment advisor.
I don't recommend the use of showing signals as a sole means of trading decisions.

MASIG#2this indicator founded from easy combined
1.EMA
2.ATR/Supertrend
3.ADX/DI+DI-
4.MACD
5.Dochian
6.OBV
and show by line label and background

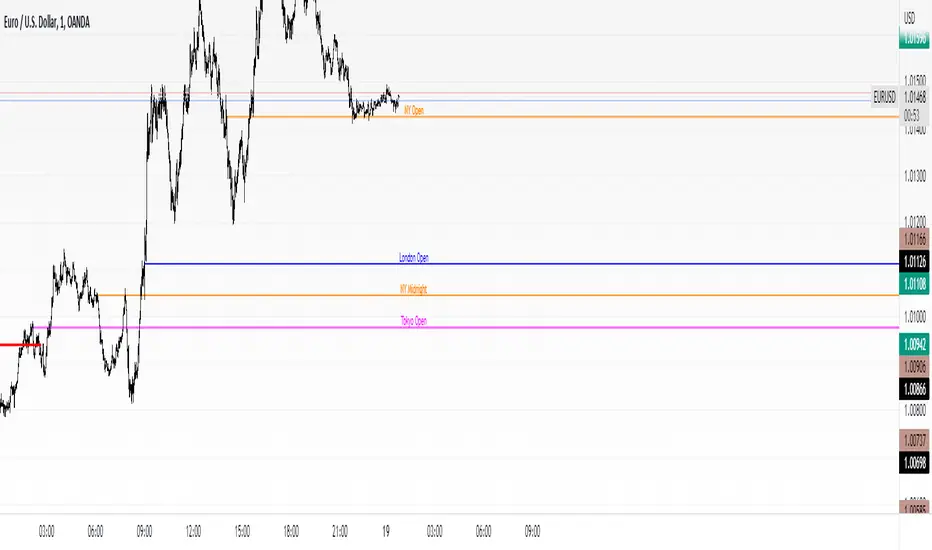
fxOpensPrints lines from the opening price of the three major forex session, plus from the New York midnight opening price.
Has some customizable settings.
Alerts for price crossing the levels.
Somewhat of a work in progress.