XAUUSD Weekly Gap Indicator (oberlunar)The XAUUSD Weekly Gap Indicator is a technical tool designed specifically for tracking weekly price gaps in the XAUUSD (gold) market. It identifies and visualizes the price difference between the Friday close and the Monday open, providing valuable insights into market dynamics over the weekend.
Gap Detection:
Measures the price difference between Friday's closing price and Monday's opening price.
Highlights whether the gap is bullish (Monday opens above Friday’s close) or bearish (Monday opens below Friday’s close).
Visualization:
Draws a line or rectangle to connect the Friday close and the Monday open, clearly marking the gap on the chart.
Displays an indicator label with the gap value, often in pips or points, to quantify the gap size.
Color Coding:
Green: Bullish gap (positive price movement).
Red: Bearish gap (negative price movement).
Market Sentiment:
Large gaps can indicate significant market sentiment shifts due to weekend events, such as economic reports or geopolitical news.
Support and Resistance:
Weekly gaps often act as temporary support or resistance levels, as the market may attempt to revisit or "fill" the gap.
Trading Strategies:
Gap Filling: XAUUSD often tends to "fill" these gaps, providing trading opportunities.
Continuation or Reversal: The reaction to the gap can signal whether the trend is likely to continue or reverse.
Forecasting

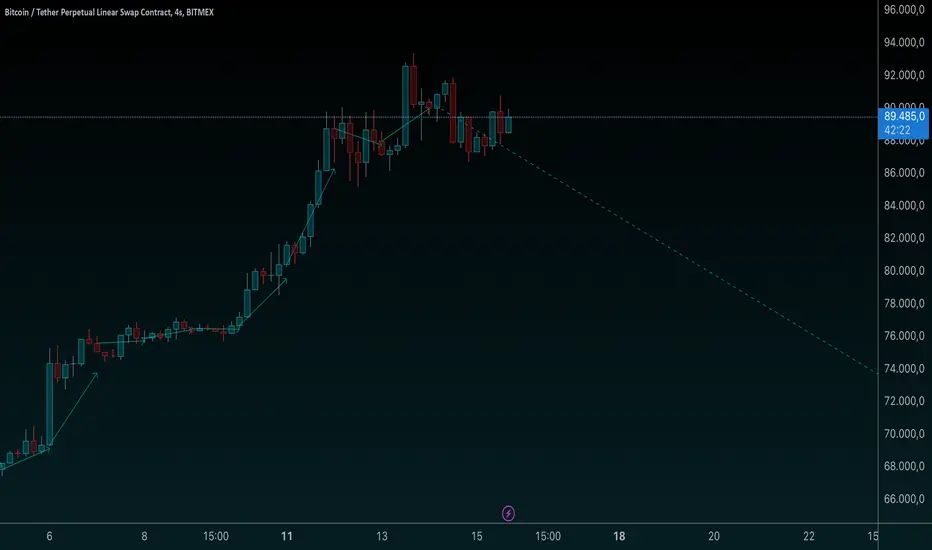
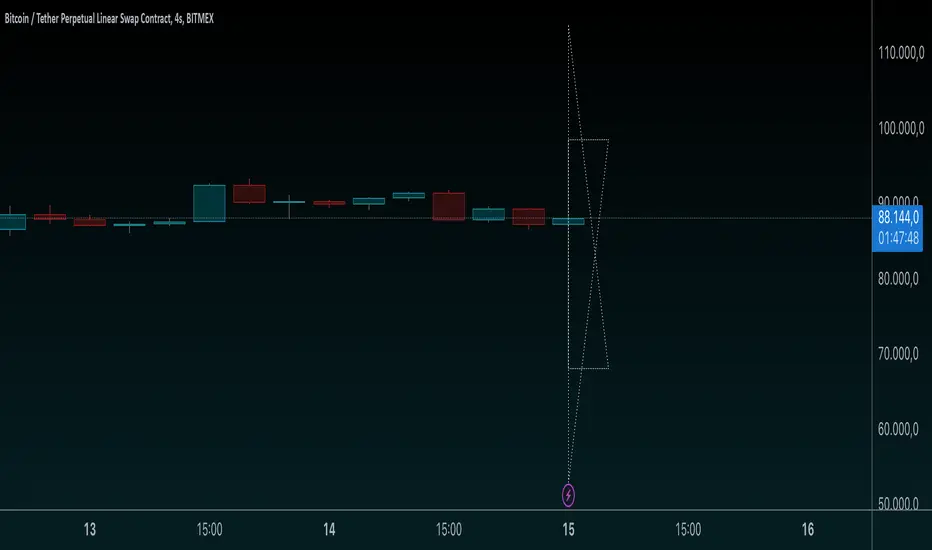
Hosoda ProjectionsThis script, written in Pine Script v5, introduces a technical analysis tool called "Hosoda Projections." Inspired by Ichimoku Kinkō Hyō and wave-based forecasting methods, this indicator helps traders visualize potential future price levels using a combination of pivot detection and projected price movements. It offers a unique way to anticipate market dynamics and define potential targets, making it particularly useful for those who seek to combine historical price patterns with forward-looking strategies.
The script works by detecting key pivot points in the market using a customizable lookback period and then calculating a ZigZag pattern based on price fluctuations that exceed a specified percentage threshold. These pivots are used to identify three recent swing points, which serve as the foundation for projecting possible future price levels. Using these swings, the script generates levels that correspond to Fibonacci-based extensions and projections, such as 38.2%, 61.8%, 100%, 161.8%, and additional extensions like 261.8% and 361.8%. These levels are visualized on the chart as horizontal lines and labeled with their respective values for easy interpretation.
The primary advantage of the Hosoda Projections script is its ability to provide a structured approach to identifying potential price targets. By leveraging the natural rhythm of price movements, it offers insights into where the market might find support or resistance in the future. This can help traders refine their entry and exit points, manage risk more effectively, and gain a deeper understanding of market sentiment. Additionally, the dynamic nature of the projections adapts to new price data, ensuring the tool remains relevant across changing market conditions.
This script is particularly valuable for traders who appreciate the harmony between historical price action and predictive analysis. Whether you are trading forex, stocks, or cryptocurrencies, the Hosoda Projections tool can enhance your trading strategy by providing actionable and visually intuitive forecasts.

Volume HighlightVolume Highlight
Description:
This script helps users analyze trading volume by:
1. Highlighting the highest volume bars:
• Trading sessions with volume equal to or exceeding the highest value over the last 20 periods are displayed in purple.
• Other sessions are displayed in light gray.
2. Displaying the 20-period SMA (Simple Moving Average):
• A 20-period SMA line of the volume is included to track the general trend of trading volume.
Key Features:
• Color-coded Highlights:
• Quickly identify trading sessions with significant volume spikes.
• 20-Period SMA Line:
• Observe the overall trend of trading volume.
• Intuitive Volume Bars:
• Volume bars are clearly displayed for easy interpretation.
How to Use:
1. Add the script to your chart on TradingView.
2. Look at the color of the volume bars:
• Purple: Sessions with the highest trading volume in the past 20 periods.
• Light gray: Other sessions.
3. Use the 20-period SMA line to analyze volume trends.
Purpose:
• Analyze market momentum through trading volume.
• Support trading decisions by identifying significant volume spikes.
Illustration:
• A chart showing color-coded volume bars and the 20-period SMA line.
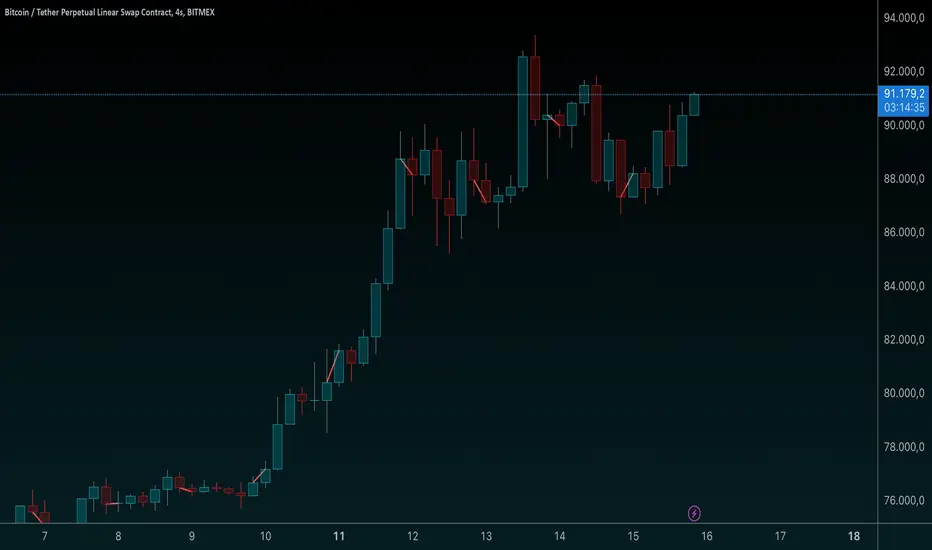
Naji's Price Change DetectorThis indicator detects when the price goes up or down by a customizable % and time. This allows the user to detect large changes in the market in order to try to catch the reversal.
This does not detect the reversal, you need to decide when to enter the trade yourself.
Key Features:
Customizable Settings:
Percent Change Threshold: You can change this in the settings panel (default = 4%).
Number of Bars to Check: Adjustable between 1 and any desired number of bars (default = 5).
Dynamic Calculation:
The script calculates the price change for every bar within the specified range.
Alerts:
Alerts are customized to reflect the chosen settings and will trigger only once per bar close.
Background Highlights:
Green: A price increase exceeding the threshold was detected.
Red: A price decrease exceeding the threshold was detected.

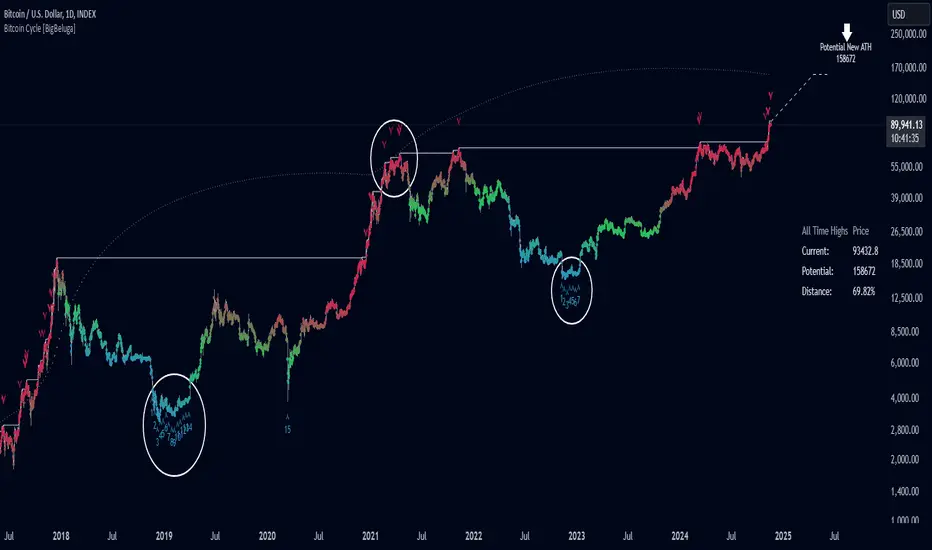
Bitcoin Cycle [BigBeluga]Bitcoin Cycle Indicator is designed exclusively for analyzing Bitcoin’s long-term market cycles, working only on the 1D BTC chart . This indicator provides an in-depth view of potential cycle tops and bottoms, assisting traders in identifying key phases in Bitcoin’s market evolution.
🔵 Key Features:
Heatmap Cycle Phases: The indicator colors each cycle from blue to red , reflecting Bitcoin’s market cycle progression. Cooler colors (blue/green) signal potential accumulation or early growth phases, while warmer colors (yellow/red) indicate maturation and potential top regions.
All-Time High (ATH) and Future ATH Projection: Tracks the current ATH in real-time, while applying a linear regression model to project a possible new ATH in the future. This projection aims to provide insights into the next major cycle peak for long-term strategy.
Dashboard Overview: Displays the current ATH, potential new ATH, and the percentage distance between them. This helps users assess how far the current price is from the projected target.
Top & Bottom Cycle Signals: Red down arrows mark significant price peaks, potentially indicating cycle tops. Up arrows, numbered sequentially (inside each cycle), denote possible bottom signals for strategic DCA (Dollar Cost Averaging) entries.
1D BTC Chart Only: Built solely for the 1D BTC timeframe. Switching to any other timeframe or asset will trigger a warning message: " BTC 1D Only ." This ensures accuracy in analyzing Bitcoin’s unique cyclical behavior.
🔵 When to Use:
Ideal for long-term Bitcoin investors and cycle analysts, the Bitcoin Cycle Indicator empowers users to:
Identify key accumulation and distribution phases.
Track Bitcoin’s cyclical highs and lows with visual heatmap cues.
Estimate future potential highs based on historical patterns.
Strategize long-term positions by monitoring cycle tops and possible accumulation zones.
By visualizing Bitcoin’s cycles with color-coded clarity and top/bottom markers, this indicator is an essential tool for any BTC analyst aiming to navigate market cycles effectively.
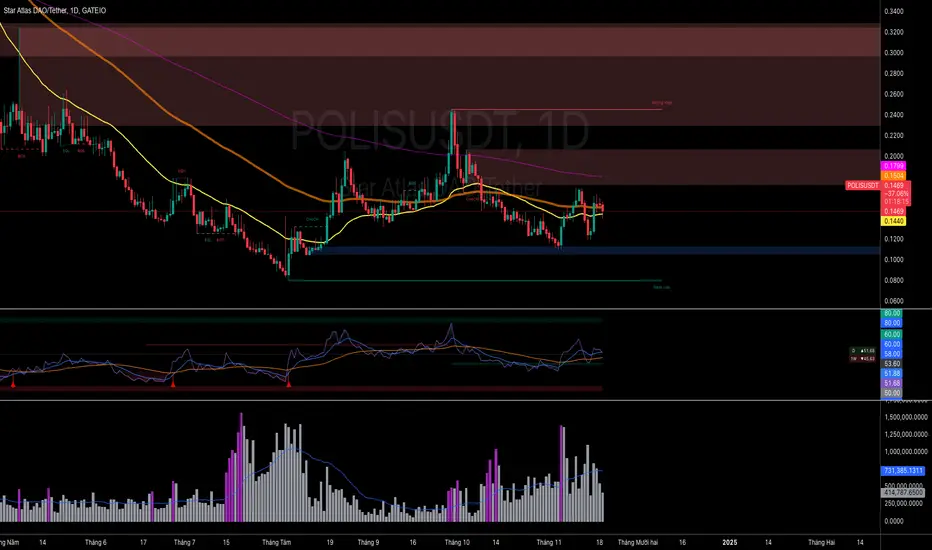
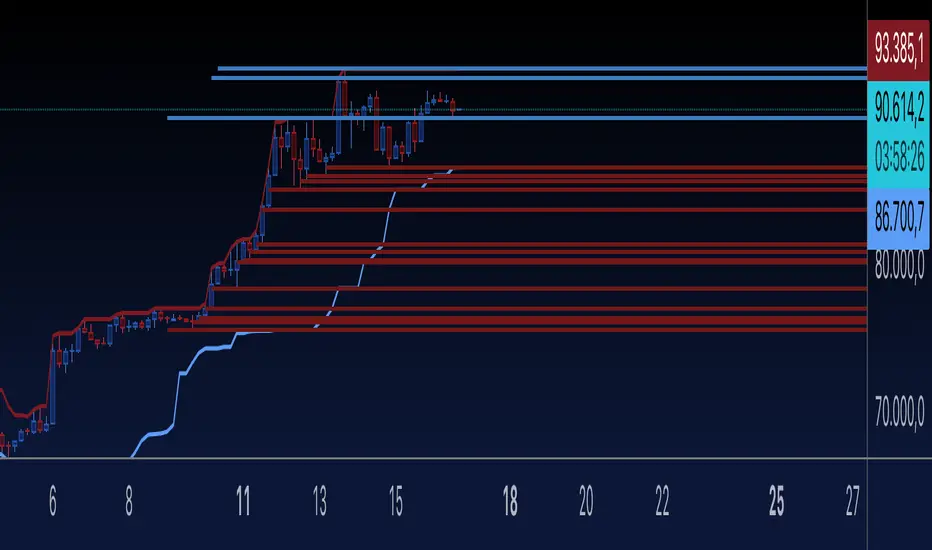
Dynamic Supply & Demand Zones- AYNETSummary of the Code: Dynamic Supply & Demand Zones
This Pine Script creates dynamic supply (resistance) and demand (support) zones on a chart by identifying the highest and lowest prices over a user-defined lookback period. It visualizes these zones with shaded regions and horizontal lines that dynamically adjust to price movements.
Key Features:
Dynamic Support Zone (Demand):
Calculated using the lowest price in the last lookback bars.
Creates a shaded region around this price, extended up and down by a user-defined zone width.
Horizontal lines clearly mark the top and bottom of the demand zone.
Dynamic Resistance Zone (Supply):
Calculated using the highest price in the last lookback bars.
Similarly, a shaded region and lines are drawn for this zone, representing supply.
Customizable Inputs:
lookback: Number of bars to calculate the highest and lowest prices.
zone_width: The buffer distance above/below the highest/lowest price to create the zone.
Colors: Separate color inputs for the fill and lines of support and resistance zones.
Dynamic Updates:
Both zones update automatically as new bars are added and the highest/lowest prices change.
Visual Representation:
The script uses plot to create shaded regions and line objects to draw horizontal boundaries.
How It Works:
Inputs:
The user provides a lookback period and zone_width.
Calculations:
Lowest price in the last lookback bars defines the support zone.
Highest price in the same period defines the resistance zone.
Plotting:
The zones are plotted with shaded regions and dynamic lines.
Use Case:
This indicator helps identify key price levels where supply (resistance) or demand (support) is likely to affect price movement.
Useful for traders who rely on support/resistance levels in their strategies.
Let me know if you'd like further enhancements or integrations! 😊

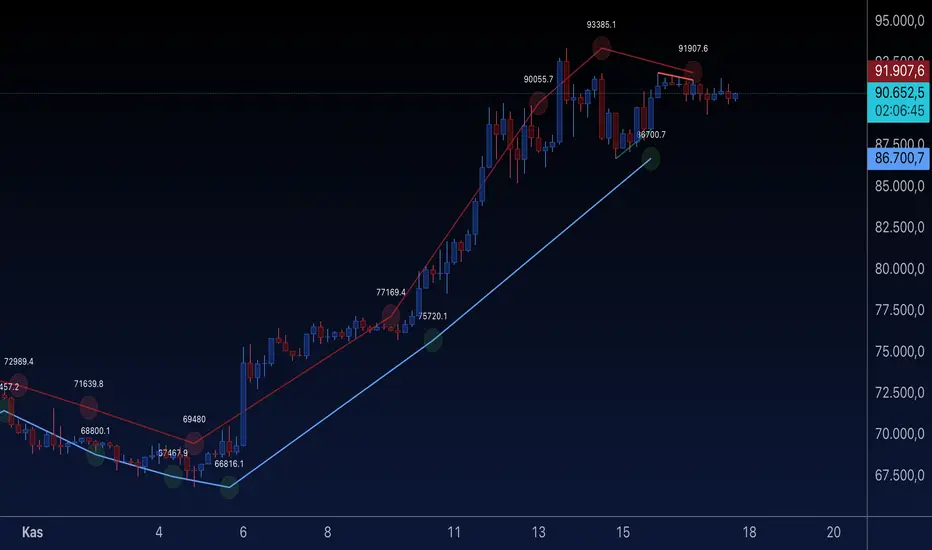
Dynamic Trend Lines-AYNETCode Summary: Dynamic Trend Lines
This code dynamically draws trend lines and labels based on swing highs and lows identified from historical price action.
Key Features
Swing Point Detection:
Uses the ta.pivothigh and ta.pivotlow functions to identify recent swing highs and swing lows based on a customizable lookback period.
Trend Lines:
Uptrend Line:
Draws a line connecting swing low points.
Colored in blue by default.
Downtrend Line:
Draws a line connecting swing high points.
Colored in red by default.
Lines dynamically adjust as new swing points are identified.
Labels:
Adds a circle-style label at each swing high and swing low.
Displays the price value of the swing point.
Labels have:
Green background for uptrends.
Red background for downtrends.
Customizable Inputs:
lookback: Sensitivity of swing point detection (higher value = fewer swings).
line_color_up and line_color_down: Colors for the trend lines.
label_bg_up and label_bg_down: Colors for the label backgrounds.
Auto Updates:
Trend lines and labels update dynamically as the chart progresses, ensuring they reflect the latest market conditions.
How It Works
Identify Swing Points:
Detects local highs and lows within the defined lookback period.
Draw Lines:
Uptrend lines are drawn from the most recent swing lows.
Downtrend lines are drawn from the most recent swing highs.
Add Labels:
Each swing point is labeled with its price value for easy reference.
Visual Output
Trend Lines:
Blue for uptrends, red for downtrends.
Labels:
Circular labels with price values:
Green for swing lows (uptrend points).
Red for swing highs (downtrend points).
Example Use Case
This script is useful for traders who want to:
Visually identify key trend lines based on swing highs and lows.
Understand the critical price points of market reversals.
Use labeled price points for informed trade decisions.
Let me know if you'd like any specific refinements! 😊
Quarterly Sine Wave with Moving Averages - AYNETDescription
Sine Wave:
The sine wave oscillates with a frequency determined by frequency.
Its amplitude (amplitude) and vertical offset (offset) are adjustable.
Moving Averages:
Includes options for different types of moving averages:
SMA (Simple Moving Average).
EMA (Exponential Moving Average).
WMA (Weighted Moving Average).
HMA (Hull Moving Average).
The user can choose the type (ma_type) and the length (ma_length) via inputs.
Horizontal Lines:
highest_hype and lowest_hype are horizontal levels drawn at the user-specified values.
Quarter Markers:
Vertical lines and labels (Q1, Q2, etc.) are drawn at the start of each quarter.
Customization Options
Moving Average Type:
Switch between SMA, EMA, WMA, and HMA using the dropdown menu.
Sine Wave Frequency:
Adjust the number of oscillations per year.
Amplitude and Offset:
Control the height and center position of the sine wave.
Moving Average Length:
Change the length for any selected moving average.
Output
This indicator plots:
A sine wave that oscillates smoothly over the year, divided into quarters.
A customizable moving average calculated based on the chosen price (e.g., close).
Horizontal lines for the highest and lowest hype levels.
Vertical lines and labels marking the start of each quarter.
Let me know if you need additional features! 😊

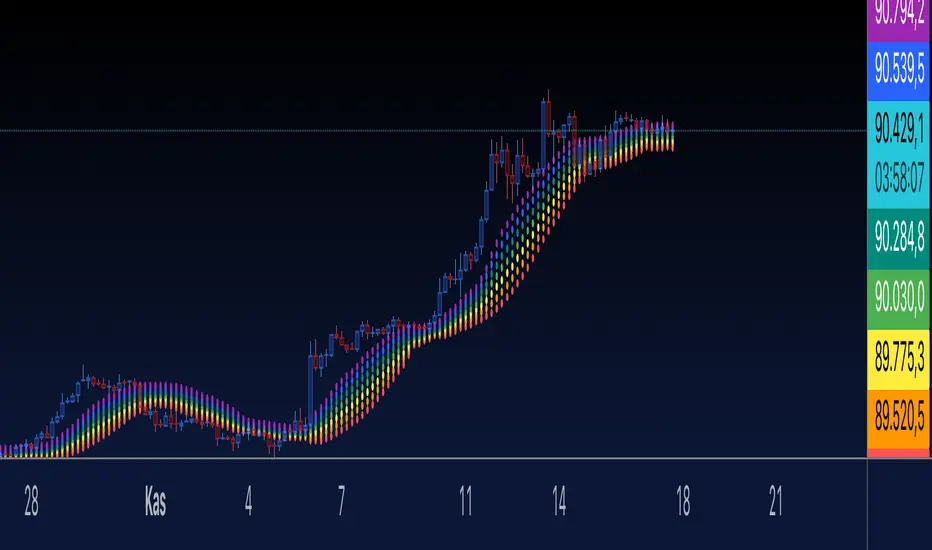
Rainbow MA- AYNETDescription
What it Does:
The Rainbow Indicator visualizes price action with a colorful "rainbow-like" effect.
It uses a moving average (SMA) and dynamically creates bands around it using standard deviation.
Features:
Seven bands are plotted, each corresponding to a different rainbow color (red to purple).
Each band is calculated using the moving average (ta.sma) and a smoothing multiplier (smooth) to control their spread.
User Inputs:
length: The length of the moving average (default: 14).
smooth: Controls the spacing between the bands (default: 0.5).
radius: Adjusts the size of the circular points (default: 3).
How it Works:
The bands are plotted above and below the moving average.
The offset for each band is calculated using standard deviation and a user-defined smoothing multiplier.
Plotting:
Each rainbow band is plotted individually using plot() with circular points (plot.style_circles).
Customization
You can modify the color palette, adjust the smoothing multiplier, or change the moving average length to suit your needs.
The number of bands can also be increased or decreased by adding/removing colors from the colors array and updating the loop.
If you have further questions or want to extend the indicator, let me know! 😊
Dynamic Support and Resistance -AYNETExplanation of the Code
Lookback Period:
The lookback input defines how many candles to consider when calculating the support (lowest low) and resistance (highest high).
Support and Resistance Calculation:
ta.highest(high, lookback) identifies the highest high over the last lookback candles.
ta.lowest(low, lookback) identifies the lowest low over the same period.
Dynamic Lines:
The line.new function creates yellow horizontal lines at the calculated support and resistance levels, extending them to the right.
Optional Plot:
plot is used to display the support and resistance levels as lines for visual clarity.
Customization:
You can adjust the lookback period and toggle the visibility of the lines via inputs.
How to Use This Code
Open the Pine Script Editor in TradingView.
Paste the above code into the editor.
Adjust the "Lookback Period for High/Low" to customize how the levels are calculated.
Enable or disable the support and resistance lines as needed.
This will create a chart similar to the one you provided, with horizontal yellow lines dynamically indicating the support and resistance levels. Let me know if you'd like any additional features or customizations!
Wick Trend Analysis with Supertrend and RSI -AYNETScientific Explanation
1. Wick Trend Analysis
Upper and Lower Wicks:
Calculated based on the difference between the high or low price and the candlestick body (open and close).
The trend of these wick lengths is derived using the Simple Moving Average (SMA) over the defined trend_length period.
Trend Direction:
Positive change (ta.change > 0) indicates an increasing trend.
Negative change (ta.change < 0) indicates a decreasing trend.
2. Supertrend Indicator
ATR Bands:
The Supertrend uses the Average True Range (ATR) to calculate dynamic upper and lower bands:
upper_band
=
hl2
+
(
supertrend_atr_multiplier
×
ATR
)
upper_band=hl2+(supertrend_atr_multiplier×ATR)
lower_band
=
hl2
−
(
supertrend_atr_multiplier
×
ATR
)
lower_band=hl2−(supertrend_atr_multiplier×ATR)
Trend Detection:
If the price is above the upper band, the Supertrend moves to the lower band.
If the price is below the lower band, the Supertrend moves to the upper band.
The Supertrend helps identify the prevailing market trend.
3. RSI (Relative Strength Index)
The RSI measures the momentum of price changes and ranges between 0 and 100:
Overbought Zone (Above 70): Indicates that the price may be overextended and due for a pullback.
Oversold Zone (Below 30): Indicates that the price may be undervalued and due for a reversal.
Visualization Features
Wick Trend Lines:
Upper wick trend (green) and lower wick trend (red) show the relative strength of price rejection on both sides.
Wick Trend Area:
The area between the upper and lower wick trends is filled dynamically:
Green: Upper wick trend is stronger.
Red: Lower wick trend is stronger.
Supertrend Line:
Displays the Supertrend as a blue line to highlight the market's directional bias.
RSI:
Plots the RSI line, with horizontal dotted lines marking the overbought (70) and oversold (30) levels.
Applications
Trend Confirmation:
Use the Supertrend and wick trends together to confirm the market's directional bias.
For example, a rising lower wick trend with a bullish Supertrend suggests strong bullish sentiment.
Momentum Analysis:
Combine the RSI with wick trends to assess the strength of price movements.
For example, if the RSI is oversold and the lower wick trend is increasing, it may signal a potential reversal.
Signal Generation:
Generate entry signals when all three indicators align:
Bullish Signal:
Lower wick trend increasing.
Supertrend bullish.
RSI rising from oversold.
Bearish Signal:
Upper wick trend increasing.
Supertrend bearish.
RSI falling from overbought.
Future Improvements
Alert System:
Add alerts for alignment of Supertrend, RSI, and wick trends:
pinescript
Kodu kopyala
alertcondition(upper_trend_direction == 1 and supertrend < close and rsi > 50, title="Bullish Signal", message="Bullish alignment detected.")
alertcondition(lower_trend_direction == 1 and supertrend > close and rsi < 50, title="Bearish Signal", message="Bearish alignment detected.")
Custom Thresholds:
Add thresholds for wick lengths and RSI levels to filter weak signals.
Multiple Timeframes:
Incorporate multi-timeframe analysis for more robust signal generation.
Conclusion
This script combines wick trends, Supertrend, and RSI to create a comprehensive framework for analyzing market sentiment and detecting potential trading opportunities. By visualizing trends, market bias, and momentum, traders can make more informed decisions and reduce reliance on single-indicator strategies.

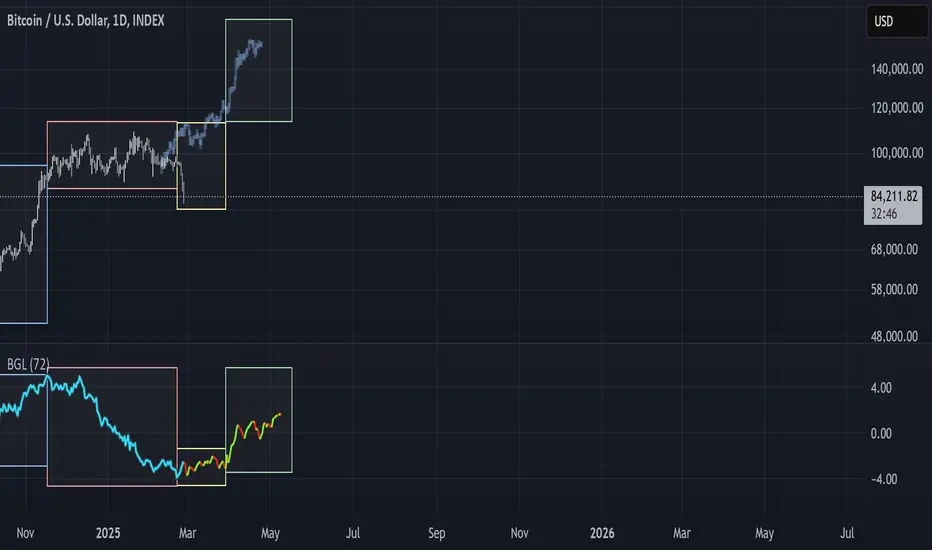
BGL - Bitcoin Global Liquidity Indicator [Da_Prof]This indicator takes global liquidity and shifts it forward by a set number of days. It can be used for any asset, but it is by default set for Bitcoin (BTC). The shift forward allows potential future prediction of BTC trends, especially uptrends. While not perfect, the current shift of 72 days seems to be best for the current cycle.
Sixteen currencies are used to calculate global liquidity.
Comprehensive Time Chain Indicator - AYNETFeatures and Enhancements
Dynamic Timeframe Handling:
The script monitors new intervals of a user-defined timeframe (e.g., daily, weekly, monthly).
Flexible interval selection allows skipping intermediate time periods (e.g., every 2 days).
Custom Marker Placement:
Markers can be placed at:
High, Low, or Close prices of the bar.
A custom offset above or below the close price.
Special Highlights:
Automatically detects the start of a week (Monday) and the start of a month.
Highlights these periods with a different marker color.
Connecting Lines:
Markers are connected with lines to visually link the events.
Line properties (color, width) are fully customizable.
Dynamic Labels:
Optional labels display the timestamp of the event, formatted as per user preferences (e.g., yyyy-MM-dd HH:mm).
How It Works:
Timeframe Event Detection:
The is_new_interval flag identifies when a new interval begins in the selected timeframe.
Special flags (is_new_week, is_new_month) detect key calendar periods.
Dynamic Marker Drawing:
Markers are drawn using label.new at the specified price levels.
Colors dynamically adjust based on the type of event (interval vs. special highlight).
Connecting Lines:
The script dynamically connects markers with line.new, creating a time chain.
Previous lines are updated for styling consistency.
Customization Options:
Timeframe (main_timeframe):
Adjust the timeframe for detecting new intervals, such as daily, weekly, or hourly.
Interval (interval):
Skip intermediate events (e.g., draw a marker every 2 days).
Visualization:
Enable or disable markers and labels independently.
Customize colors, line width, and marker positions.
Special Periods:
Highlight the start of a week or month with distinct markers.
Applications:
Event Tracking:
Highlight and connect key time intervals for easier analysis of patterns or trends.
Custom Time Chains:
Visualize periodic data, such as specific trading hours or cycles.
Market Session Analysis:
Highlight market opens, closes, or other critical time-based events.
Usage Instructions:
Copy and paste the code into the Pine Script editor on TradingView.
Adjust the input settings for your desired timeframe, visualization preferences, and special highlights.
Apply the script to a chart to see the time chain visualized.
This implementation provides robust functionality while remaining easy to customize. Let me know if further enhancements are required! 😊
[AWC] Vector -AYNETThis Pine Script code is a custom indicator designed for TradingView. Its purpose is to visualize the opening and closing prices of a specific timeframe (e.g., weekly, daily, or monthly) by drawing lines between these price points whenever a new bar forms in the specified timeframe. Below is a detailed explanation from a scientific perspective:
1. Input Parameters
The code includes user-defined inputs to customize its functionality:
tf1: This input defines the timeframe (e.g., 'W' for weekly, 'D' for daily). It determines the periodicity for analyzing price data.
icol: This input specifies the color of the lines drawn on the chart. Users can select from predefined options such as black, red, or blue.
2. Color Assignment
A switch statement maps the user’s color selection (icol) to the corresponding color object in Pine Script. This mapping ensures that the drawn lines adhere to the user's preference.
3. New Bar Detection
The script uses the ta.change(time(tf1)) function to determine when a new bar forms in the specified timeframe (tf1):
ta.change checks if the timestamp of the current bar differs from the previous one within the selected timeframe.
If the value changes, it indicates that a new bar has formed, and further calculations are triggered.
4. Data Request
The script employs request.security to fetch price data from the specified timeframe:
o1: Retrieves the opening price of the previous bar.
c1: Calculates the average price (high, low, close) of the previous bar using the hlc3 formula.
These values represent the key price levels for visualizing the line.
5. Line Drawing
When a new bar is detected:
The script uses line.new to create a line connecting the previous bar's opening price (o1) and the closing price (c1).
The line’s properties are defined as follows:
x1, y1: The starting point corresponds to the opening price at the previous bar index.
x2, y2: The endpoint corresponds to the closing price at the current bar index.
color: Uses the user-defined color (col).
style: The line style is set to line.style_arrow_right.
Additionally, the lines are stored in an array (lines) for later reference, enabling potential modifications or deletions.
6. Visual Outcome
The script visually represents price movements over the specified timeframe:
Each line connects the opening and closing price of a completed bar in the given timeframe.
The lines are drawn dynamically, updating whenever a new bar forms.
Scientific Context
This script applies concepts of time series analysis and visualization in financial data:
Time Segmentation: By isolating specific timeframes (e.g., weekly), the script provides a focused analysis of price behavior.
Price Dynamics: Connecting opening and closing prices highlights key price transitions within each period.
User Customization: The inclusion of inputs allows for adaptable use, accommodating different analytical preferences.
Applications
Trend Analysis: Identifies how price evolves between opening and closing levels across periods.
Market Behavior Comparison: Facilitates the observation of patterns or anomalies in price transitions over time.
Technical Indicators: Serves as a supplementary tool for decision-making in trading strategies.
If further enhancements or customizations are needed, let me know! 😊
Star of David Drawing-AYNETExplanation of Code
Settings:
centerTime defines the center time for the star pattern, defaulting to January 1, 2023.
centerPrice is the center Y-axis level for positioning the star.
size controls the overall size of the star.
starColor and lineWidth allow customization of the color and thickness of the lines.
Utility Function:
toRadians converts degrees to radians, though it’s not directly used here, it might be useful for future adjustments to angles.
Star of David Drawing Function:
The drawStarOfDavid function calculates the position of each point on the star relative to the center coordinates (centerTime, centerY) and size.
The pattern has six key points that form two overlapping triangles, creating the Star of David pattern.
The time offsets (offset1 and offset2) determine the horizontal spread of the star, scaling according to size.
The line.new function is used to draw the star lines with the calculated coordinates, casting timestamps to int to comply with line.new requirements.
Star Rendering:
Finally, drawStarOfDavid is called to render the Star of David pattern on the chart based on the input parameters.
This code draws the Star of David on a chart at a specified time and price level, with customizable size, color, and line width. Adjust centerTime, centerPrice, and size as needed for different star placements on the chart.
Straddle Charts - Live
Description :
This indicator is designed to display live prices for both call and put options of a straddle strategy, helping traders visualize the real-time performance of their options positions. The indicator allows users to select the symbols for specific call and put options and fetches their prices on a 1-minute timeframe, ensuring updated information.
Key Features :
Live Call and Put Option Prices: View individual prices for both call and put options of the straddle, plotted separately.
Straddle Price Calculation: The total price of the straddle (sum of call and put) is displayed, allowing for easy monitoring of the straddle’s combined movement.
Customizable Inputs: Easily change the call and put option symbols directly from the settings.
Use this indicator to stay on top of your straddle's value and make informed trading decisions based on real-time data.
