Yong Fin Growth on ChartBridge the gap between Fundamental Analysis and Technical Price Action.
Yong Fin Growth on Chart is the ultimate tool for "Hybrid Traders" and investors who need to visualize financial performance directly alongside price movements. Stop switching tabs between news sites and your charts—get the full context of why a stock is moving, right where it happens.
This indicator overlays key financial metrics onto your chart, triggered precisely by Earnings Announcements. It allows you to instantly correlate price reactions with fundamental catalysts like Revenue Growth, Margin Expansion, or EPS surprises.
Key Features:
🔹 1. Smart Earnings Trigger The indicator automatically detects Earnings Announcement dates and plots a data label on the exact bar.
Stocks: Aligns with the specific earnings release date to show immediate price reaction.
Funds/ETFs: Supports Fiscal Period End dates for broader instrument analysis.
Includes a vertical line option to visually separate fiscal periods for easy backtesting.
🔹 2. 5 Fully Customizable Data Slots Configure up to 5 independent slots to track the metrics that matter to your strategy. Choose from a comprehensive list including:
Growth: Revenue, Net Income, EBITDA, EPS.
Efficiency: Gross Margin (GPM), Net Margin (NPM), ROE, ROA.
Valuation: P/E, P/S, P/BV, EV/EBITDA, and Implied P/E.
Health: Cash, Debt, Net Debt, Free Cash Flow (FCF).
🔹 3. Dynamic Growth Coloring & Thresholds Instantly identify trend changes with intelligent color coding.
Comparison Modes: Toggle between YoY (Year-over-Year) or QoQ (Quarter-over-Quarter) growth logic.
Custom Thresholds: Define your own standards. For example, set the label to turn Green only if growth exceeds +15%, or Red if it falls below -5%. This helps filter out noise and highlights significant fundamental shifts.
🔹 4. Flexible Period Selection Analyze data across different timeframes to suit your trading style:
FQ: Fiscal Quarter (Short-term momentum)
FY: Fiscal Year (Long-term trend)
TTM: Trailing Twelve Months (Ideal for smooth Valuation ratios)
FH: Fiscal Half (For securities reporting semi-annually)
How to Use:
Add to Chart: Apply the indicator to any stock symbol.
Configure Slots: Go to settings and select the 5 metrics you want to monitor (e.g., Rev, Net Profit, GPM, NPM, P/E).
Set Color Logic: Choose whether you want to color-code based on YoY or QoQ growth.
Analyze: Look for the labels.
Are margins expanding while price is consolidating?
Did the price drop despite a "Green" label? (Market expectations vs. Reality)
Use the vertical lines to see how the trend changed after previous earnings reports.
"Stop guessing. Let the fundamentals guide your technical entries."
Disclaimer: This tool is for educational and analytical purposes only. Past performance does not guarantee future results. Please conduct your own due diligence.
---------------------------------
เชื่อมช่องว่างระหว่างการวิเคราะห์ปัจจัยพื้นฐาน (Fundamental) และกราฟราคาทางเทคนิค (Technical Price Action)
Yong Fin Growth on Chart คือเครื่องมือที่ดีที่สุดสำหรับ "นักลงทุนสายผสม (Hybrid Traders)" และนักลงทุนที่ต้องการเห็นผลประกอบการทางการเงินซ้อนทับไปกับการเคลื่อนไหวของราคาโดยตรง หยุดเสียเวลาสลับหน้าจอไปมาระหว่างเว็บข่าวและกราฟของคุณ—รับรู้บริบททั้งหมดว่าทำไมหุ้นถึงวิ่ง ได้ทันทีบนหน้าจอนี้
อินดิเคเตอร์นี้จะวางค่าทางการเงินที่สำคัญลงบนกราฟ โดยถูกกระตุ้น (Trigger) อย่างแม่นยำด้วย วันประกาศงบ (Earnings Announcements) ช่วยให้คุณเชื่อมโยงปฏิกิริยาของราคา เข้ากับปัจจัยพื้นฐานที่เป็นตัวขับเคลื่อนได้ทันที เช่น การเติบโตของรายได้, การขยายตัวของอัตรากำไร (Margin), หรือกำไรต่อหุ้น (EPS) ที่เซอร์ไพรส์ตลาด
ฟีเจอร์หลัก:
🔹 1. Smart Earnings Trigger (ตัวระบุวันงบออกอัจฉริยะ) อินดิเคเตอร์จะตรวจจับวันประกาศงบอัตโนมัติและพลอตป้ายข้อมูล (Label) ลงบนแท่งเทียนนั้นเป๊ะๆ
หุ้นรายตัว: ตรงกับวันประกาศผลประกอบการจริง เพื่อดูปฏิกิริยาราคาทันที
กองทุน/ETFs: รองรับวันปิดรอบบัญชี (Fiscal Period End) สำหรับการวิเคราะห์สินทรัพย์ประเภทอื่นๆ
มีออปชั่นเส้นแนวตั้ง เพื่อแบ่งช่วงเวลางบแต่ละรอบ ให้ดูย้อนหลัง (Backtest) ได้ง่าย
🔹 2. 5 Fully Customizable Data Slots (ช่องข้อมูลปรับแต่งได้ 5 ช่อง) ตั้งค่าได้ถึง 5 ช่องอิสระ เพื่อติดตามตัวเลขที่สำคัญต่อกลยุทธ์ของคุณ เลือกจากรายการที่ครอบคลุม เช่น:
การเติบโต (Growth): Revenue, Net Income, EBITDA, EPS
ประสิทธิภาพ (Efficiency): Gross Margin (GPM), Net Margin (NPM), ROE, ROA
มูลค่า (Valuation): P/E, P/S, P/BV, EV/EBITDA, และ Implied P/E (ค่าพิเศษที่คุณใส่สูตรไว้)
สุขภาพการเงิน (Health): Cash, Debt, Net Debt, Free Cash Flow (FCF)
🔹 3. Dynamic Growth Coloring & Thresholds (ระบบสีและการตั้งเกณฑ์) ระบุการเปลี่ยนเทรนด์ได้ทันทีด้วยรหัสสีอัจฉริยะ
โหมดเปรียบเทียบ: เลือกสลับได้ระหว่าง YoY (เทียบปีก่อน) หรือ QoQ (เทียบไตรมาสก่อน)
เกณฑ์ที่กำหนดเอง (Custom Thresholds): กำหนดมาตรฐานของคุณเอง ตัวอย่างเช่น ตั้งค่าให้ป้ายเป็น สีเขียว เฉพาะเมื่อโตเกิน +15% หรือเป็น สีแดง เมื่อต่ำกว่า -5% สิ่งนี้ช่วยกรอง Noise และเน้นเฉพาะการเปลี่ยนแปลงพื้นฐานที่มีนัยสำคัญ
🔹 4. Flexible Period Selection (เลือกช่วงเวลาได้ยืดหยุ่น) วิเคราะห์ข้อมูลในกรอบเวลาที่แตกต่างกันตามสไตล์การเทรด:
FQ: รายไตรมาส (Fiscal Quarter) - ดูโมเมนตัมระยะสั้น
FY: รายปี (Fiscal Year) - ดูเทรนด์ระยะยาว
TTM: 12 เดือนย้อนหลัง (Trailing Twelve Months) - เหมาะสำหรับดูค่า Valuation Ratio ให้สมูท
FH: ครึ่งปี (Fiscal Half) - สำหรับหลักทรัพย์ที่ส่งงบแบบครึ่งปี
วิธีใช้งาน:
Add to Chart: ใส่อินดิเคเตอร์ลงในกราฟหุ้นตัวใดก็ได้
Configure Slots: ไปที่การตั้งค่าและเลือก 5 ค่าที่คุณต้องการเฝ้าดู (เช่น Rev, Net Profit, GPM, NPM, P/E)
Set Color Logic: เลือกตรรกะสี ว่าจะให้อิงตามการเติบโตแบบ YoY หรือ QoQ
Analyze: สังเกตป้ายข้อมูล
อัตรากำไร (Margin) ขยายตัวในขณะที่ราคากำลังพักตัวอยู่หรือเปล่า?
ราคาดิ่งลงทั้งๆ ที่ป้ายเป็น "สีเขียว" หรือไม่? (ความคาดหวังตลาด vs ความจริง)
ใช้เส้นแนวตั้งเพื่อดูว่าเทรนด์เปลี่ยนไปอย่างไรหลังจากงบออกในรอบก่อนๆ
"เลิกเดา ให้ปัจจัยพื้นฐานนำทางจุดเข้าซื้อทางเทคนิคของคุณ"
คำเตือน: เครื่องมือนี้มีไว้เพื่อการศึกษาและวิเคราะห์ข้อมูลเท่านั้น ผลการดำเนินงานในอดีตไม่การันตีผลลัพธ์ในอนาคต โปรดศึกษาข้อมูลด้วยตนเอง
Financials

EPS Trendline (Fundamentals Insight by Mazhar Karimi)Overview
This indicator visualizes a company’s Earnings Per Share (EPS) data directly on the chart—pulled from TradingView’s fundamental database—and applies a dynamic linear regression trendline to highlight the long-term direction of earnings growth or decline.
It’s designed to help investors and quantitative traders quickly see how the company’s profitability (EPS) has evolved over time and whether it’s trending upward (growth), flat (stagnant), or downward (decline).
How it Works
Uses request.financial() to fetch EPS data (Diluted or Basic).
You can select whether to use TTM (Trailing Twelve Months), FQ (Fiscal Quarter), or FY (Fiscal Year) data.
The script fits a regression line (using ta.linreg) over a configurable window to visualize the underlying EPS trend.
Updates automatically when new financial data is released.
Inputs
EPS Period: Choose between FQ / FY / TTM
Use Diluted EPS: Toggle to compare Diluted vs. Basic EPS
Regression Window: Adjust how many bars are used to fit the trendline
Interpretation Tips
A rising trendline indicates earnings momentum and potential investor confidence.
A flat or declining trendline may warn of profitability slowdowns.
Combine with price action or valuation ratios (like P/E) for deeper analysis.
Works best on stocks or ETFs with fundamental data (not available for crypto or FX).
Suggestions / Use Cases
Pair with Price/Earnings ratio indicators to evaluate valuation vs. fundamentals.
Use in conjunction with earnings release events for context.
Ideal for long-term investors, swing traders, or fundamental quants tracking financial health trends.
Future Enhancements (Planned Ideas)
🔹 Option to display multiple regression lines (short-term and long-term)
🔹 Support for comparing multiple tickers’ EPS in the same pane
🔹 Integration with Net Income, Revenue, or Free Cash Flow trends
🔹 Add a “Rate of Change” signal for momentum-based EPS analysis

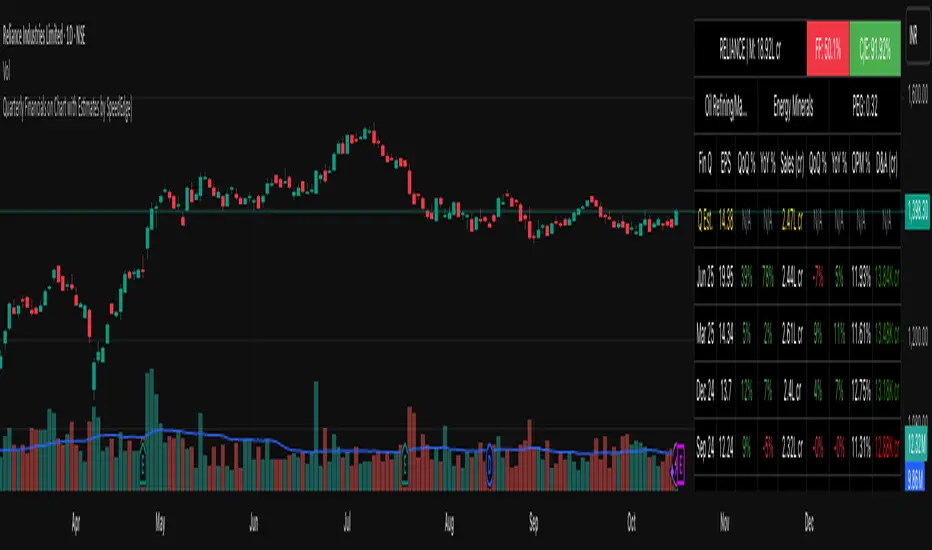
Quarterly Financials on Chart with Estimates by SpeedEdge)# Quarterly Financials on Chart with Estimates
## WHAT THIS SCRIPT DOES
This indicator displays comprehensive quarterly financial data directly on your trading chart, eliminating the need to switch between charting and fundamental analysis platforms. The script automatically fetches and organizes key financial metrics including earnings per share (EPS), revenue, operating margins, depreciation & amortization, and quarterly estimates alongside actual results for comparative analysis.
## WHY THIS COMBINATION IS ORIGINAL AND USEFUL
**The Problem Solved:** Traders conducting fundamental analysis typically need to toggle between trading charts and separate financial platforms to view quarterly results, estimates, and year-over-year comparisons. This workflow is inefficient and makes it difficult to correlate price movements with earnings announcements.
**The Solution:** This script integrates fundamental financial data directly into the price chart environment, providing:
- Side-by-side comparison of quarterly estimates versus actual results
- Automatic calculation of Quarter-over-Quarter (QoQ) and Year-over-Year (YoY) growth rates
- Color-coded visualization of financial performance trends
- Regional number formatting (Indian Crores or Global Billions/Millions)
- Key valuation metrics (Market Cap, Free Float, PEG Ratio, CFO/EBITDA) in header
**Unique Features:**
1. **Dual Number Format System**: Automatically formats financial figures in Indian Crores (Cr, K Cr, L Cr) or Global formats (M, B, T) based on user preference
2. **Estimate Integration**: Shows analyst estimates for upcoming quarters alongside historical actuals for beat/miss analysis
3. **Intelligent Growth Analysis**: Automatically calculates and color-codes quarterly and yearly growth comparisons with smart handling of missing data
4. **Context-Aware Color Coding**: Green/red visualization adapts based on metric type - growth metrics, cash flow quality indicators, and expense trends each use appropriate color logic
5. **Configurable History**: Display 4 to 20 previous quarters based on analysis needs
## HOW THE SCRIPT WORKS TECHNICALLY
### Core Methodology:
**1. Financial Data Integration:**
The script accesses quarterly and annual financial statement data from public company filings, including:
- **Earnings Estimates**: Analyst consensus forecasts for upcoming quarters
- **Quarterly Actuals**: Reported earnings per share, revenue, margins, and operating expenses
- **Key Ratios**: Shares outstanding data, valuation multiples, and cash flow metrics
All data is sourced from TradingView's fundamental database, which aggregates information from official regulatory filings (10-Q, 10-K, annual reports) filed by publicly traded companies.
**2. Historical Data Organization:**
The script employs a sophisticated data structure system that:
- Detects when new quarterly results are released by monitoring data changes
- Automatically indexes financial data by quarters relative to the current date
- Creates a chronological timeline of financial performance
- Maintains historical records for comparison calculations
- Updates dynamically as new earnings are reported
**3. Intelligent Number Formatting:**
**Indian Regional Format:**
- Converts absolute values to Crore denomination (1 Crore = 10 Million)
- Scales to Thousand Crores (K Cr) for mid-size companies
- Scales to Lakh Crores (L Cr) for large corporations
- Appropriate for analyzing Indian market stocks
**Global Standard Format:**
- Uses Million (M) for smaller companies
- Scales to Billion (B) for mid-cap and large-cap stocks
- Uses Trillion (T) for mega-cap corporations
- Thousands (K) for smaller financial figures
- Standard across US and international markets
**4. Comparative Growth Analysis:**
**Quarter-over-Quarter (QoQ) Calculations:**
The script compares each quarter's performance against the immediately preceding quarter to identify:
- Sequential growth trends
- Momentum acceleration or deceleration
- Short-term business trajectory
- Seasonal pattern changes
**Year-over-Year (YoY) Calculations:**
Compares each quarter against the same quarter from the previous year to:
- Eliminate seasonal effects
- Identify sustainable growth trends
- Normalize for business cycles
- Provide apples-to-apples comparison
Both calculations automatically handle edge cases like missing data, account for different fiscal year conventions, and provide meaningful "N/A" indicators when comparative data is unavailable.
**5. Adaptive Color Coding System:**
**Growth Metrics (EPS, Revenue):**
- Positive growth → Green shading indicates improving performance
- Negative growth → Red shading signals declining performance
- Missing data → Gray indicates insufficient information
**Quality Indicators (Free Float %):**
- Lower float (<40%) → Green indicates potentially better supply-demand dynamics
- Higher float (≥40%) → Red suggests more diluted ownership
**Cash Flow Quality (CFO/EBITDA):**
- Strong cash conversion (≥50%) → Green shows quality earnings
- Weak cash conversion (<50%) → Red flags potential accounting concerns
**Expense Trends (Depreciation & Amortization):**
- Decreasing D&A → Green indicates improving cash flow characteristics
- Increasing D&A → Red suggests rising capital intensity
- Stable D&A → Default color shows consistency
**Future Estimates:**
- Yellow coloring clearly distinguishes forward-looking estimates from historical actuals
**6. Date and Quarter Intelligence:**
The script automatically:
- Determines the current financial quarter based on real-time date
- Maps calendar months to fiscal quarters (Q1-Q4)
- Handles different fiscal year conventions globally
- Calculates quarter differentials for accurate historical lookback
- Formats display labels showing quarter-end months and years (e.g., "Mar 24", "Dec 23")
### Advanced Calculations:
**Free Float Percentage:**
Calculates the proportion of shares available for public trading relative to total shares outstanding. Lower percentages indicate more concentrated ownership, which can affect volatility and liquidity.
**Market Capitalization:**
Real-time calculation using total shares outstanding multiplied by current market price, automatically updated with each price tick and formatted according to regional preferences.
**CFO/EBITDA Cash Quality Ratio:**
Measures what percentage of accounting earnings converts to actual operating cash flow. Higher ratios indicate better earnings quality and less aggressive accounting. Industry standards vary, but 60-100% typically signals strong cash generation.
**Operating Profit Margin Tracking:**
Monitors the percentage of revenue retained as operating profit after deducting operating expenses, providing insight into operational efficiency and pricing power trends.
## HOW TO USE THIS SCRIPT
### Initial Setup:
**1. Region Configuration:**
- **India**: Select for Indian stocks - formats numbers in Crores (₹10M = 1 Cr)
- **Global**: Select for international stocks - formats in Millions/Billions
**2. Display Settings:**
- **Position**: Choose table location on chart (Top Right recommended)
- **Table Size**: Adjust based on screen resolution (Normal is default)
- **Short Labels**: Enable to condense industry/sector names for space saving
- **Lookback Quarters**: Set how many previous quarters to display (4-20, default 5)
**3. Visual Customization:**
- **Background Color**: Customize table background color and transparency
- **Text Color**: Adjust text color for visibility
- **Border/Frame Colors**: Modify table borders for preferred appearance
### Reading the Dashboard:
**Header Section (Top 3 Rows):**
**Row 1:**
- **Ticker | Mcap**: Company symbol and current market capitalization
- **FF (Free Float)**: Percentage of freely traded shares (Green < 40% is positive, Red ≥ 40%)
- **CFO/EBITDA**: Cash flow quality ratio (Green ≥ 50% is positive, Red < 50%)
**Row 2:**
- **Industry**: Company's specific industry classification
- **Sector**: Broader sector classification
- **PEG Ratio**: Price/Earnings to Growth ratio (< 1 traditionally considered undervalued)
**Data Section:**
**Column Explanations:**
1. **Fin Q**: Financial quarter (format: "Mar 24" = Q4 FY2024 ending March)
2. **EPS**: Earnings Per Share in reporting currency
3. **QoQ %**: EPS growth versus previous quarter (Green = increase, Red = decrease)
4. **YoY %**: EPS growth versus same quarter last year
5. **Sales**: Total revenue (formatted in Cr or M/B based on region)
6. **QoQ %**: Revenue growth versus previous quarter
7. **YoY %**: Revenue growth versus same quarter last year
8. **OPM %**: Operating Profit Margin percentage
9. **D&A**: Depreciation & Amortization (Green if decreasing = cash flow positive)
**Estimates Row (Yellow Text):**
- Shows "Q Est." for upcoming quarter
- Displays analyst consensus estimates for EPS and Sales
- Compare actuals against estimates after earnings release to identify beats/misses
### Trading Applications:
**Fundamental Analysis:**
- **Earnings Quality Check**: Look for consistent QoQ and YoY growth in both EPS and Sales
- **Margin Trend Analysis**: Monitor OPM % changes to assess operational efficiency
- **Estimate Comparison**: Identify stocks that consistently beat or miss estimates
- **Cash Flow Validation**: Use CFO/EBITDA ratio to verify earnings quality
**Entry/Exit Timing:**
- **Post-Earnings Analysis**: Check if stock beat estimates and by what margin
- **Trend Confirmation**: Strong YoY growth + improving margins = positive fundamentals
- **Warning Signs**: Declining margins, negative growth, or deteriorating CFO/EBITDA
**Portfolio Screening:**
- **Growth Stocks**: Look for consistent QoQ and YoY EPS/Sales growth
- **Value Stocks**: Low PEG ratios combined with positive fundamentals
- **Quality Filter**: High CFO/EBITDA ratios (>75%) indicate superior cash generation
### Interpretation Guidelines:
**Strong Fundamental Setup:**
- YoY growth > 15% in both EPS and Sales
- QoQ growth positive for 2+ consecutive quarters
- OPM % stable or improving
- CFO/EBITDA > 60%
- Actual results exceed estimates
**Concerning Signals:**
- Declining YoY growth rates
- Shrinking operating margins
- Consistently missing estimates
- CFO/EBITDA < 40%
- Increasing D&A as percentage of revenue
## IMPORTANT USAGE NOTES
**Data Limitations:**
- Financial data depends on official company filings and reporting schedules
- Some stocks may have incomplete historical data depending on listing history
- Estimates may not be available for all companies, especially smaller-cap stocks
- Data updates occur after official earnings releases, not in real-time during announcements
**Realistic Expectations:**
- This tool displays historical fundamental data for analysis - not predictive signals
- Always verify critical financial data with official company filings when making investment decisions
- Fundamental analysis should complement technical analysis, not replace it
- Past financial performance does not guarantee future results
- Earnings estimates are analyst opinions, not certainties
**Best Practices:**
- Cross-reference important data points with company investor relations pages
- Consider industry-specific metrics beyond the displayed general figures
- Use in conjunction with technical indicators for comprehensive analysis
- Monitor for data anomalies (stock splits, accounting changes, restatements) that may affect comparisons
- Understand that different accounting standards (GAAP vs IFRS) may affect international comparisons
**Regional Considerations:**
- Indian stocks: Numbers in Crores (1 Cr = 10 Million Rupees)
- Global stocks: Numbers in standard M/B/T format
- Currency conversions are not performed - data shown in reporting currency
- Fiscal year conventions vary by region (India typically uses Apr-Mar fiscal year, US uses Jan-Dec or custom fiscal years)
- Different markets have different reporting timelines and requirements
## CONFIGURATION RECOMMENDATIONS
**For Indian Stocks:**
- Region: India
- Lookback: 5-8 quarters (recommended)
- Focus on YoY growth due to seasonal business patterns in many Indian companies
**For US/Global Stocks:**
- Region: Global
- Lookback: 4-6 quarters for tech/growth stocks
- Lookback: 8-12 quarters for cyclical/industrial stocks
- Monitor QoQ trends closely for rapid-growth sectors
**For Long-term Investors:**
- Increase lookback to 12-20 quarters to see multi-year trends
- Focus on consistency rather than individual quarter volatility
- Pay close attention to CFO/EBITDA quality metric for sustainable businesses
- Look for stable or improving margins over extended periods
**For Active Traders:**
- Use 4-6 quarter lookback for recent trend focus
- Concentrate on latest QoQ trends and estimate beats/misses
- Monitor table closely before/after earnings announcements
- Compare estimate versus actual immediately post-earnings for trading opportunities
**For Swing Traders:**
- 6-8 quarter lookback provides good balance
- Focus on acceleration/deceleration in growth rates
- Use margin trends to identify operational inflection points
- Combine with technical analysis for optimal entry/exit timing
This script serves as a comprehensive fundamental analysis tool for traders and investors who want seamless chart integration of financial data without workflow interruption, enabling faster and more informed decision-making.
Intrinsic Value AnalyzerThe Intrinsic Value Analyzer is an all-in-one valuation tool that automatically calculates the fair value of a stock using industry-standard valuation techniques. It estimates intrinsic value through Discounted Cash Flow (DCF), Enterprise Value to Revenue (EV/REV), Enterprise Value to EBITDA (EV/EBITDA), and Price to Earnings (P/EPS). The model features adjustable parameters and a built-in alert system that notifies investors in real time when valuation multiples reach predefined thresholds. It also includes a comprehensive, color-coded table that compares the company’s historical average growth rates, valuation multiples, and financial ratios with the most recent values, helping investors quickly assess how current values align with historical averages.
The model calculates the historical Compounded Annual Growth Rates (CAGR) and average valuation multiples over the selected Lookback Period. It then projects Revenue, Earnings Before Interest, Taxes, Depreciation, and Amortization (EBITDA), Earnings per Share (EPS), and Free Cash Flow (FCF) for the selected Forecast Period and discounts their future values back to the present using the Weighted Average Cost of Capital (WACC) or the Cost of Equity. By default, the model automatically applies the historical averages displayed in the table as the growth forecasts and target multiples. These assumptions can be modified in the menu by entering custom REV-G, EBITDA-G, EPS-G, and FCF-G growth forecasts, as well as EV/REV, EV/EBITDA, and P/EPS target multiples. When new input values are entered, the model recalculates the fair value in real time, allowing users to see how changes in these assumptions affect the company’s fair value.
DCF = (Sum of (FCF × (1 + FCF-G) ^ t ÷ (1 + WACC) ^ t) for each year t until Forecast Period + ((FCF × (1 + FCF-G) ^ Forecast Period × (1 + LT Growth)) ÷ ((WACC - LT Growth) × (1 + WACC) ^ Forecast Period)) + Cash - Debt - Preferred Equity - Minority Interest) ÷ Shares Outstanding
EV/REV = ((Revenue × (1 + REV-G) ^ Forecast Period × EV/REV Target) ÷ (1 + WACC) ^ Forecast Period + Cash - Debt - Preferred Equity - Minority Interest) ÷ Shares Outstanding
EV/EBITDA = ((EBITDA × (1 + EBITDA-G) ^ Forecast Period × EV/EBITDA Target) ÷ (1 + WACC) ^ Forecast Period + Cash - Debt - Preferred Equity - Minority Interest) ÷ Shares Outstanding
P/EPS = (EPS × (1 + EPS-G) ^ Forecast Period × P/EPS Target) ÷ (1 + Cost of Equity) ^ Forecast Period
The discounted one-year average analyst price target (1Y PT) is also displayed alongside the valuation labels to provide an overview of consensus estimates. For the DCF model, the terminal long-term FCF growth rate (LT Growth) is based on the selected country to reflect expected long-term nominal GDP growth and can be modified in the menu. For metrics involving FCF, users can choose between reported FCF, calculated as Cash From Operations (CFO) - Capital Expenditures (CAPEX), or standardized FCF, calculated as Earnings Before Interest and Taxes (EBIT) × (1 - Average Tax Rate) + Depreciation and Amortization - Change in Net Working Capital - CAPEX. Historical average values displayed in the left column of the table are based on Fiscal Year (FY) data, while the latest values in the right column use the most recent Trailing Twelve Month (TTM) or Fiscal Quarter (FQ) data. The indicator displays color-coded price labels for each fair value estimate, showing the percentage upside or downside from the current price. Green indicates undervaluation, while red indicates overvaluation. The table follows a separate color logic:
REV-G, EBITDA-G, EPS-G, FCF-G = Green indicates positive annual growth when the CAGR is positive. Red indicates negative annual growth when the CAGR is negative.
EV/REV = Green indicates undervaluation when EV/REV ÷ REV-G is below 1. Red indicates overvaluation when EV/REV ÷ REV-G is above 2. Gray indicates fair value.
EV/EBITDA = Green indicates undervaluation when EV/EBITDA ÷ EBITDA-G is below 1. Red indicates overvaluation when EV/EBITDA ÷ EBITDA-G is above 2. Gray indicates fair value.
P/EPS = Green indicates undervaluation when P/EPS ÷ EPS-G is below 1. Red indicates overvaluation when P/EPS ÷ EPS-G is above 2. Gray indicates fair value.
EBITDA% = Green indicates profitable operations when the EBITDA margin is positive. Red indicates unprofitable operations when the EBITDA margin is negative.
FCF% = Green indicates strong cash conversion when FCF/EBITDA > 50%. Red indicates unsustainable FCF when FCF/EBITDA is negative. Gray indicates normal cash conversion.
ROIC = Green indicates value creation when ROIC > WACC. Red indicates value destruction when ROIC is negative. Gray indicates positive but insufficient returns.
ND/EBITDA = Green indicates low leverage when ND/EBITDA is below 1. Red indicates high leverage when ND/EBITDA is above 3. Gray indicates moderate leverage.
YIELD = Green indicates positive shareholder return when Shareholder Yield > 1%. Red indicates negative shareholder return when Shareholder Yield < -1%.
The Return on Invested Capital (ROIC) is calculated as EBIT × (1 - Average Tax Rate) ÷ (Average Debt + Average Equity - Average Cash). Shareholder Yield (YIELD) is calculated as the CAGR of Dividend Yield - Change in Shares Outstanding. The Weighted Average Cost of Capital (WACC) is displayed at the top left of the table and is derived from the current Market Cap (MC), Debt, Cost of Equity, and Cost of Debt. The Cost of Equity is calculated using the Equity Beta, Index Return, and Risk-Free Rate, which are based on the selected country. The Equity Beta (β) is calculated as the 5-year Blume-adjusted beta between the weekly logarithmic returns of the underlying stock and the selected country’s stock market index. For accurate calculations, it is recommended to use the stock ticker listed on the primary exchange corresponding to the company’s main index.
Cost of Debt = (Interest Expense on Debt ÷ Average Debt) × (1 - Average Tax Rate)
Cost of Equity = Risk-Free Rate + Equity Beta (β) × (Index Return - Risk-Free Rate)
WACC = (MC ÷ (MC + Debt)) × Cost of Equity + (Debt ÷ (MC + Debt)) × Cost of Debt
This indicator works best for operationally stable and profitable companies that are primarily valued based on fundamentals rather than speculative growth, such as those in the industrial, consumer, technology, and healthcare sectors. It is less suitable for early-stage, unprofitable, or highly cyclical companies, including energy, real estate, and financial institutions, as these often have irregular cash flows or distorted balance sheets. It is also worth noting that TradingView’s financial data provider, FactSet, standardizes financial data from official company filings to align with a consistent accounting framework. While this improves comparability across companies, industries, and countries, it may also result in differences from officially reported figures.
In summary, the Intrinsic Value Analyzer is a comprehensive valuation tool designed to help long-term investors estimate a company’s fair value while comparing historical averages with the latest values. Fair value estimates are driven by growth forecasts, target multiples, and discount rates, and should always be interpreted within the context of the underlying assumptions. By default, the model applies historical averages and current discount rates, which may not accurately reflect future conditions. Investors are therefore encouraged to adjust inputs in the menu to better understand how changes in these key assumptions influence the company’s fair value.

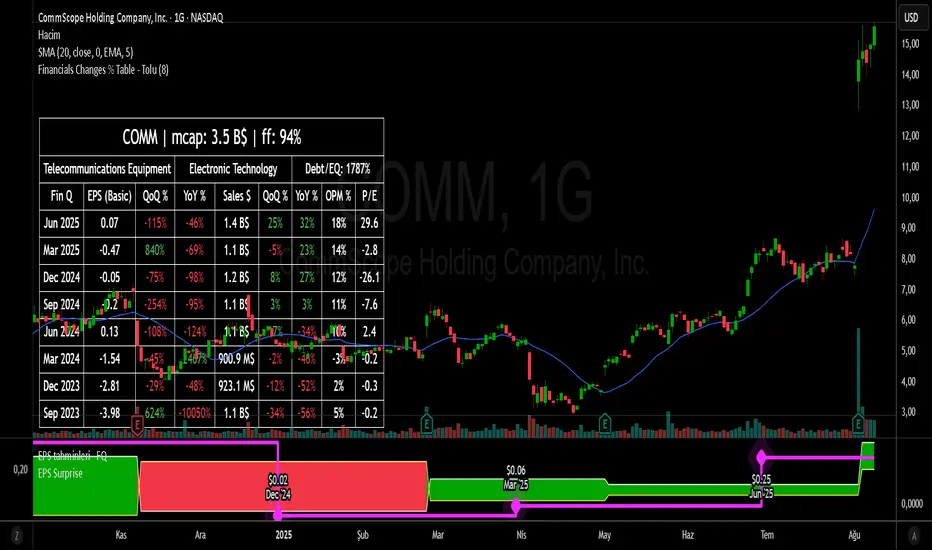
Financial Change % Table - ToluFinancial Change % Table which includes revenue , operating profit and earning per share . compares the financial data with previous quarter QoQ and previous year YoY . and shows the change in %.
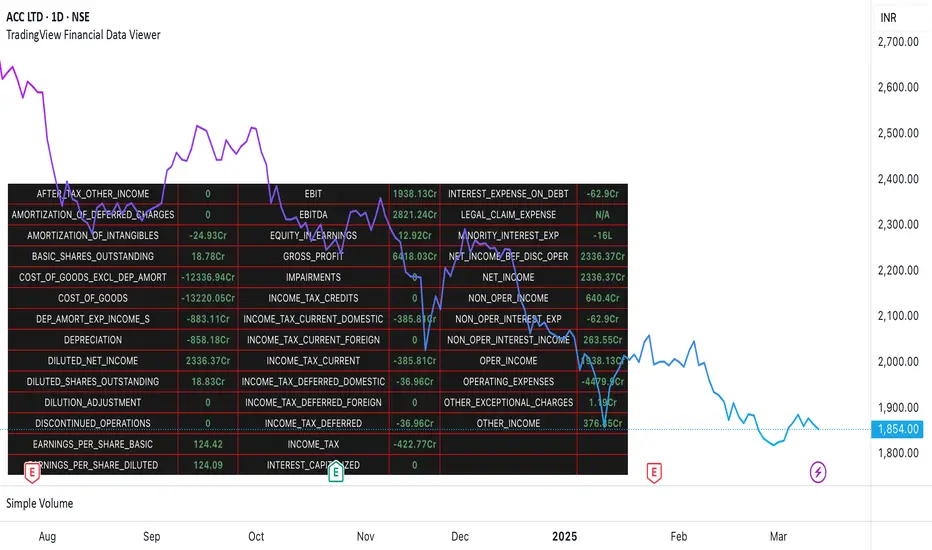
TradingView Financial Data ViewerTrading view provides request.security function to view the financial information of a script. The available sets of data is documented on below link
www.tradingview.com
The problem is there is no easy way to view this data as there are limitations to the # of unique requests that can be made. The limit is 40 for general paid accounts. So its makes it impossible to view the data in case you are looking to build a plugin related to some financial analysis.
So I came up with this trading view plugin which based on the documentation bifurcates the values available in the FQ, TTM and FY periods. Then you can select which period you would like to see. How many values you want to see at a time. And then next set of data can be viewed by increasing the Set # from 1 to which ever number keeps giving you the data.
Notes:
This is a data view only indicator and it will only display the latest data available for which quarter was there.
In case you want to view past data then you should go to replay mode and cut to the relative earning tags where you want to view the data
This is again for educational or study purpose only and is majorly helpful for those who want to create indicators based on Trading view supported financials and want to view what values are given for specific financial ids
The documentation reference and source of the plugin can be checked
PE Ratio Intrinsic ValueThe "Median PE Ratio and Intrinsic Value" indicator is designed for traders and investors who wish to evaluate the intrinsic value of a stock based on a comparative analysis of Price-to-Earnings (PE) ratios across multiple stocks. This tool not only provides insights into whether a stock is undervalued or overvalued but also allows you to visualize the intrinsic value directly on the chart.
Comparison Across Multiple Stocks:
This indicator calculates the PE ratio for up to five different stocks, allowing you to compare the target stock's valuation against four other same sector companies. By default, the stocks included are Apple (AAPL), Google (GOOG), Microsoft (MSFT), and Amazon (AMZN), but you can customize these symbols to fit your analysis needs.
Dynamic PE Ratio Calculation:
The indicator calculates the PE ratio for each stock by dividing the current price by the earnings per share (EPS). The EPS data is retrieved based on the selected period, which can be one of the following:
FY (Fiscal Year)
FH (Fiscal Half-Year)
FQ (Fiscal Quarter)
TTM (Trailing Twelve Months)
You can easily switch between these periods using the provided input options, enabling a more customized analysis based on your preferred financial timeframe.
Once the PE ratios for the selected stocks are computed, the indicator calculates the average PE ratio. The average value is a robust measure that reduces the influence of outliers and provides a balanced view of market valuation.
The intrinsic value of the stock on the chart is calculated by multiplying its EPS by the median PE ratio of the selected stocks. This gives you an estimate of what the stock should be worth if it were to trade at a fair valuation relative to the chosen peers.
The intrinsic value is plotted directly on the price chart as a step line with breaks. This step line style is chosen to represent changes in intrinsic value clearly, with breaks indicating periods where the calculated value is not valid (e.g., negative intrinsic value). Only positive intrinsic values are displayed, helping you focus on meaningful data.
You can easily customize the stocks analyzed by entering the ticker symbols of your choice. Additionally, the indicator allows you to adjust the timeframe for EPS data, giving you flexibility depending on whether you are focused on long-term trends or shorter financial periods.
How to Use:
Compare the current stock price to the plotted intrinsic value. If the current price is below the intrinsic value, the stock may be undervalued. Conversely, if the price is above the intrinsic value, the stock might be overvalued. By comparing your stock against major market players, you can gauge whether it's trading at a premium or discount relative to other key companies in the sector. Use the period selection (FY, FQ, TTM) to adapt your analysis to different market conditions or earnings cycles, giving you more control over your valuation assessment.
Ideal For:
Long-term Investors looking to assess the intrinsic value of a stock based on comparative analysis.
Fundamental Analysts who want to combine multiple stocks' PE ratios to estimate a fair valuation.
Value Investors interested in finding undervalued opportunities by comparing the market price to intrinsic value.

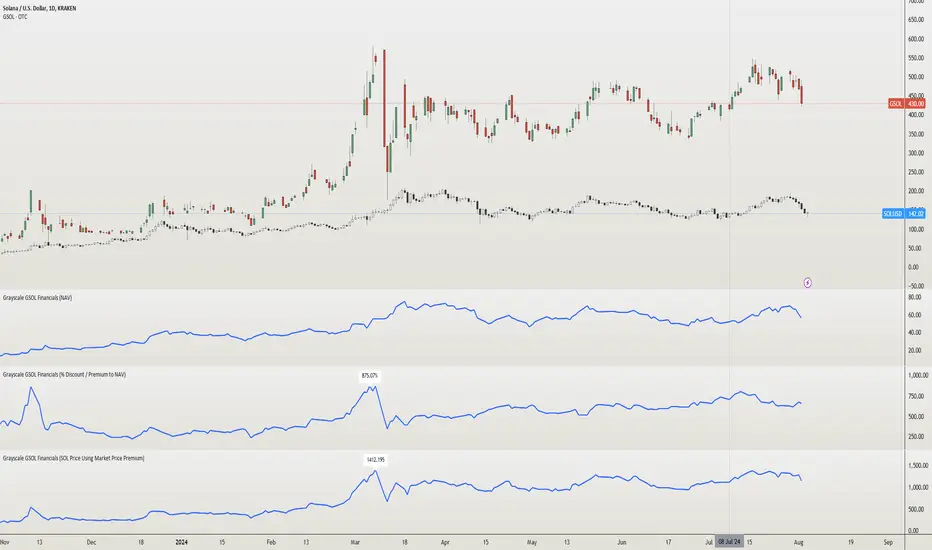
Grayscale GSOL Solana Financials [NeoButane]This script shows Grayscale's GSOL financials based on the information from their website. Investors and traders like to use financials when making the decision to buy, sell, or hold.
►Usage
This script is specific to GSOL. Investors and traders use financials when making the decision to buy, sell, or hold. How one interprets financials is up to the individual. For example, investors who believe a Solana ETF is coming soon can view the "% Discount / Premium to NAV", which is currently over 600%, and decide not to buy because the premium would collapse if an ETF began trading.
►Configuration
Data select the data you'd like to display.
Show Highest label show the highest value of the entire data set.
Line Color an expression of self.
Extrapolate Data Using Average or Last Known Value Shows a line beyond the dataset, using the average of all past data or the last data point to predict newer data. % Discount / Premium to NAV, Share Premium, and SOL Per Share are supported.
→Data retrieved from Grayscale
AUM assets under management.
NAV net asset value.
Market Price market price of GSOL.
Shares Outstanding number of shares held in the open market.
→Data retrieved from Grayscale, modified by me
% Discount / Premium to NAV the % away NAV is from the market price of GSOL.
Formula: (GSOL - NAV) / NAV
Share Premium the actual $ premium of GSOL to its NAV.
Formula: GSOL - NAV
SOL Per Share the amount of SOL 1 share of GSOL can redeem. This is derived using Kraken's SOLUSD daily close prices.
Formula: Kraken's SOLUSD / NAV
SOL Price Using Market Price Premium the price of SOL if GSOL's market price was "correct" and the SOL Per Share ratio remained the same.
Formula: GSOL / SOL Per Share
►How this works
Grayscale has a spreadsheet of historical data available on their GSOL page. Since financials are not available for OTC:GSOL, I placed all the data into arrays to emulate a symbol's price (y) coordinates. UNIX time for each day, also in an array, is used as the time (x) coordinates. The UNIX arrays and data arrays are then looped to plot as lines, with data y2 being the next data point, making it appear as a continuous line.
Grayscale's GSOL was downloaded spreadsheet and opened in Excel. SOLUSD prices were exported using TradingView export function. The output of information was pasted into Pine Script. For matching up Kraken's SOLUSD prices to each Grayscale's data since GSOL does not trade daily, dates were converted to UNIX and matched with xlookup(). A library or seed will be used in the future for updating.
References
Data retrieved from Grayscale's website 2024/08/04.
www.grayscale.com
Quantity of Solana held by the trust can be seen in their filings. Ctrl + F "Quantity of
SOL "
www.grayscale.com
Q1 2024: www.grayscale.com
The high premium can partly be explained by private placement currently being closed. This means private sales can't dilute share value.
www.etf.com
Global Financial IndexIntroducing the "Global Financial Index" indicator on TradingView, a meticulously crafted tool derived from extensive research aimed at providing the most comprehensive assessment of a company's financial health, profitability, and valuation. Developed with the discerning trader and investor in mind, this indicator amalgamates a diverse array of financial metrics, meticulously weighted and balanced to yield optimal results.
Financial Strength:
Financial strength is a cornerstone of a company's stability and resilience in the face of economic challenges. It encompasses various metrics that gauge the company's ability to meet its financial obligations, manage its debt, and generate sustainable profits. In our Global Financial Index indicator, the evaluation of financial strength is meticulously crafted to provide investors with a comprehensive understanding of a company's fiscal robustness. Let's delve into the key components and the rationale behind their inclusion:
1. Current Ratio:
The Current Ratio serves as a vital indicator of a company's liquidity position by comparing its current assets to its current liabilities.
A ratio greater than 1 indicates that the company possesses more short-term assets than liabilities, suggesting a healthy liquidity position and the ability to meet short-term obligations promptly.
By including the Current Ratio in our evaluation, we emphasize the importance of liquidity management in sustaining business operations and weathering financial storms.
2. Debt to Equity Ratio:
The Debt to Equity Ratio measures the proportion of a company's debt relative to its equity, reflecting its reliance on debt financing versus equity financing.
A higher ratio signifies higher financial risk due to increased debt burden, potentially leading to liquidity constraints and solvency issues.
Incorporating the Debt to Equity Ratio underscores the significance of balancing debt levels to maintain financial stability and mitigate risk exposure.
3. Interest Coverage Ratio:
The Interest Coverage Ratio assesses a company's ability to service its interest payments with its operating income.
A higher ratio indicates a healthier financial position, as it implies that the company generates sufficient earnings to cover its interest expenses comfortably.
By evaluating the Interest Coverage Ratio, we gauge the company's capacity to manage its debt obligations without compromising its profitability or sustainability.
4. Altman Z-Score:
The Altman Z-Score, developed by Edward Altman, is a composite metric that predicts the likelihood of a company facing financial distress or bankruptcy within a specific timeframe.
It considers multiple financial ratios, including liquidity, profitability, leverage, and solvency, to provide a comprehensive assessment of a company's financial health.
The Altman Z-Score categorizes companies into distinct risk groups, allowing investors to identify potential warning signs and make informed decisions regarding investment or credit exposure.
By integrating the Altman Z-Score, we offer a nuanced perspective on a company's financial viability and resilience in turbulent market conditions.
Profitability Rank:
Profitability rank is a crucial aspect of investment analysis that evaluates a company's ability to generate profits relative to its peers and industry benchmarks. It involves assessing various profitability metrics to gauge the efficiency and effectiveness of a company's operations and management. In our Global Financial Index indicator, the profitability rank segment is meticulously designed to provide investors with a comprehensive understanding of a company's profitability dynamics. Let's delve into the key components and rationale behind their inclusion:
1. Return on Equity (ROE):
Return on Equity measures a company's net income generated relative to its shareholders' equity.
A higher ROE indicates that a company is generating more profits with its shareholders' investment, reflecting efficient capital utilization and strong profitability.
By incorporating ROE, we assess management's ability to generate returns for shareholders and evaluate the overall profitability of the company's operations.
2. Gross Profit Margin:
Gross Profit Margin represents the percentage of revenue retained by a company after accounting for the cost of goods sold (COGS).
A higher gross profit margin indicates that a company is effectively managing its production costs and pricing strategies, leading to greater profitability.
By analyzing gross profit margin, we evaluate a company's pricing power, cost efficiency, and competitive positioning within its industry.
3. Operating Profit Margin:
Operating Profit Margin measures the percentage of revenue that remains after deducting operating expenses, such as salaries, rent, and utilities.
A higher operating profit margin signifies that a company is efficiently managing its operating costs and generating more profit from its core business activities.
By considering operating profit margin, we assess the underlying profitability of a company's operations and its ability to generate sustainable earnings.
4. Net Profit Margin:
Net Profit Margin measures the percentage of revenue that remains as net income after deducting all expenses, including taxes and interest.
A higher net profit margin indicates that a company is effectively managing its expenses and generating greater bottom-line profitability.
By analyzing net profit margin, we evaluate the overall profitability and financial health of a company, taking into account all expenses and income streams.
Valuation Rank:
Valuation rank is a fundamental aspect of investment analysis that assesses the attractiveness of a company's stock price relative to its intrinsic value. It involves evaluating various valuation metrics to determine whether a stock is undervalued, overvalued, or fairly valued compared to its peers and the broader market. In our Global Financial Index indicator, the valuation rank segment is meticulously designed to provide investors with a comprehensive perspective on a company's valuation dynamics. Let's explore the key components and rationale behind their inclusion:
1. Price-to-Earnings (P/E) Ratio:
The Price-to-Earnings ratio is a widely used valuation metric that compares a company's current stock price to its earnings per share (EPS).
A lower P/E ratio may indicate that the stock is undervalued relative to its earnings potential, while a higher ratio may suggest overvaluation.
By incorporating the P/E ratio, we offer insight into market sentiment and investor expectations regarding a company's future earnings growth prospects.
2. Price-to-Book (P/B) Ratio:
The Price-to-Book ratio evaluates a company's market value relative to its book value, which represents its net asset value per share.
A P/B ratio below 1 may indicate that the stock is trading at a discount to its book value, potentially signaling an undervalued opportunity.
Conversely, a P/B ratio above 1 may suggest overvaluation, as investors are paying a premium for the company's assets.
By considering the P/B ratio, we assess the market's perception of a company's tangible asset value and its implications for investment attractiveness.
3. Dividend Yield:
Dividend Yield measures the annual dividend income received from owning a stock relative to its current market price.
A higher dividend yield may indicate that the stock is undervalued or that the company is returning a significant portion of its profits to shareholders.
Conversely, a lower dividend yield may signal overvaluation or a company's focus on reinvesting profits for growth rather than distributing them as dividends.
By analyzing dividend yield, we offer insights into a company's capital allocation strategy and its implications for shareholder returns and valuation.
4. Discounted Cash Flow (DCF) Analysis:
Discounted Cash Flow analysis estimates the present value of a company's future cash flows, taking into account the time value of money.
By discounting projected cash flows back to their present value using an appropriate discount rate, DCF analysis provides a fair value estimate for the company's stock.
Comparing the calculated fair value to the current market price allows investors to assess whether the stock is undervalued, overvalued, or fairly valued.
By integrating DCF analysis, we offer a rigorous framework for valuing stocks based on their underlying cash flow generation potential.
Earnings Transparency:
Mitigating the risk of fraudulent financial reporting is crucial for investors. The indicator incorporates the Beneish M-Score, a robust model designed to detect earnings manipulation or financial irregularities. By evaluating various financial ratios and metrics, this component provides valuable insights into the integrity and transparency of a company's financial statements, aiding investors in mitigating potential risks.
Overall Score:
The pinnacle of the "Global Financial Index" is the Overall Score, a comprehensive amalgamation of financial strength, profitability, valuation, and manipulation risk, further enhanced by the inclusion of the Piotroski F-Score. This holistic score offers investors a succinct assessment of a company's overall health and investment potential, facilitating informed decision-making.
The weighting and balancing of each metric within the indicator have been meticulously calibrated to ensure accuracy and reliability. By amalgamating these diverse metrics, the "Global Financial Index" empowers traders and investors with a powerful tool for evaluating investment opportunities with confidence and precision.
This indicator is provided for informational purposes only and does not constitute financial advice, investment advice, or any other type of advice. The information provided by this indicator should not be relied upon for making investment decisions. Trading and investing in financial markets involves risk, and you should carefully consider your financial situation and consult with a qualified financial advisor before making any investment decisions. Past performance is not necessarily indicative of future results. The creator of this indicator makes no representations or warranties of any kind, express or implied, about the completeness, accuracy, reliability, suitability, or availability with respect to the indicator or the information contained herein. Any reliance you place on such information is therefore strictly at your own risk. By using this indicator, you agree to assume full responsibility for any and all gains and losses, financial, emotional, or otherwise, experienced, suffered, or incurred by you.

Financials - Quick OverviewThis unique indicator is designed to provide traders and investors with a concise yet comprehensive view of a company's financial health and sector classification. It features an intuitive table displayed prominently on the chart, offering a blend of essential company information and key financial metrics. This tool is ideal for those looking to integrate fundamental analysis into their technical trading strategy.
Key Features:
Company Sector Information: Get a quick glimpse of the company's industry sector, aiding in understanding its market position and comparative performance within its industry.
Financial Overview: The table includes vital financial data such as Earnings and Sales, providing insights into the company's revenue and profitability.
Growth Metrics: Track both quarter-over-quarter (QoQ) and year-over-year (YoY) growth, offering a dynamic view of the company's performance over time.
Operating Margin Percentage (OPM%): Understand the efficiency of the company's operations with the OPM%, which indicates the proportion of revenue that remains after paying for variable costs of production.
Price-to-Earnings (PE) Ratio: Assess the company's stock value relative to its earnings, an essential metric for valuation and comparative analysis within the sector.
Usage: This indicator is particularly useful for investors and traders who incorporate fundamental analysis into their decision-making process. By providing key financial data directly on the chart, it allows for a more integrated approach to technical and fundamental analysis. The indicator is designed to be straightforward and easy to interpret, making it suitable for both seasoned investors and those new to financial analysis.

SFC Valuation Model - AbsoluteFinancial statement analysis is the process of analyzing a company’s financial statements for decision-making purposes. External stakeholders use it to understand the overall health of an organization and to evaluate financial performance and business value. Internal constituents use it as a monitoring tool for managing the finances.
Most often, analysts will use three main techniques for analyzing a company’s financial statements.
First, horizontal analysis involves comparing historical data. Usually, the purpose of horizontal analysis is to detect growth trends across different time periods.
Second, vertical analysis compares items on a financial statement in relation to each other. For instance, an expense item could be expressed as a percentage of company sales.
Finally, ratio analysis, a central part of fundamental equity analysis, compares line-item data. Price-to-earnings (P/E) ratios, earnings per share, or dividend yield are examples of ratio analysis.
The indicator shows the most important metrics to help investors evaluate a stock. It saves a lot of time searching for metrics on different websites and writing them into different platforms for further analysis.
There are few valuation methods/steps
- Macroeconomics - analyse the current economic;
- Define how the sector is performing;
- Relative valuation method - compare few stocks and find the Outlier;
- Absolute valuation method historically- define how the stock performed in the past;
- Absolute valuation method - define how the stock is performed now and find the fair value;
- Technical analysis
How to use:
1. Once you have completed the initial evaluation steps, simply load the indicator.
2. Make your analysis.
3. Complete the checklist by writing down your thoughts.

SFC Valuation Model - RelativeComparable company analysis, or “Comps” for short, is commonly used to value firms by comparing them to publicly traded companies with similar business operations. An analyst will compare the current share price a public company relative to some metric such as its earnings to derive a P/E ratio. It will then use that ratio to value the company it is trying to determine the worth of.
One of the most popular relative valuation multiples is the price-to-earnings (P/E) ratio. It is calculated by dividing stock price by earnings per share (EPS), and is expressed as a company's share price as a multiple of its earnings. A company with a high P/E ratio is trading at a higher price per dollar of earnings than its peers and is considered overvalued. Likewise, a company with a low P/E ratio is trading at a lower price per dollar of EPS and is considered undervalued. This framework can be carried out with any multiple of price to gauge relative market value. Therefore, if the average P/E for an industry is 10x and a particular company in that industry is trading at 5x earnings, it is relatively undervalued to its peers.
Limitations
Like any valuation tool, relative valuation has its limitations. The biggest limitation is the assumption that the market has valued the business correctly.
Second, all valuation metrics are based on past performance. Investors' perceptions of future performance heavily influence stock prices and most relative valuation metrics don’t account for growth.
Finally and most importantly, relative valuation is no assurance that the "cheaper" company will outperform its peer.
With this indicator, investors can easily compare a few companies and find the outlier. It calculates the average for the sector and highlights the stock that is above the average.
Due to some limitations, the indicator can only compare 5 tickers, but users can always load it twice for more stocks.
Save hours of data entry into Excel spreadsheets to compare stocks !
There are few valuation methods/steps
- Macroeconomics - analyse the current economic;
- Define how the sector is performing;
- Relative valuation method - compare few stocks and find the Outlier;
- Absolute valuation method historically- define how the stock performed in the past;
- Absolute valuation method - define how the stock is performed now and find the fair value;
- Technical analysis
How to use:
1. Once you have completed the initial evaluation steps, simply load the indicator.
2. Add the forwarded EPS.
3. The indicator will do the rest of the calculations for you.

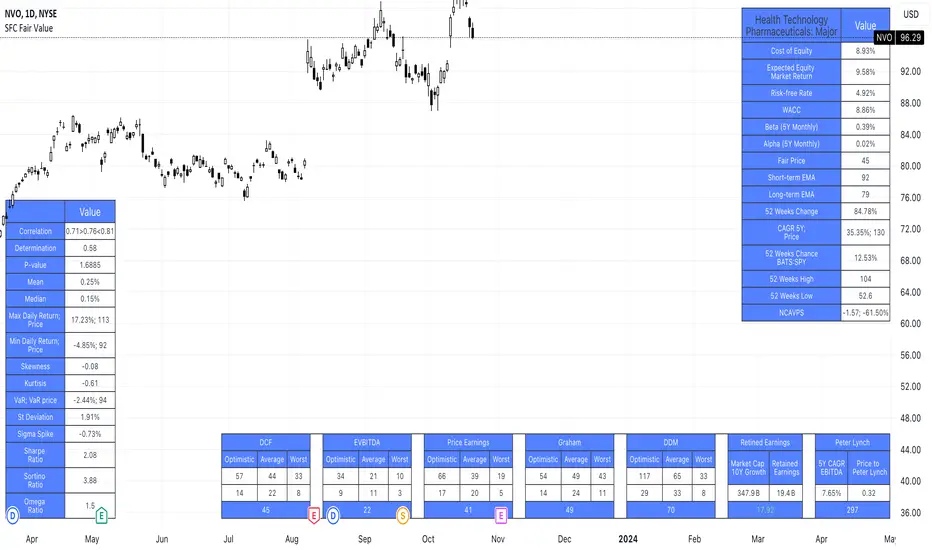
SFC Valuation Model - Fair ValueValuation is the analytical process of determining the current (or projected) worth of an asset or a company. There are many techniques used for doing a valuation. An analyst placing a value on a company looks at the business's management, the composition of its capital structure, the prospect of future earnings, and the market value of its assets, among other metrics.
Fundamental analysis is often employed in valuation, although several other methods may be employed such as the capital asset pricing model (CAPM) or the dividend discount model (DDM), Discounted Cash Flow (DCF) and many others.
A valuation can be useful when trying to determine the fair value of a security, which is determined by what a buyer is willing to pay a seller, assuming both parties enter the transaction willingly. When a security trades on an exchange, buyers and sellers determine the market value of a stock or bond.
There is no universal standard for calculating the intrinsic value of a company or stock. Financial analysts attempt to determine an asset's intrinsic value by using fundamental and technical analyses to gauge its actual financial performance.
Intrinsic value is useful because it can help an investor understand whether a potential investment is overvalued or undervalued.
This indicator allows investors to simulate different scenarios depending on their view of the stock's value. It calculates different models automatically, but users can define the fair value manually by changing the settings.
For example: change the weight of the model; choose how conservatively want to evaluate the stock; use different growth rate or discount rate and so on.
The indicator shows other useful metrics in order to help investors to evaluate the stock.
This indicator can save users hours of searching financial data and calculating fair value.
There are few valuation methods/steps
- Macroeconomics - analyse the current economic;
- Define how the sector is performing;
- Relative valuation method - compare few stocks and find the Outlier;
- Absolute valuation method historically- define how the stock performed in the past;
- Absolute valuation method - define how the stock is performed now and find the fair value;
- Technical analysis
How to use:
1. Once you have completed the initial evaluation steps, simply load the indicator.
2. Check the default settings and see if they suit you.
3. Find the fair value and wait for the stock to reach it.
Extreme Fundamental PricesExtreme Fundamental Prices is developed for Stock Markets to see the optimum, estimated and extreme estimated prices of any stocks on any markets. It works globally. Every country has different inflation, interest and deposit interest rates. The indicator consider these difference and it adopts itself automatically for chosen stock. Only the "Deposit Interest Rate" is manual because tradingview does not support this value for every country or value is wrong. If you know the deposit interest rate of your country enter the value manually. This is priority. Otherwise switch to "Interest Rate" on the menu. However the Optimum P/E line is not developed to work perfectly with this option. The Extreme Fundamental Prices indicator consists three lines which are,
-Optimum P/E
-Estimated 1Y Price
-Extreme Estimated 1Y Price
Optimum P/E line consists the financial data of chosen stock and economic data of country; which are financials of the stocks, inflation rate, deposit interest rate and interest rate(if "Interest Rate" option chosen).
Estimated 1Y Price line consists the financial data of chosen stock.
Extreme Estimated 1Y Price line consists the financial data of chosen stock.
This indicator does not tell you to buy or sell the stock. If stock price above these lines, the stock is fundamentally overpriced. If stock price below these lines, the stock is not fundamentally overpriced. Logically, price can tend to meet these lines.
For Instance, default value 33.00 is the current Deposit Interest Rate of Turkey. I am using this rate to look stocks on BIST. If you are looking on NASDAQ, just simply enter the deposit interest rate value of USA, looking for DAX enter the Euro Zone deposit interest rate.

Financial Radar Chart by zdmreRadar chart is often used when you want to display data across several unique dimensions. Although there are exceptions, these dimensions are usually quantitative, and typically range from zero to a maximum value. Each dimension’s range is normalized to one another, so that when we draw our spider chart, the length of a line from zero to a dimension’s maximum value will be the similar for every dimension.
This Charts are useful for seeing which variables are scoring high or low within a dataset, making them ideal for displaying performance.
How is the score formed?
Debt Paying Ability
if Debt_to_Equity < %10 : 100
elif < 20% : 90
elif < 30% : 80
elif < 40% : 70
elif < 50% : 60
elif < 60% : 50
elif < 70% : 40
elif < 80% : 30
elif < 90% : 20
elif < 100% : 10
else: 0
ROIC
if Return_on_Invested_Capital > %50 : 100
elif > 40% : 90
elif > 30% : 80
elif > 20% : 70
elif > 10% : 50
elif > 5% : 20
else: 0
ROE
if Return_on_Equity > %50 : 100
elif > 40% : 90
elif > 30% : 80
elif > 20% : 70
elif > 10% : 50
elif > 5% : 20
else: 0
Operating Ability
if Operating_Margin > %50 : 100
elif > 30% : 90
elif > 20% : 80
elif > 15% : 60
elif > 10% : 40
elif > 0 : 20
else: 0
EV/EBITDA
if Enterprise_Value_to_EBITDA < 3 : 100
elif < 5 : 80
elif < 7 : 70
elif < 8 : 60
elif < 10 : 40
elif < 12 : 20
else: 0
FREE CASH Ability
if Price_to_Free_Cash_Flow < 5 : 100
elif < 7 : 90
elif < 10 : 80
elif < 16 : 60
elif < 18 : 50
elif < 20 : 40
elif < 22 : 30
elif < 30 : 20
elif < 40 : 15
elif < 50 : 10
elif < 60 : 5
else: 0
GROWTH Ability
if Revenue_One_Year_Growth > %20 : 100
elif > 16% : 90
elif > 14% : 80
elif > 12% : 70
elif > 10% : 50
elif > 7% : 40
elif > 4% : 30
elif > 2% : 20
elif > 0 : 10
else: 0

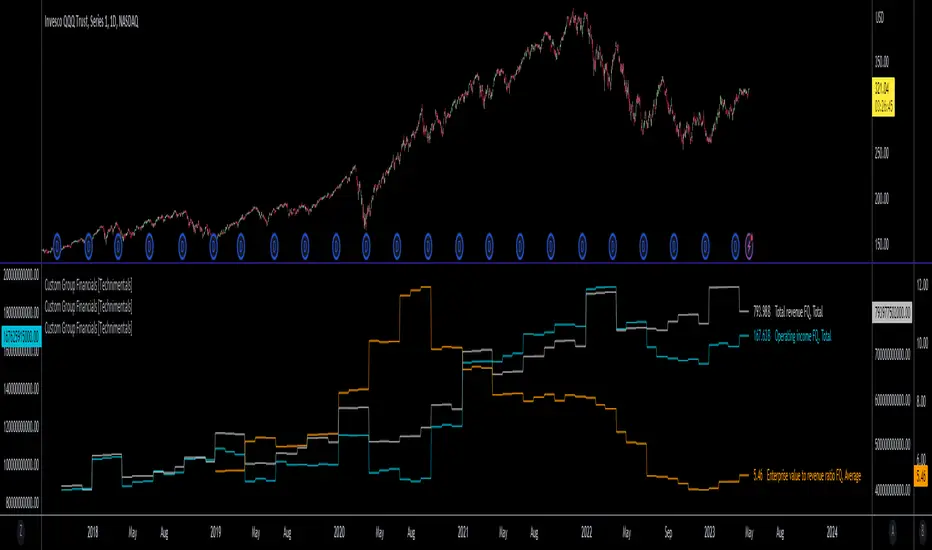
Custom Group Financials [Technimentals]This script allows the user to build custom groups and combine the same financial data from 40 different symbols simultaneously and plot it data as a total or as an average.
By default, the top 40 symbols in the QQQ are used. Between them they account for the majority of the index. This is a good workaround for the lack of ETF financial data in TradingView.
This functions much like any other financial indicator. You choose the financial data and period:
FY = Financial Year
FQ = Financial Quarter
TTM = Trailing Twelve Months
Bare in mind that some data only exists in FY data.
Thanks to @LucF for writing most of this code!
Enjoy!
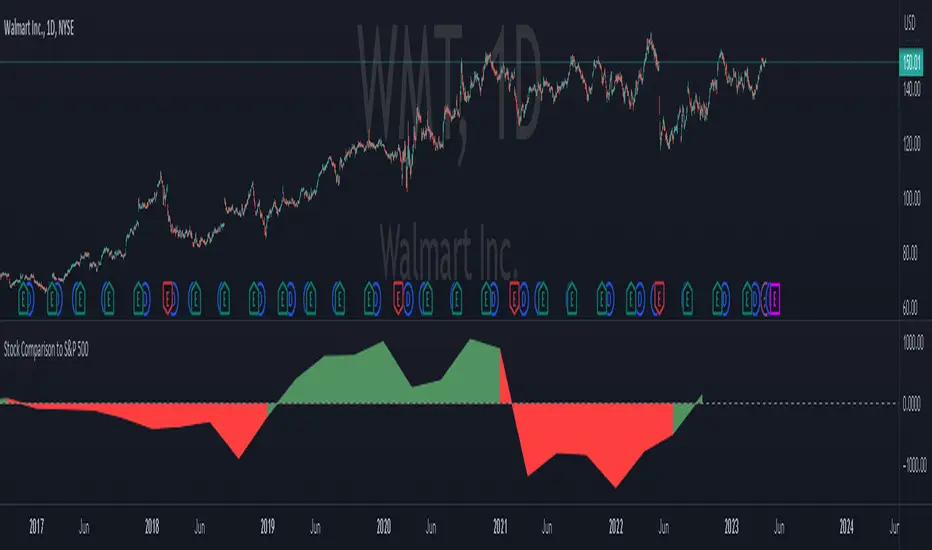
Stock Comparison to S&P 500This indicator, "Stock Comparison to S&P 500," is designed to help traders compare the financial health and valuation of a chosen stock to the S&P 500 index. It compares several key financial metrics of the stock to the corresponding metrics of the S&P 500, including earnings growth, price-to-earnings ratio, price-to-book ratio, and price-to-sales ratio.
The indicator calculates the differences between each metric of the selected stock and the S&P 500, and then weights them using a formula that takes into account the importance of each metric. The resulting value represents the overall comparison between the stock and the S&P 500.
The indicator also displays the differences between the individual metrics in separate plots, allowing traders to see how each metric contributes to the overall comparison. Additionally, it colors the plots green if the selected stock is performing better than the S&P 500 in a particular metric and red if it's performing worse.
Traders can use this indicator to gain insight into the relative financial health and valuation of a selected stock compared to the S&P 500 index, which can help inform their trading decisions.
IOFin F-Score by zdmre🗣The IOFin F-Score is a discrete score between zero and ten that reflects ten criteria used to determine the strength of a firm's financial position.
🗣It is used to determine the best value stocks, with ten being the best and zero being the worst.
The IOFin F-Score broken down into the following categories:
Profitability
Equity, cash flow, liquidity, and source of funds
Operating efficiency
Criteria Include:
Price to book (P/B) lower than 3 (1 point)
Debt to Equity (D/E) lower than 0.5 (1 point)
Price to FreeCashFlow (P/FCF) equal to or lower than 20 (1 point)
Peg Ratio lower than 1 (1 point)
Sustainable Growth Rate higher than 0.3 (1 point)
Return on Assets (ROIC) higher than 0.07 (1 point)
Return on Equity (ROE) higher than 0.3 (1 point)
EnterpriseValue/Ebitda lower than 10 (1 point)
Quick Ratio equal to or higher than 1 (1 point)
Operating Margin higher than 0.15 (1 point)

Financials - Comparing CompaniesHello All
For a while I have been working on this indicator to compare financials of the companies and sort them accordingly. Finally I completed and published it. I preferred using new object type feature in Pine language™ and I hope it might be an example and helpful for the developers.
First of all, as we have limitation on security calls, the indicator can get and compare financials for 5 companies only. also Chart time frame must be 1Day or higher! ( I recommend 1Day time frame ). if not then the indicator stops and shows the error message: "Please set the time frame 1Day or higher" . More important than others: You should choose the companies from the same sector! Compare apples to apples :)
The Financials in the indicator:
Earnings Per Share
Price to Earnings Ratio
Price to Sales Ratio
Price to Book Ratio
Profit Margin
Dept to Equity
Current Ratio
Market Capitalization
Also more information shown for each stocks:
Closing Price, sets the color accordingly
2 Simple/Exponential moving average, you can set the length, also it checks if it is rising/falling and sets the color accordingly
Volume info
Average volume (20 days), you can set the period
Currency for each security
Lets see some features in it:
it sorts the companies according to the financials:
If you move the mouse onto any header then it shows explanation about the financial:
You can change location and text size:
You can set the type of Moving averages as SMA or EMA and you can also set the length for both . Headers for both are changed automatically by MA type and length
Colors for Closing price and MA cells are set automatically:
For new Objects in Pine language click here
P.S. You can use this indicator while analyzing the financials of the companies in same sector/industry. So please don't ask for the alerts :)
Enjoy!

TemelWith this indicator, you can follow the basic ratios of stocks after the balance sheet periods.
This indicator , make it easier for a quick glance of overall company financial health without switching tabs for every single stocks.
Gösterilen Finansal Veriler. (data shown)
* Satışlar ve Net Kar (Revenue & PAT (Profit after Tax)
* Net Kar Marjı (Net Profit Margin (%))
* Brüt Kar Marjı (Gross Profit Margin (%))
* Hisse Başına Kar (Earnings Per Share)
* Özkaynak Karlılığı (RETURN ON EQUITY)
* Aktif Karlılık (RETURN ON ASSETS)
* FAVÖK Marjı (EBITDA MARGIN)
* Temettü Verimi (DIVIDENDS YIELD)
* F/K
* PD/DD (BOOK VALUE PER SHARE)
* PEG Rasyosu
* ROIC (RETURN ON INVESTED CAPITAL)
* Cari Oran (QUICK RATIO)
Toggle between Quarter/Annual Financial Data
The accuracy of the data subject to Tradingview's source, but from my observation it's accurate 95% of the time
(Verilerin doğruluğu Tradingview'in kaynağına tabidir, ancak benim gözlemime göre, zamanın %95'i doğrudur.)
Recently published data might not be available immediately
(Yakın zamanda yayınlanan veriler hemen mevcut olmayabilir.)
Past performance is not an indicator of future results.
My opinions and research are my own and do not constitute financial advice in any way whatsoever.
Nothing published by me constitutes an investment recommendation, nor should any data or Content published by me be relied upon for any investment/trading activities.
I strongly recommends that you perform your own independent research and/or speak with a qualified investment professional before making any financial decisions.
(Geçmiş performans gelecekteki sonuçların bir göstergesi değildir.
Görüş ve araştırmalarım bana aittir ve hiçbir şekilde finansal tavsiye niteliği taşımaz.
Tarafımdan yayınlanan hiçbir şey bir yatırım tavsiyesi teşkil etmez ve yayınladığım hiçbir veri veya İçeriğe herhangi bir yatırım/ticaret faaliyeti için güvenilmemelidir.
Herhangi bir finansal karar vermeden önce kendi bağımsız araştırmanızı yapmanızı ve/veya kalifiye bir yatırım uzmanıyla konuşmanızı şiddetle tavsiye ederim.)

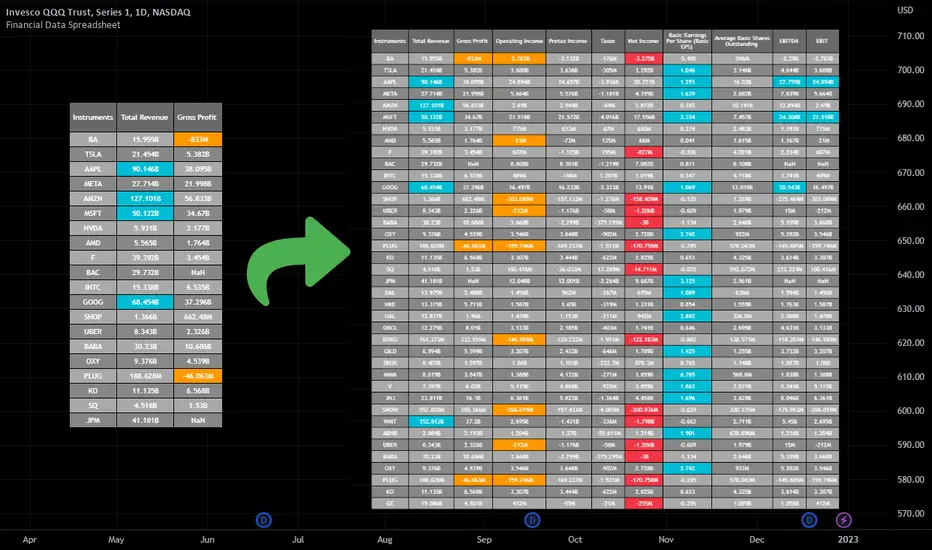
Financial Data Spreadsheet [By MUQWISHI]The Financial Data Spreadsheet indicator displays tables in the form of a spreadsheet containing a set of selected financial performances of a company within the most recent reported period. Analyzing Financial data is one of the classic methods to evaluate whether the company’s stock price is overvalued or undervalued based on its income statement, balance sheet, and cash flow statement. This indicator might be practical to investors to collect needed data of a company to analyze and compare it with other companies on a TradingView chart or print it in spreadsheet form.
█ OVERVIEW
█ BEST PRACTICES
Due to strict limitations on calling request.financial() function, I tried to develop the table with the best ways to be more dynamic to move and the ability to join multiple tables into a spreadsheet. Users can add up to 20 instruments and 2 financial metrics per table. However, it’s possible to add many tables with other financial metrics, then connect them to the main table.
Credits: The idea of joining multiple tables inspired by @QuantNomad Screener for 40+ instruments
█ INDICATOR SETTINGS
1- Moving Table toward right-left up-down from its origin.
2- Hiding Column Title checkmark. Useful for adding a joined table underneath with additional instruments.
3- Hiding Instruments Title checkmark. Useful for adding a joined table on the right with other financial metrics.
4- Shade Alternate Rows checkmark. I believe it’ll make the table easier to read.
5- Selecting Financial Period. (Year, Quarter).
6- Entering a currency.
7- Choosing a financial ID for each column. There’re over 200 financial IDs. Source: What financial data is available in Pine? — TradingView
8- Optional to highlight values in between.
9- Entering the ticker’s symbol with the ability to activate/deactivate.
█ TIP
For best technical performance, use the indicator in a 1D timeframe.
Please let me know if you have any questions.
Thank you.
(CF|DB) Caruso Financial DashboardThe Caruso Financial Dashboard brings a rich amount of company financial data straight to your TradingView chart along with additional vital stock-related information. At a glance, you can see EPS (Diluted), Sales, growth rates, and EPS/Sales surprises either quarter by quarter on the daily chart or for Fiscal Years on the weekly chart.
On the daily chart, the financial table also has helpful highlights to visually display if a quarter’s EPS or Sales are higher than the same quarter a year ago. Also, EPS and Sales data has a helpful green shading when a new record high number has been achieved for the metric. Additional stock-based metrics include the stock’s Up/Down volume ratio, Beta, Average Daily Volume in terms of shares traded or dollar value traded, the percentage distance to a moving average of choice, as well as the stock’s 52-week high and low.
The weekly chart shows financial data for fiscal years. It also has additional stock-based metrics from those available on the daily chart. These include; Market Cap, Shares in Float and the Float as a percentage of all shares outstanding, the distance from the stock’s 52-week high, the distance to a moving average of choice (10 sma by default), the P/E and P/S ratios.
To further help an investor understand a company’s growth rates, the CF|DB allows a user to hide all or part of the table and plot EPS, EPS TTM (Trailing Twelve Months), and Sales TTM lines on the chart. This can be applied to either the daily or weekly chart.
The CF|DB provides financial and market data for international markets (US, EU, Canada, Australia, Hong Kong, Japan, and more), making its applicability global.
Features On Daily Chart
· Quarterly EPS
· Quarterly EPS growth rate YoY
· Quarterly EPS Surprise vs consensus estimate
· Quarterly Sales
· Quarterly Sales growth rate YoY
· Quarterly Sales Surprise vs consensus estimate
· Green/Red dot highlighting YoY growth or decline
· EPS/Sales green highlight for 8 quarter high or record high numbers
· Up/Down Volume Ratio
· Beta
· Average Daily Volume (shares trade). Period for the average can be configured
· Average Daily Volume (dollar value traded). Period for the average can be configured
· Distance to a moving average. The average can be configured. 21 ema by default
· 52-week high and low
· New 52-week highs and lows are highlighted by a red or green box shading
· Ability to plot EPS, EPS TTM, Sales lines
· Ability to hide part or all of the financial data table
Features On Weekly Chart
· FY EPS
· FY EPS growth rate YoY
· FY EPS Surprise vs consensus estimate
· FY Sales
· FY Sales growth rate YoY
· FY Sales Surprise vs consensus estimate
· EPS/Sales green highlight for 8-year high or record high numbers
· Market Cap
· Shares in float
· Share in float as a percentage of all shares outstanding
· Distance to new 52-week highs
· Distance to a moving average. The average can be configured. 10 sma by default
· Ability to plot EPS, EPS TTM, Sales lines
· Ability to hide part or all of the financial data table

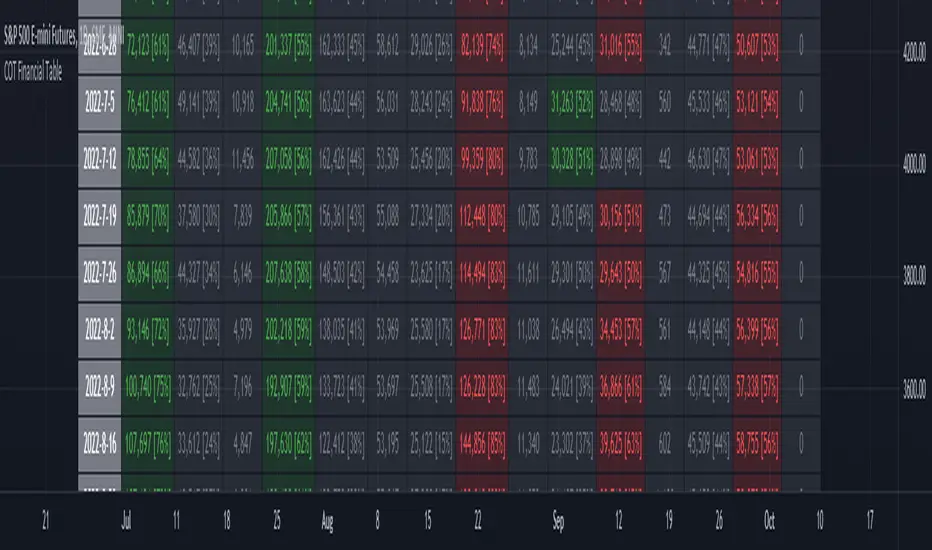
ILM COT Financial Table - CFTCUse this indicator on Daily Timeframe
Please refer to the below link for CFTC Financials
www.cftc.gov
This script shows the Financial COT for the respective instrument by deriving the CFTC code.
Option is provided to override the CFTC code
User can also configure the historical CFTC data view
The script calculates the Long% vs Short% for various categories (Dealers/Asset Managers/Leveraged Funds/Other Reportables) and color codes the column appropriately.
The goal of this script is to show all the financial CFTC data on a single page to digest the data better in a tabular form
Fixed the default TradingView Library which has some errors with CFTC code mapping.
For example, SPX CFTC Code #13874+ which is the most important one where big players take positions is not there in the default Library.