Moving Average Exponential with Standard Deviation BandThis is standard EMA script available on Trading View and i have just added ability to add a channel based on standard deviation. In addition to it you can enable/disable optional lines from options and it would add 50% levels of upper and under channel. I added 50% as it provide important price levels if you have right settings selected for channel factor.
Exponentialmovingaverages

Exponential MA Channel, Daily Timeframe (Crypto)Moving averages are some of the most common tools for traders. Some of the most widely used ones are simple moving averages (e.g. 20SMA, 50 SMA, 100 SMA, 200SMA,...). There are endless combinations of moving averages that can be used. I prefer to use exponential moving averages because they react more quickly to price data (essentially they filter back through the data over a discrete number of timesteps, with more recent history receiving the highest weighting in the final calculation).
This script uses a combination of the 21EMA, 53 EMA, and 100EMA. The idea of this script is to provide insight into when an asset might be close to a local top/bottom by monitoring price within the middle channel (yellow, blue, and orange lines), as well as identifying longer timeframe opportunities to buy/sell by examining the upper (green) and lower (red) bands. Disclaimer: this is not a guarantee that if price enters a region, that it will be a top or bottom, it is simply an indicator to get an idea based on price history.
As far as I know, this particular combination of exponential moving averages has not yet been published. I do not have an infinite amount of time to check through the entire library of published scripts. If someone else has already done this, I was unaware. Numerical computations were performed on ETHBTC price data in order to find the coefficients used in this script. Essentially, each EMA has a multiplier of either 1, a fraction of 1, or a number larger than 1 (these are the numbers in the script being multiplied by 'out1', 'out2', 'out3'; feel free to change these and see how this changes the indicator). I have found it to be useful for myself, and hope other people can tinker with this idea. My only wish is to allow other people to use this starting point to explore for themselves. I hope that I am allowed to publish this script without it being taken down so that others can freely use it.
Recommendations: although this was fit specifically for ETHBTC, it appears useful for many crypto pairs, specifically alt-BTC pairs and crypto-USD pairs. For example, I have found it useful for BTCUSD, ETHUSD, LINKUSD, LINKBTC, ETHBTC, ADABTC, etc. Only use on the DAILY timeframe.

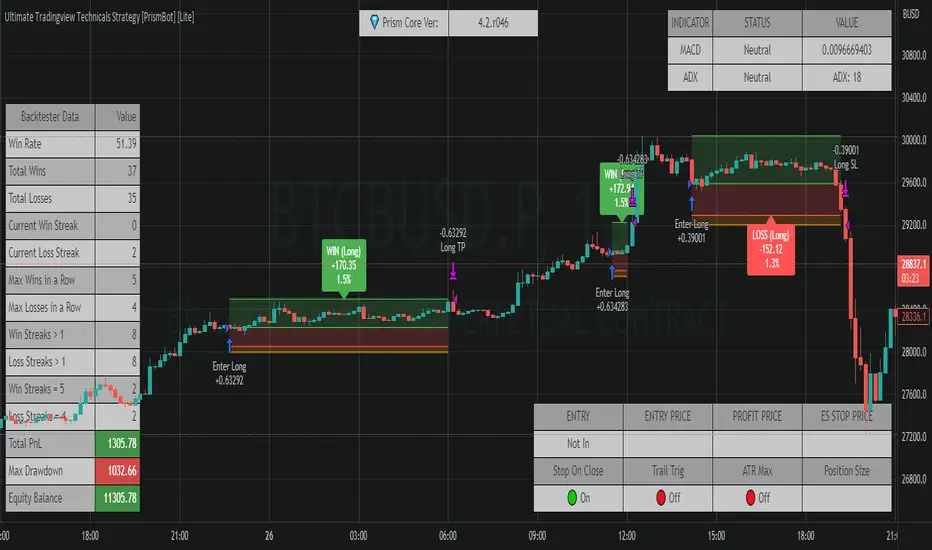
Ultimate Tradingview Technicals Strategy [PrismBot] [Lite]Included in this builder:
MACD
RSI
Tradingview Technical Analysis
Ichimoku
Global Trend Filter
Pullback Filter
Our most robust strategy to date with MACD , RSI , and many other basic strategies included as well as additional filters and alert options.
It is an advanced trading strategy built with the intent to make it easy for anyone to begin trading, but also avoid too much complication of strategy concepts.
For instance, you can change the MACD settings to be "more sensitive" by using a simple dropdown menu, and adjust which strategy you are employing with the MACD on the fly with another.
You can easily enable and disable strategies using the checkbox.
The strategy demo results use 100% equity per trade as an example - the reason for this is that the stop loss is set to 1%, so each trade is risking 1% (give or take slippage). Slippage is set to 5 ticks, and a 0.04% commission (Binance average for market and limit orders)
This strategy incorporates a risk to reward system where the user can select between ATR and Percent based stop losses and take profit targets. This means that the user has much better control over money management when utilizing this strategy and it doesn't require you to babysit the strategy to ensure it's entering and existing strategies in an ideal place.
The status box shows the current state of the various strategies and their values. A red circle indicates the filter / strategy is not valid for entry yet. A green circle indicates that filter / strategy is valid for entry. When all selected strategies are valid simultaneously, the next bar will trigger an entry signal.
If you have any questions about this strategy, please leave them in the comments below, or DM for more details. Thanks!
Additional features in this lite strategy:
✔️ Tweak a multitude of specific settings (MA lengths, R:R, SL distance etc)
✔️ Use money management and risk calculations
✔️ Draw trade info directly to chart (eg. SL size in percent, win rate etc)
✔️ Use various filters (eg. time filter, date filter etc)
✔️ Manage risk per position
✔️ Sync to any bot or algorithmic trading system
ADX / RSI Strategy by Trade Rush (created by SirPoggy) This is one of many new strategies coming soon which were seen on Trade Rush
This one is the ADX / RSI Strategy seen here:
https:www.youtube.com/watch?v=uSkGE0ujyn4
While the strategy has been modified slightly to use the DMI instead of the ADX, the core of the strategy is essentially the same
Long signals are generated when the RSI is above 70, close is above the 200EMA, and the ADX is above 25 (added is the plus DMI over 25 and minus DMI below 20)
Stop loss is placed below /above the 21 EMA, however, there is a deviation required to ensure price is not too close to where a stop loss would be placed.
Short signals are generated when the RSI is below 30, close is below the 200EMA, and the ADX is above 25 (added is the minus DMI over 25 and plus DMI below 20)
I do not recommend using this strategy but I have provided this code for educational purposes.
Thanks!
Let me know which strategy you'd like coded next in the comments below.

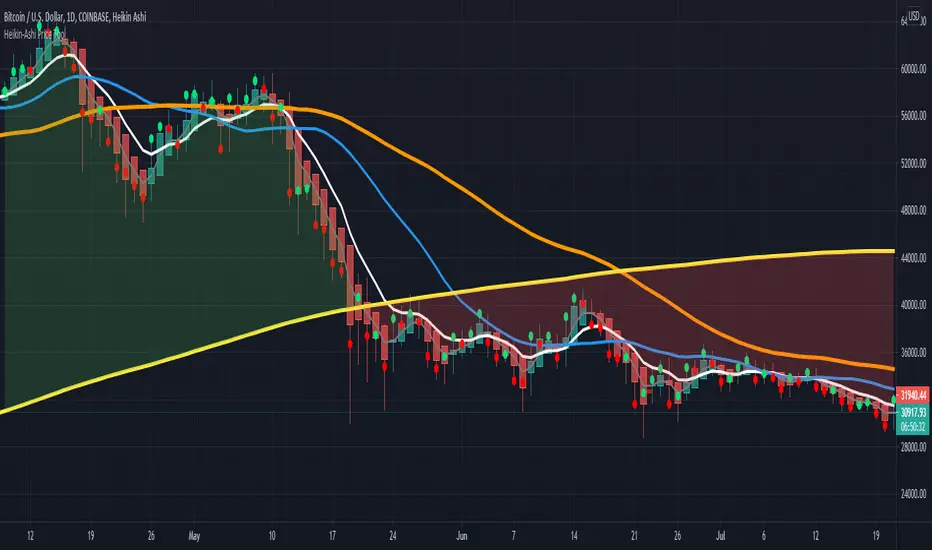
HPT - Heikin-Ashi Price ToolThis overlay study can be used with an Heikin-Ashi chart and diplays the real prices for Heikin-Ashi candles as circles for each bar. If the real closing price of the bar is higher then the opening price, the circle has a green color, otherwise it is red.
Here you can see the overlay : COINBASE:BTCUSD
The follwing moving averages are added to the chart as well: SMA 20, 50, 200 and EMA 8 (for analyzing trend and support/resistance ). A background fill can be activated for the overall trend.
I recommend to lower the opacity for the bars so that you can better see the circles for the real prices.
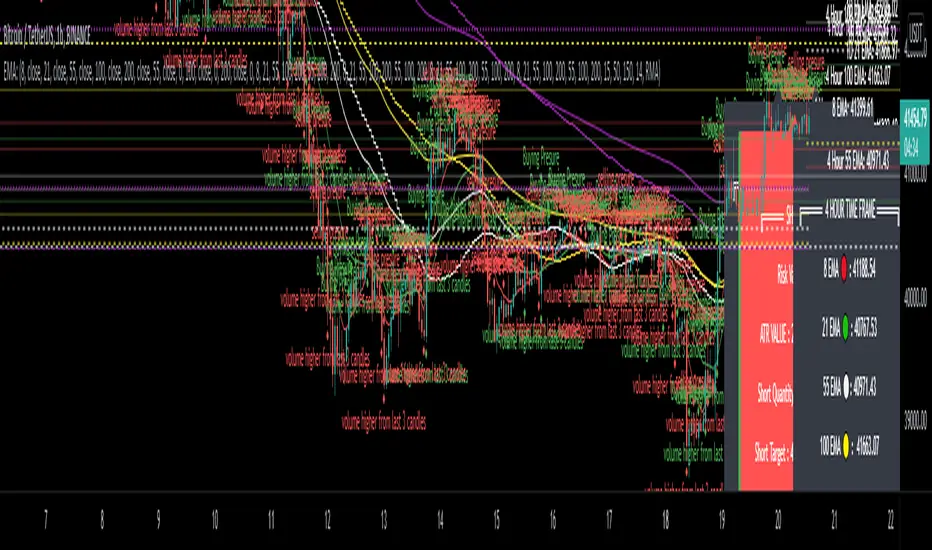
EMA - MA 21/55/100/200 with Horizontal Lines and LabelsThis indicator will help you to get dynamic support lines of EMA 21,55,100,200 and MA 55,100,200. You can get the Price of EMA And MA in Labels also.
SOLID LINES - 4 HOUR
DOTTED LINES - 1 DAY
DASHED LINE - 1 HOUR
Hope It will help you.
Trade with your own risk. I am not liable for any loss and profit based on this indicator.
Thank you.
TradePro's Trading Idea Cipher Divergence EMA Pb StrategyHere I present you on of Trade Pro's Trading Idea: Cipher B+ Divergence EMA Pullback Strategy.
Optimized the crypto pairBTC/USDT in the 30 minute chart.
There is the possibility to switch between short and long positions.
You can choose between 2 different take profit/stop loss types: The Lowest Low/ Highest High Stop Loss/ Take Profit and the ATR Take Profit/ Stop Loss.
-----------------------------------------------------------------------------------
How does the strategy work?
ENTRY
Long
The price must be above the 200 EMA .
The price needs to make a pullback into the 50 EMA .
Right after that, the Cipher B indicator must give a buy signal, it must be below the zero line and the Money Flow cloud must be green.
Short
Contrary to the premise of long positions.
EXIT
Lowest Low/ Highest High Exit
The Lowest Low (long) / highest high (short) serves as the stop loss. The TP is formed on the basis of a factor.
(Long for example: *Lowest Low* multiplied by *Profitfactor* = TP).
ATR Exit
The value of ATR at the time of buying is multiplied by the value entered in "Profit factor ATR" and "Stop factor ATR". As soon as the price reaches this value, it is closed.
Important
The script must be optimized for each coin or currency pair. However, only the values for the profit factor, the stop loss and Lowest Low / Highest High are relevant.
Also, by changing the Chanel Length and the Chanel Average, you can create strong profit changes.
The results of the strategy are without commissions and leverage.
If you have any questions or feedback, please let me know in the comments.
If you need more information about the strategy and want to know exactly how to apply it, check out my profile. There I have created a tutorial for the function of the script.

RSI Strategy w/ Trailing SL / TP Optimized for Crypto [Strategy]This strategy is designed to use the RSI and EMA filters. A 200 period EMA is used for short / long filters, and the 50 period EMA is used to determine the direction of the short term trend.
In addition, the script uses "rate of change" for the fast EMA (trend), volume , RSI (momentum), and price (volatility) and only takes trades when all are in optimal conditions.
I.E., the EMA is in an uptrend, the volume is increasing, price is in an uptrend, and the RSI is in an uptrend, so we will place a Long trade.
This strategy uses EMAs as a trailing stop loss and take profit. As this is a trend following strategy, the idea is to maximize profits when correct and minimize losses when
wrong.
It was designed specifically using crypto pairs, and was optimized for the 10 minute chart.
My goal was to get the best use out of the RSI indicator. I was originally an MACD fanboy, but have recently converted.
Want to help me improve this code or strategy? Have suggestions for improvement? Leave them in the comments below.
Thanks for using my script! I hope it works well for you and good luck in the markets.
If you have any questions, please leave them in the comments and I'll do my best to respond.
This script does not repaint as it only relies on close data to make a decision to enter a trade.
How to use this strategy:
___________________________
Enable Long Entries? - Used to enable or disable the strategy from executing long entries.
Enable Short Entries? - Used to enable or disable the strategy from executing short entries.
How Many Bars To Look Back for Hi/Lo: - This is used for the Stop Loss and Take Profit targets. An integer of bars is used to look back and calculate the values.
RSI Length (Rec: 8) - The length of the RSI
Source - The RSI Source
Use Slow EMA? - If checked, a 200 period EMA will be used to filter entries long or short (only take shorts when the price is below, long when above). In addition, the script will close any trades that cross the 200 period EMA. By default this is disabled.
EMA Slow - the period of the Slow EMA (200 by default)
EMA Slow Src - what to use to calculate the Slow EMA (high by default)
EMA Fast - The Fast EMA (50 period) is used to calculate the direction of the short term trend. This also factored into the Rates of Change.
EMA Fast Src - what to use to calculate the Fast EMA
ATR Length - If used, the ATR length is used to calculate the Stop Loss and Take Profit targets.
SL Multiplier - The distance away from the initial value to multiply the Stop Loss
TP Multiplier - The distance away from the initial value to multiply the Take Profit.
Use EMA as SL / TP? - If true (default) a 3 period EMA is used to calculate Stop Loss and Take Profit targets. Else, an ATR is used to calculate these values.
Stop Loss / Take Profit Offset - Default: 3 - this is used to shift the EMA / ATR Stop Loss and Take Profit lines to the right X bars. This is to ensure that they are hit properly and not exceeded.
Short Len Vol - Use to calculate the volume of the short length, used in rate of change calculations
Long Len - Use to calculate the volume of the long length, used in rate of change calculations
RSI Long Entry Val - Minimum RSI crossover value to enter a trade Long. If the RSI is below this value, trade entries are not valid.
RSI Long Cutoff Threshold - Long entry RSI value cutoff to no longer enter trades. If the RSI is above this value, trades entries are not valid.
RSI Short Entry Val - Minimum RSI crossover value to enter a trade Short. If the RSI is above this value, trade entries are not valid.
RSI Short Cutoff Threshold - Short entry RSI value cutoff to no longer enter trades. If the RSI is below this value, trades entries are not valid.
ROC Fast EMA - Calculates the rate of change between the Fast Ema now and 'X' bars ago. For a long entry, a positive value is needed, and for a short entry, a negative value is needed.
ROC Price - Calculates the rate of change between the most recent price close and 'X' bars ago. For a long entry, a positive value is needed, and for a short entry, a negative value is needed.
ROC RSI - Calculates the rate of change between the RSI now and 'X' bars ago. For a long entry, a positive value is needed, and for a short entry, a negative value is needed.
Use Close for SL - Default = Off - If checked, when a candle hits the stop loss, the trade will close on the next candle. If unchecked, the trade will remain open until the candle closes at or beyond the stop loss lines.
Custom Message Boxes - Primarily used for bots, but can be used to also insert your own messages for your trading alerts.

[francrypto® strategy] 4 EMAs, P.SAR & Vol.Prof. (by kv4coins)(ENG)
This script consists of my own strategy for cryptocurrency (but can be adapted very well for stocks, forex, etc.)
Is a combination of:
- Four Exponentials Moving Average (EMA), configurables: by defect are 10, 21, 55 and 200 periods in yellow, aqua, orange and blue each of them
- Parabolic SAR System (PSAR), configurable
- Volume Profile (that has been developed by kv4coins - he has already authorized me to use it under the same OSS Licence Terms: MPL 2.0), configurable: with another default values and bilingual support for Spanish (SPA)
How it works
1) It is always better to detect specifics candlesticks or patrons: doji , pinbar or inverted pinbar , engulfing bars , morning star or evening star , harami , twizzer bottom or top , etc.
2) The 10 and 21 periods EMA help to identify the short-term behavior
3) The 55 periods EMA can be used like a support or resistance in medium-term, as 200 periods EMA in very long-term
4) It will convenient search for a double cross (10 & 21) or a triple cross (10, 21 & 55) to determine the medium-term change Downtrend to UpTrend (or viceversa)
5) Confirm the change patron with the Parabolic SAR and then identify potencials purchases or sales
6) Use Volume profile to detect potential supports or resistances areas, in order to set stop limit/loss and take profit orders.
Hope this helps!
Cheers,
FRANCRYPTO®
–––––– 0 ––––––
(ESP)
Este script consiste en mi propia estrategia para criptomonedas (pero puede adaptarse muy bien para acciones, forex, etc.)
Es la combinación de:
1) Cuatro Medias Móviles Exponenciales (EMA), configurables: por defecto son de 10, 21, 55 y 200 períodos en amarillo, turquesa, naranja y azul cada una de ellas
2) Sistema Parabolic SAR (PSAR), configurable
3) Perfil de Volumen (que fuera desarrollado por kv4coins - que ya me ha autorizado a su uso bajo las mismas condiciones de la Licencia OSS: MPL 2.0), configurable: con otros valores por defecto y soporte bilingüe para Español (SPA)
Cómo funciona
1) Siempre va a resultar mejor detectar velas japonesas específicas o patrones: doji , martillos o martillos invertidos , velas envolventes , patrón amanecer o atardecer , harami , velas gemelas , etcétera
2) La EMA de 10 y 21 períodos ayudan a identificar el comportamiento de corto plazo
3) La EMA de 55 períodos puede ser usada como un soporte o resistencia de mediano plazo, como así también, la EMA de 200 períodos en el muy largo plazo
4) Será conveniente buscar un doble cruce (10 & 21) o un triple cruce (10, 21 & 55) para determinar un cambio de la tendencia de mediano plazo de bajista hacia alcista (o viceversa)
5) Confirmá el patrón de cambio con la Parabólica de SAR y entonces identificá potenciales compras o ventas
6) Usá el perfil de volumen para detectar las potenciales zonas de soporte o resistencia, principalmente para establecer ordenes stop limit/loss o take profit.
¡Espero que pueda serles de utilidad!
Saludos,
FRANCRYPTO®

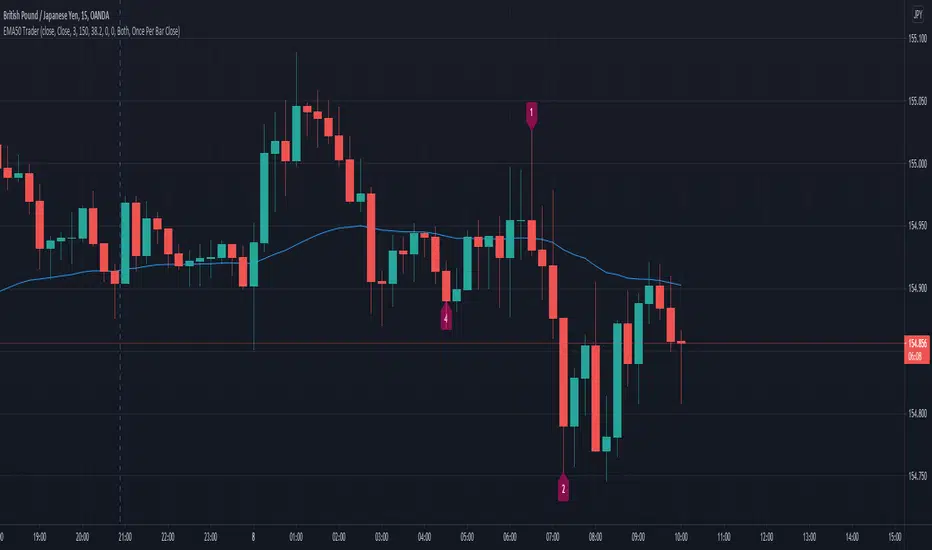
The EMA 50 Trader
THE EMA 50 TRADER
The EMA Trader locate EMA 50 Trades based upon an ABC wave with predicted target (4) known as D. The Trader let you set your own Fibonacci level. You can set whatever a EMA 50 break should be close price or high/low price (wick/body scenario). The EMA Trader is a tool to help you get alerts when a setup may suitable for you. You only need to setup one alert per asset, and timeframe. The tool will also set different colors on repeating same trades who may be nested for easier reading. You can select what color you want on badge and text as well.
You can also set what amount of candles is required to be called an A-B break. As well as if the retrace has to be clean (Same direction) candles, or if it can be mixed with bullish/bearish candles. Additionally you can set what how deep you want a trade retrace (3) has to be within nearest structure. This to avoid prev. structure and retrace at the same level.
Ichimoku EMA RSI - Crypto only long StrategyHey there!
Here I show you an Ichimoku Cloud Strategy.
I discovered the strategy on a YouTube channel and tried to transfer it as a strategy into a script.
He said in his video that you would make more profit with this strategy than holding the coin.
Tested with the crypto pair ETH/USDT in the four hour chart.
Period: beginning of 2017 until today.
The strategy should also work with foreign exchange. But then the settings have to be adjusted.
There is the possibility to activate two EMA's and a Stochastic RSI .
-----------------------------------------------------------------------------------
How does the strategy work?
ENTRY
The green Ichimoku lead line must above the red Ichimoku lead line - only the two lead lines are activated.
A green candle must closed above the green lead line.
EXIT
A red candle must close below the green Ichimoku lead line.
OPTIONAL ENTRY
EMA
Once you activate the EMA , long positions will only be taken once the EMA1 is above the EMA2.
Thereby I could observe a significant increase of the profit as well as a decrease of the maximum drawdown.
RSI
As soon as you activate the Stochastic RSI , long positions are only taken when the K line is above the D line.
In the future, I may add an oversold - undersold parameter.
The results of the strategy are without commissions and levers.
If you have any questions or feedback, please let me know in the comments.
If you need more information about the strategy and want to know exactly how to apply it, check out my profile.
I wish you good luck with the strategy!

Shaded Tripple MAsThree moving averages that have shaded area between its sma and ema versions. Default lengths are 50, 100 and 200.

Custom Multi-Timeframe Screener with AlertsThis is a multi-timeframe screener with alerts. Use this way you can create a screener on indicators using 2 or more timeframes.
In TradingView there is a limit of 40 security function calls. Every timeframe requires another security call so you can screen fewer symbols with any additional timeframe.
In this example, I use 2 timeframes, so the maximum amount of symbols you can scan is 40/2 = 20.
For 3 timeframes - 13, 4tfs - 10, 5tfs - 8 symbols and so on.
In this simplistic example, I require a cross of EMAs on the current timeframe and confirmation that one EMA above/below another from the second timeframe.
Of course, you can create much more complicated functions for this screener.
Params
- higher timeframe
- ema params
- 20 symbol inputs for instruments you want to use in this screener
Alerts
You can create an alert from it easily by selecting the screener name from the list and then selecting "Any alert() function call".
No additional configuration is required, message and alert on close is generated in the code.
You should better change the default name for your alert. Sometimes because of big amount of inputs you might receive an error.
Disclaimer
Please remember that past performance may not be indicative of future results.
Due to various factors, including changing market conditions, the strategy may no longer perform as good as in historical backtesting.
This post and the script don’t provide any financial advice.

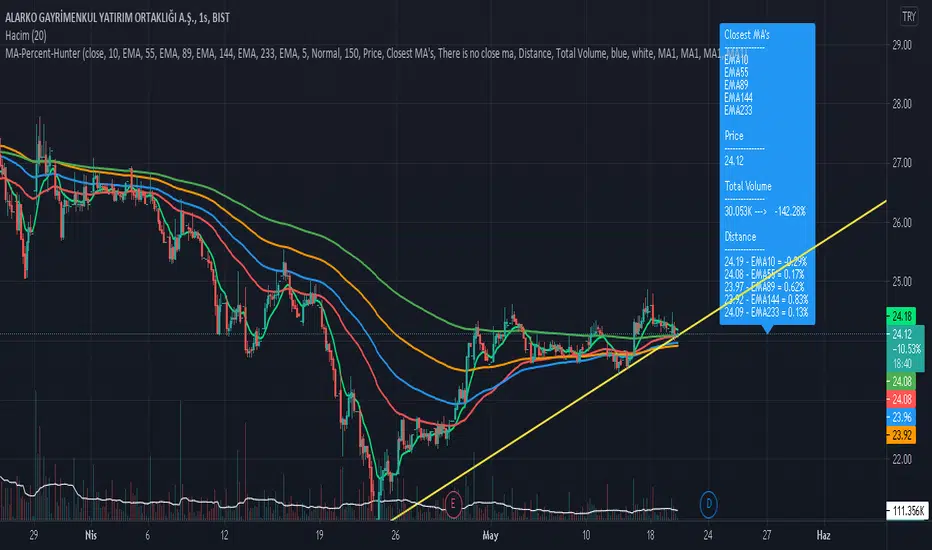
Moving Average Percentage Hunter by HassonyaIn this indicator study, we aim to capture the moving averages to which the bar close is closest. The indicator shows the moving averages, which are closest to the percentage value we selected, on the label. It indicates the names of the closest averages at the top of the label with a (near) note next to them. If none of the averages are close to the specified percentage value, there will be a no nearness warning. The indicator supports the heikin ashi candles. For this setting, check the I'm using heikin ashi candles box.
Thanks to this feature of the indicator, you will be able to see bar proximity to the moving averages you use continuously. You can make purchases and sales by using this feature to your advantage. This way you can easily catch reaction turns.
If you want, you can turn off moving averages in the settings section. You can open it whenever you need. You can do this in the show moving averages box. Appears if you check it, disappears if you uncheck it.
There are 5 moving average options. SMA, EMA, WMA, TMA and HullMA moving averages. Moving average names and values in the list are dynamically adjusted. When you change the settings, the moving average names and values in the list will change automatically. At the bottom of the settings, you can determine the lengths of the moving averages yourself. In the next update, each moving average will have a different average option.
You can enter percentage values, fractional figures. for example (3.5, 5.2 vb.) The indicator will show you the value you give and the proximity of the value below that value. You can adjust this setting in MA Percentage Nearness.
More detailed options will be available in the next update. Range of values, options below, above, and so on.
In the settings section, there is a Show distance option. If you check this option, you can continuously see the percentage values of the distance to the moving averages on the label. For this feature, you have to check the show distance box.
The alarm feature will come in the next update.
Thanks for support. Good Luck.
MA-SS ( EMA SSL ) Indicator StrategyThis is the strategy script relating to the already-published MA-SS Indicator Study.
Backtest properties for the strategy tester results shown below are;
- 10k initial capital
- 50% of equity
- 0.0075% commission
- zero values on everything else
The MA-SS Indicator is a simple yet effective indicator using a combination of EMAs and SSL channel, utilising higher time frame data to help confirm trend/ price direction.
How does it work?
The Indicator consists of;
- 3 x EMAs – The 3rd EMA being a filter EMA
- Multi Time Frame EMA (This is an additional filter EMA which can be switched on and off)
- Multi Time Frame SSL Channel (This acts as a filter and can also be switched on and off)
The concept initially began as a simple EMA crossing indicator, but adding an MTF EMA plus a MTF SSL channel for additional filtering, helped to give a better indication of trend and ultimately filter out several bad trades.
- EXAMPLE: If price is …
o below the MTF EMA filter
o The MTF SSL Channel is red
o White and blue EMAs cross below the yellow (filter) EMA in the red SSL channel
> …a short is fired!
- (Opposite scenario for longs)
- Your stop loss would ideally be the top/ bottom of the SSL channel (either the MTF SSL channel or a standard SSL channel added manually to the chart), or, go for a clear pivot point or support/ resistance level.
- Take profit is yours to decide but I opt for a 1:1.5 risk/reward ratio. You could also use the MTF SSL channel to gauge when you should exit your trade (i.e. if you're in a long, wait for the SSL channel to flip red).
Any questions please fire away in the comments

3 EMA Stochastik RSI ATR SL TP only LONGHey there!
Here i will show you the 3 EMA RSI Stochastic Crossover strategy with an ATR SL and TP.
The strategy works as follows:
For long positions, the EMA's must be in the following order:
The 8 E M A must be above the 14 E M A and the 14 E M A must be above the 50 E M A.
The buy signal is given to us by the Stochastic RSI indicators.
The K line must cross the D line above. The following candle must then close above all E M A's.
The stop loss is determined by three times the value of the ATR.
The take profit is determined by two times the value of the ATR.
In this strategy only long positions are traded.

MA-SS ( EMA SSL ) Indicator StudyThe MA-SS Indicator is a simple yet effective indicator using a combination of EMAs and SSL channel, utilising higher time frame data to help confirm trend/ price direction.
How does it work?
The Indicator consists of;
- 3 x EMAs – The 3rd EMA being a filter EMA
- Multi Time Frame EMA (This is an additional filter EMA which can be switched on and off)
- Multi Time Frame SSL Channel (This acts as a filter and can also be switched on and off)
The concept initially began as a simple EMA crossing indicator, but adding an MTF EMA plus a MTF SSL channel for additional filtering, helped to give a better indication of trend and ultimately filter out several bad trades.
- EXAMPLE: If price is …
o below the MTF EMA filter
o The MTF SSL Channel is red
o White and blue EMAs cross below the yellow (filter) EMA in the red SSL channel
> …a short is fired!
- (Opposite scenario for longs)
- Your stop loss would ideally be the top/ bottom of the SSL channel (either the MTF SSL channel or a standard SSL channel added manually to the chart), or, go for a clear pivot point or support/ resistance level.
- Take profit is yours to decide but I opt for a 1:1.5 risk/reward ratio. You could also use the MTF SSL channel to gauge when you should exit your trade (i.e. if you're in a long, wait for the SSL channel to flip red).
I will also have a strategy script available for this indicator.
Any questions please fire away in the comments.

Custom WaterMark + 4EMA [SilentKreator]4 Ema + Custom Watermark, you can customize everything, in the watermark you can write your name, is a tool to visually protect your work, mainly for streamers and analysts.

Bank Heist ( Matrix 5 EMA With Delorean Indicator Alerts )Bank Heist ( Market Maker / Matrix 5 EMA With Delorean Indicator Alerts )
Welcome to the "Bank Heist" Indicator
This indicator is based on one strategy that many many individuals and companies have tried to label as their own, brand it, and resell it. The names of these companies will be listed below as to not "steal" the strategy from the people trying to brand EMA's and also to help those using keyword searches (based on the many hot terms coined over the years) to find this indicator. I personally have decided to add to the confusion and call it the "Bank Heist" so as to not appear to be "stealing" someone elses name for free indicators 😊
The Strategy
Simple:
The EMA's are below price, look for buys. EMA's above price, look for sells.
The 50 EMA is ALWAYS market equilibrium
Intermediate:
5 EMA Crossing Up 13 EMA With The 50 EMA Under everything = Buy
5 EMA Crossing Down 13 EMA with 50 EMA Above everything = Sell
The 50 EMA is ALWAYS market equilibrium
Advanced:
Simple+Intermediate
The higher period the EMA , the Longer the trend.
All time frames must pull back to ALL EMA's at some point during the trend
🤯 Each EMA is one period different, one time frame up or down (Example: The 13 EMA on the 15m chart is the same as the 5 EMA on the 1hr Chart)
🔑 If you don't understand this and/or want to study it further then mark each EMA on the 15m chart, then move up one time frame at a time all the way to the daily chart.
🧙♂️ After it "clicks" , just remember that price must always pull back to all EMA's on all time frames, The 50 EMA is ALWAYS market equilibrium
Delorean Indicator Alerts:
Set alarms on TradingView with this indicator!
For those who don't know what this is:
Two candles cutting through the 13 ema, second candle bigger, trade in the direction of the trend.
Special Notes:
The 50 EMA is ALWAYS market equilibrium
The Highly Skilled Will See How To Get The Worlds Tightest Stop Loss
THIS WORKS ON ALL TIME FRAMES (Yes, 1 minute throught 1 year)
THIS WORKS ON ANY FINANCIAL INSTRUMENT
You Can Also Set Alerts For The EMA's Crossing ( 5 EMA Crossing 13 EMA , ETC.)
🔮 Study These, You Cant Make This Up 🔮
Famous Trading System Names That Got You Here
Ordered from true original to most recent "creators" in chronological order
FXPX
Matrix
Matrix Trading System
Matrix 5 EMA
5 EMA
5 EMA's
Market Maker
MarketMaker
Delorean
Delorean Indicator
Delorean Strategy
IM Academy
Bank Heist (Free & Condensed TradingView Indicator)
DISCLAIMER
THIS IS NOT FINANCIAL OR INVESTMENT ADVICE AND SHOULD NOT BE INTERPRETED AS SUCH.
Trading foreign exchange on margin carries a high level of risk, and may not be suitable for all investors. Past performance is not indicative of future results. The high degree of leverage can work against you as well as for you. Before deciding to invest in foreign exchange you should carefully consider your investment objectives, level of experience, and risk appetite. The possibility exists that you could sustain a loss of some or all of your initial investment and therefore you should not invest money that you cannot afford to lose. You should be aware of all the risks associated with foreign exchange trading, and seek advice from an independent financial advisor if you have any doubts.

Background Color Based on EMAHello Traders,
this is a very simple script. It paints the background color based on the close price in reference to an exponential moving average.
If the close is above the EMA the background color will be green.
If the close is under the EMA the background color will be red.
You can adjust colors and the EMA period by yourself.
This little indicator script is just to get a better overview, for example in combination with other indicators.
Hope you guys like this script. Wish you a great trading week.

RR 3Software signal with a combination of Moving Average, Exponential Average, Hull Average, Volume weighted best combined with RR 1 & 2
NOTE: RR 3 is in beta Stage will update it once it is Final
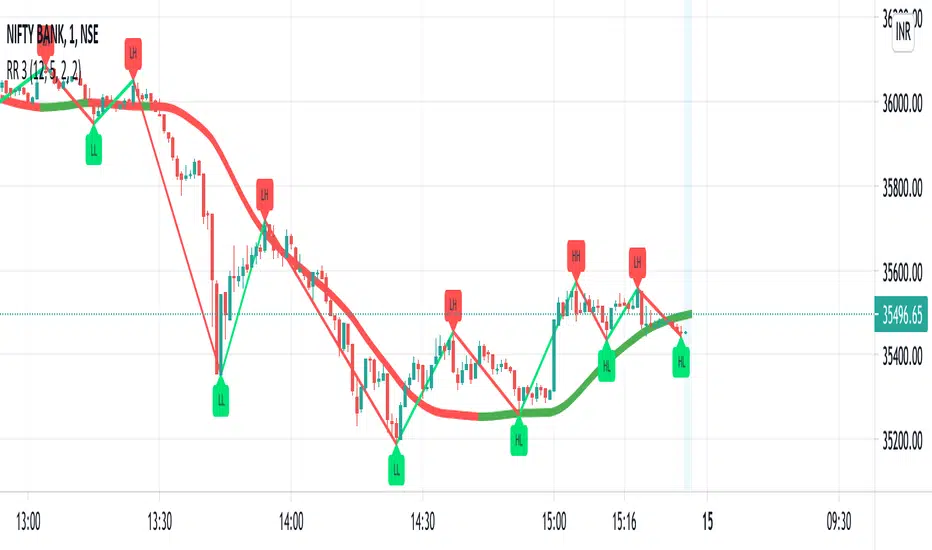
Buy/Sell/Hold/Away? This script based on Simple Moving Average and Exponential Moving Average.
The Red Line is an exponential moving average with small length. It act as a main line.
The Black Line is an average of some past data of exponential moving average. Act as Trend Line
The green circles is an exponential moving average with medium length. It act as a signal line.
The Idea is, when the price move higher from it past,past,past, repeatedly in some duration, it will gain enough energy to fly to the highest.
Buy signal when red line cross down green circle. strong buy when red line cross down black line.
Sell signal when red line cross down green circle. strong buy when red line cross down black line.
Additional 1:
Triangle up(blue) indicate Buy Signal. it happen when the price break resistant with some condition and volume>1m
Triangle down(maroon) indicate Sell Signal. it happen when the price break support with some condition and volume>1m
The more triangle show in series, the strong the trend to move accordingly.
Additional 2:
Support and Resistance line.
Hope Benefit To You All.

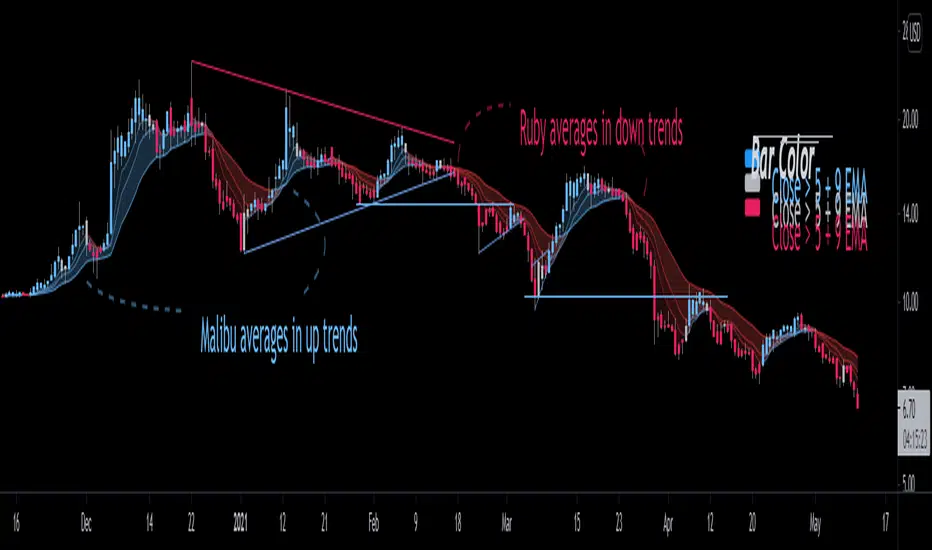
Bjorgum EMAThis is an answer back to repeated requests for a simple version of Bjorgum Triple EMA Strat, which is not recommended for use with Heiken Ashi candles as it results in "double smoothing" of the averages and can give late signals as a result.
The inputs are raw and super basic. At its core its really just 3 EMAs that you can customize the source and length. The averages and shadowing change color based on if they are either rising or falling.
default values are 5, 9, and 21 EMA on open as source.
Bar color is dictated by the bar close over or under the 5 and 9 EMA.
This is suitable for use on HA candle.