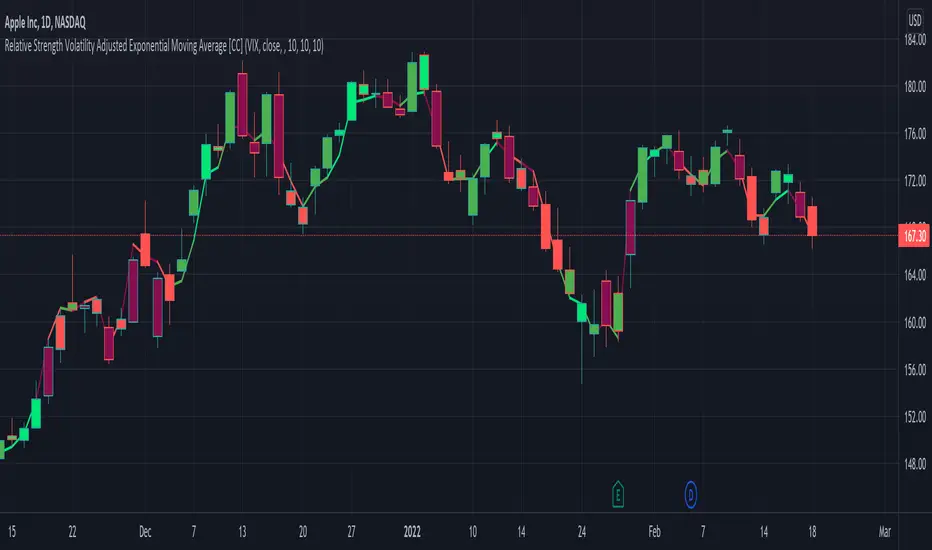
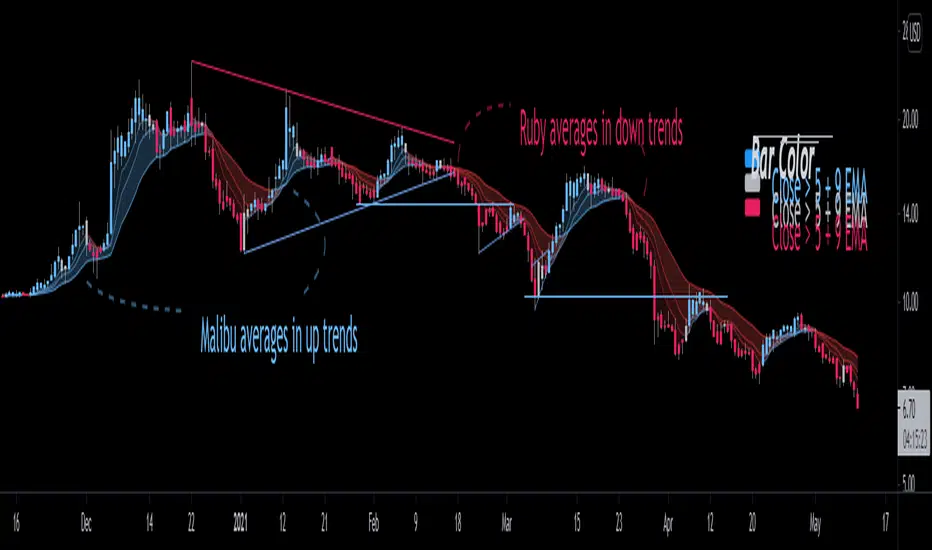
Relative Strength Volatility Adjusted Ema [CC]The Relative Strength Volatility Adjusted Exponential Moving Average was created by Vitali Apirine (Stocks and Commodities Mar 2022) and this is his final indicator of his recent Relative Strength series. I published both of the previous indicators, Relative Strength Volume Adjusted Exponential Moving Average and Relative Strength Exponential Moving Average
This indicator is particularly unique because it uses the Volatility Index (VIX) symbol as the default to determine volatility and uses this in place of the current stock's price into a typical relative strength calculation. As you can see in the chart, it follows the price much closer than the other two indicators and so of course this means that this indicator is best for choppy markets and the other two are better for trending markets. I would of course recommend to experiment with this one and see what works best for you.
I have included strong buy and sell signals in addition to normal ones so strong signals are darker in color and normal signals are lighter in color. Buy when the line turns green and sell when it turns red.
Let me know if there are any other indicators or scripts you would like to see me publish!
Exponentialmovingaverages
NazhoThis is a simple scalping strategy that works for all time frames... I have only tested it on FOREX
It works by checking if the price is currently in an uptrend and if it crosses the 20 EMA .
If it crosses the 20 EMA and its in and uptrend it will post a BUY SIGNAL.
If it crosses the 20 EMA and its in and down it will post a SELL SIGNAL.
The red line is the highest close of the previous 8 bars --- This is resistance
The green line is the lowest close of the previous 8 bars -- This is support
+SuperTrend

T3 + BB
TRES EMAS + BANDAS DE BOLLINGER
INDICADOR 1: TRES EMAS (MEDIA MOVIL EXPONENCIAL)
Con este indicador puede visualizar el promedio de precios con mayor peso a los datos mas recientes.
Se calculan y dibujan tres medias móviles exponenciales: 4, 20 y 200 últimas velas.
-Rápida EMA1 = 4, paso = 1
-Media EMA2 = 20, paso = 2
-Lenta EMA 3 = 200, paso = 10
INDICADOR 2: BANDAS DE BOLLINGER
Con este indicador podrá ver la fuerza y la tendencia del mercado, es decir la mide la volatilidad del precio del activo.
Si el precio sobrepasa la banda superior, el activo está sobrecomprado.
Si el precio sobrepasa la banda inferior, el activo está sobrevendido.
Longitud tendencia - BASE = 20, paso = 1
Desviación Estándar - Multiplicador = 2, paso = 0.2
Estos 2 indicadores sirven para todo tipo de activos: FOREX, CRIPTO, CFD´s, ETC.
------------------------------------------------------------------------------------------------------------------
THREE EMAS + BOLLINGER BANDS
INDICATOR 1: THREE EMAS (EXPONENTIAL MOVING AVERAGE)
With this indicator you can visualize the average of prices with greater weight to the most recent data.
Three exponential moving averages are calculated and drawn: 4, 20 and 200 last candles.
-Fast EMA1 = 4, step = 1
-Average EMA2 = 20, step = 2
-Slow EMA 3 = 200, step = 10
INDICATOR 2: BOLLINGER BANDS
With this indicator you can see the strength and trend of the market, that is, it is measured by the volatility of the asset price.
If the price goes above the upper band, the asset is overbought.
If the price goes above the lower band, the asset is oversold.
Trend length - BASE = 20, step = 1
Standard Deviation - Multiplier = 2, step = 0.2
These 2 indicators are used for all types of assets: FOREX, CRYPT, CFD's, ETC.

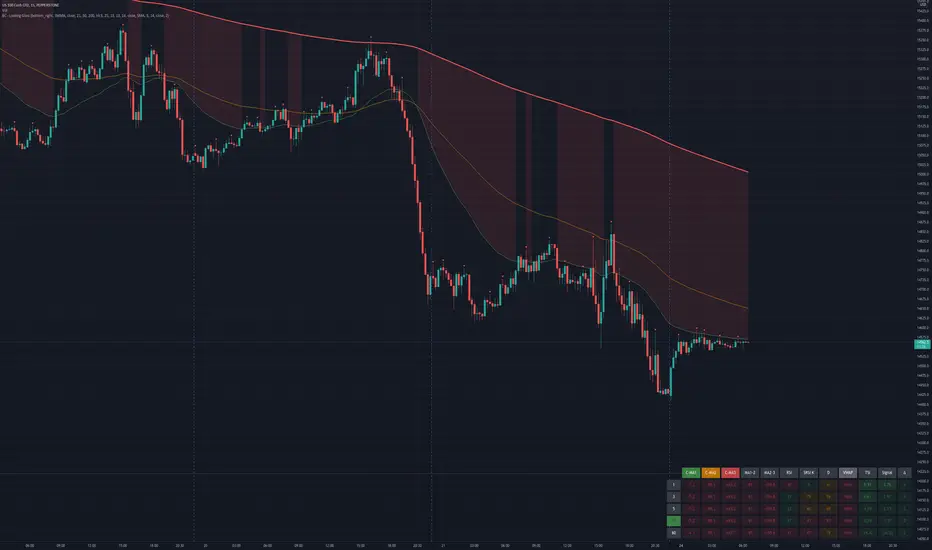
Bogdan Ciocoiu - Looking Glass► Description
The script shows a multi-timeline suite of information for the current ticker. This information refers to configurable moving averages, RSI, Stochastic RSI, VWAP and TSI data. The timeframes reflected in the script vary from 1m to 1h. I recommend the tool for 3m scalping as it provides good visibility upwards.
The headings from the table are:
{Close} - {MA1}
{Close} - {MA2}
{Close} - {MA3}
{MA1} - {MA2}
{MA2} - {MA3}
{RSI}
{Stoch RSI K}
{Stoch RSI D}
{VWAP}
{TSI}
{TSI EMA}
{TSI} - {TSI EMA}
► Originality and usefulness
This tool is helpful because it helps users read a chart much quicker than if they were to navigate between timeframes. The colour coding indicates an accident/descendant trend between any two values (i.e. close vs MA1, MA1-MA2, RSI K vs RSI D, etc.).
► Open-source reuse
www.tradingview.com
www.tradingview.com
www.tradingview.com
www.tradingview.com
www.tradingview.com
EMA deviation & Range with barcolor changeThis indicator includes an EMA, a range and outer lines similar to the Bollinger Bands, but with a different calculation (which also becomes apparent once you compare the two). This indicator fits very well with the EMA pullback strategy.
The color of the candles changes depending on where it is located.
Above the EMA - green
Below it - red
Inside the range - black
All colors as well as lines are customizable under the Style tab.
The "Deviation" can be set to 0, here there are only slight deviations.
The EMA range can be adjusted in 0.1 steps to achieve the highest possible accuracy of the pullbacks.
If you have any questions, please don't hesitate to contact me.

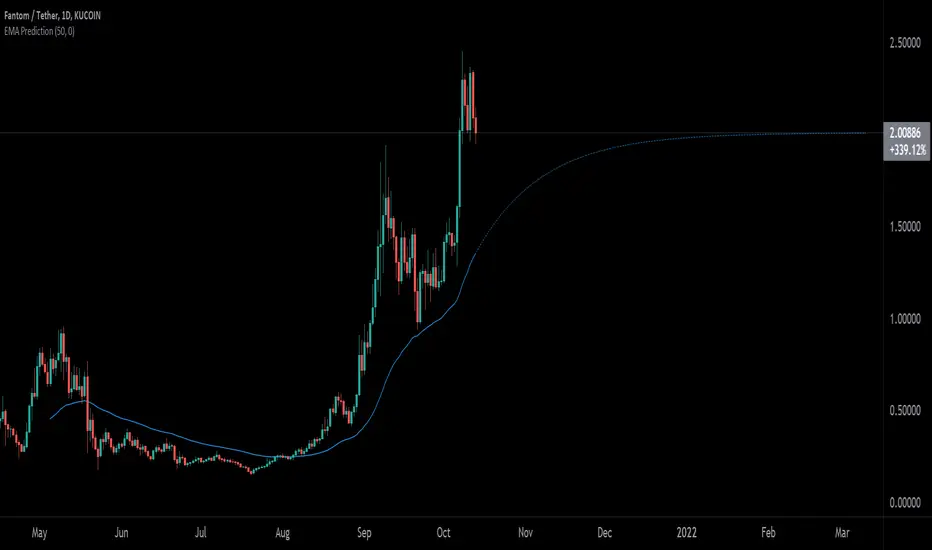
EMA PredictionThis script predicts future EMA values assuming that the price remains as configured (-50% to +50%).
Elder Impulse System + ATR BandsDisregard the above chart, I am not sure why it isn't showing the one I want, which is linked below:
This is as far as I can tell the closest representation to Dr. Alexander Elder's updated "Elder Impulse System" that has added ATR-volatility bands up to 3x deviations from price. I got the idea from watching this recent video (www.youtube.com) of Dr. Elder reviewing some recent trades and noticed he had updated his system from his original books. The Impulse System colour coding was inspired by AstralLoverFlow and LazyBear. ATR Bands are pre-programmed Keltner Channels with some modifications such as filing in the ATR Zones with user-selected colour bands and modifying the ATR value to better suit the volatility of the market being traded.
The script has several components, which I will detail below:
Exponential Moving Averages:
1) A 13-period EMA that is used as a staple in all of Dr. Elder's technical analysis. He uses this EMA as the basis for all of his indicators and why it is included here.
2) A 26-period EMA which can be used as a base-line of sorts to filter when to go long or when to go short. For instance, price over the 26-EMA, price is strong and the rally upwards is likely to continue, underneath it, price is weak and likely to continue downwards for a time.
Volatility Bands:
By definition these are nothing more than 3 separate Keltner Channels of a 13-period EMA each set to one additional multiplier from the moving average. This gives us a 1x, 2x, and 3x multiplier of average volatility from the 13-period EMA based on a 14-period Average True Range (ATR) reading. The ATR was chosen as it accommodates price gaps and also is the standard formula calculation in TradingView. The values of the bands cannot be adjusted but the colour coding of them can be.
Elder Impulse System:
These colour-coded bars show you the strength and direction of the current chart resolution, calculated by the slope of a 13-period EMA and the slope of a MACD histogram. These are used not as a buying or selling recommendation alone but as trend filters, as per Dr. Elder's own description of them.
Green Bars = The 13-period EMA is sloping positively and the MACD histogram is rising compared to previous bars. The trader should only consider buying/long opportunities when a green bar is most recent.
Red Bars = The 13-period EMA is sloping negatively and the MACD histogram is falling compared to previous bars. The trader should only consider selling/short opportunities when a red bar is most recent.
Blue Bars = The 13-period EMA and the MACD histogram are not aligned. One of the indicators is sloping opposite to the other indicator. These are known as indecision bars and are typically seen near the end of a previously established trend. The trader can choose to wait for either a green or red bar to shape their trading bias if they are more risk-averse while a counter-trend trader may decide to try opening a position against the currently-established trend.
How To Trade the System:
This system is unique in that it is so versatile and will fit the styles of many traders, be it trend following traders (generally the original Elder Impulse System design) or mean-reversion/counter-trend trading (the original Keltner Channel design). None of the examples below or in the chart above are financial advice and are just there for demonstration purposes only.
1) The most basic signal given would be the moving average cross up or down. A cross of the 13-EMA over the 26-EMA signals upward trend strength and the trader could look for buying opportunities. Conversely, the 13-EMA under the 26-EMA shows downward trend strength and the trader could look for selling opportunities.
2) Following the Elder Impulse system in conjunction with the EMAs. Look for long opportunities when a green bar is printed and price is over both of the 13- and 26-period EMAs. Look for short opportunities when a red bar is printed and price is below both of the 13- and 26-period EMAs. Keep in mind this does not necessarily need a moving average cross to be viable, a green or red bar over both EMAs is a valid signal in this system, usually. Examine price more closely for better entry signals when a blue bar is printed and price is either above or below both EMAs if you are a trend trader. This is how Dr. Elder originally intended the system to be used in conjunction with his famous Triple Screen Trading System. I am not going into detail here as it is a deep subject but I would suggest an interested trader to examine this Triple Screen System further as it is widely accepted as a strong strategy.
3) Mean Reversion and Counter-Trend Trading. Dr. Elder mentions that the zone between the two EMAs is called the Value Zone. A mean reversion trader could look for buying opportunities if price has generally been in an uptrend and falls back to value, conversely, they could look for shorting opportunities if price has generally been in a downtrend and rises back to value. These are your very basic pull backs found in trends that create your higher lows in an uptrend or your lower highs in a downtrend. A mean reversion/scalper trader may also look to use the upper and lower most ATR bands as an indication of price being overbought or oversold and could look to enter a counter-trend trade here once a blue indecision bar is printed and to ride that move back down to the Value Zone.
Taking Profits and Risk Management
This system again is very versatile and will fit a wide range of trading styles. It has built in take profit levels and risk management depending on your style of trading.
1a) In original Triple Screen Trading (and the original Elder Impulse system), a trader was to place a buy order one tick above a newly printed green bar with a stop loss one tick below the most recent 2-day low, and vice-versa for red bars on short selling. as long as other criteria were met, that I will not go into. It is all over YouTube and in his books and on Investopedia if you want more information. The general idea is to continue the trend in the direction if price is strong and you are bought into that move with a close stop, or if price falls back a little bit, you can get in at a better price. This would be a system typically better suited to a scalper.
1b) The updated risk management according to the above video is to place a stop loss at least 2ATR away from price. These bands already have calculated these values so a trader can place a stop one tick below the 2 or even 3ATR zones depending on their risk appetite. This is assuming you have already received a strong buy signal based on the system you follow. This would be a system typically better suited to a trend-trader.
2a) Taking profits if you are a trend trader has several possibilities. The first, as Dr. Elder suggests, is to place a price target 2ATR values away from your entry giving you approximately a 1:1 risk-reward ratio.
2b) The second possibility if the trade is successful is to ride the trend upwards until a blue bar is printed, suggesting indecision in the market. A modified version of this that could let a winning trade run longer is to wait for the price to close under the 13-EMA in fast markets, or close under the 26-EMA in slightly slower markets to maximize potential winnings.
2c) A scalper trader may wish to have a target at either the value zone if they are playing an extended buy/short back to the mean, or if they are being at the mean, to sell or cover when price extends back out to the 2x or 3x zone.
3) Trend traders can additionally use the ATR zones as a sort of safety guidelines for entering a trade. Anything within the 1ATR zone is typically a safer entry as the market is less volatile at this time. Entering when price has gone into the 2ATR zone is signaled as a strong momentum move and can signal a stronger move in the direction of the current closing bar. While not always the case, it is suggested by Dr. Elder to not enter trend trades at the 3ATR zone as this is where you will be likely looking for a counter-trend retracement back to value and a trader entering here in the direction of the trade has a higher chance of being stopped out or not getting in at the best possible price.

Moving Average Exponential with Standard Deviation BandThis is standard EMA script available on Trading View and i have just added ability to add a channel based on standard deviation. In addition to it you can enable/disable optional lines from options and it would add 50% levels of upper and under channel. I added 50% as it provide important price levels if you have right settings selected for channel factor.

Exponential MA Channel, Daily Timeframe (Crypto)Moving averages are some of the most common tools for traders. Some of the most widely used ones are simple moving averages (e.g. 20SMA, 50 SMA, 100 SMA, 200SMA,...). There are endless combinations of moving averages that can be used. I prefer to use exponential moving averages because they react more quickly to price data (essentially they filter back through the data over a discrete number of timesteps, with more recent history receiving the highest weighting in the final calculation).
This script uses a combination of the 21EMA, 53 EMA, and 100EMA. The idea of this script is to provide insight into when an asset might be close to a local top/bottom by monitoring price within the middle channel (yellow, blue, and orange lines), as well as identifying longer timeframe opportunities to buy/sell by examining the upper (green) and lower (red) bands. Disclaimer: this is not a guarantee that if price enters a region, that it will be a top or bottom, it is simply an indicator to get an idea based on price history.
As far as I know, this particular combination of exponential moving averages has not yet been published. I do not have an infinite amount of time to check through the entire library of published scripts. If someone else has already done this, I was unaware. Numerical computations were performed on ETHBTC price data in order to find the coefficients used in this script. Essentially, each EMA has a multiplier of either 1, a fraction of 1, or a number larger than 1 (these are the numbers in the script being multiplied by 'out1', 'out2', 'out3'; feel free to change these and see how this changes the indicator). I have found it to be useful for myself, and hope other people can tinker with this idea. My only wish is to allow other people to use this starting point to explore for themselves. I hope that I am allowed to publish this script without it being taken down so that others can freely use it.
Recommendations: although this was fit specifically for ETHBTC, it appears useful for many crypto pairs, specifically alt-BTC pairs and crypto-USD pairs. For example, I have found it useful for BTCUSD, ETHUSD, LINKUSD, LINKBTC, ETHBTC, ADABTC, etc. Only use on the DAILY timeframe.

[francrypto® strategy] 4 EMAs, P.SAR & Vol.Prof. (by kv4coins)(ENG)
This script consists of my own strategy for cryptocurrency (but can be adapted very well for stocks, forex, etc.)
Is a combination of:
- Four Exponentials Moving Average (EMA), configurables: by defect are 10, 21, 55 and 200 periods in yellow, aqua, orange and blue each of them
- Parabolic SAR System (PSAR), configurable
- Volume Profile (that has been developed by kv4coins - he has already authorized me to use it under the same OSS Licence Terms: MPL 2.0), configurable: with another default values and bilingual support for Spanish (SPA)
How it works
1) It is always better to detect specifics candlesticks or patrons: doji , pinbar or inverted pinbar , engulfing bars , morning star or evening star , harami , twizzer bottom or top , etc.
2) The 10 and 21 periods EMA help to identify the short-term behavior
3) The 55 periods EMA can be used like a support or resistance in medium-term, as 200 periods EMA in very long-term
4) It will convenient search for a double cross (10 & 21) or a triple cross (10, 21 & 55) to determine the medium-term change Downtrend to UpTrend (or viceversa)
5) Confirm the change patron with the Parabolic SAR and then identify potencials purchases or sales
6) Use Volume profile to detect potential supports or resistances areas, in order to set stop limit/loss and take profit orders.
Hope this helps!
Cheers,
FRANCRYPTO®
–––––– 0 ––––––
(ESP)
Este script consiste en mi propia estrategia para criptomonedas (pero puede adaptarse muy bien para acciones, forex, etc.)
Es la combinación de:
1) Cuatro Medias Móviles Exponenciales (EMA), configurables: por defecto son de 10, 21, 55 y 200 períodos en amarillo, turquesa, naranja y azul cada una de ellas
2) Sistema Parabolic SAR (PSAR), configurable
3) Perfil de Volumen (que fuera desarrollado por kv4coins - que ya me ha autorizado a su uso bajo las mismas condiciones de la Licencia OSS: MPL 2.0), configurable: con otros valores por defecto y soporte bilingüe para Español (SPA)
Cómo funciona
1) Siempre va a resultar mejor detectar velas japonesas específicas o patrones: doji , martillos o martillos invertidos , velas envolventes , patrón amanecer o atardecer , harami , velas gemelas , etcétera
2) La EMA de 10 y 21 períodos ayudan a identificar el comportamiento de corto plazo
3) La EMA de 55 períodos puede ser usada como un soporte o resistencia de mediano plazo, como así también, la EMA de 200 períodos en el muy largo plazo
4) Será conveniente buscar un doble cruce (10 & 21) o un triple cruce (10, 21 & 55) para determinar un cambio de la tendencia de mediano plazo de bajista hacia alcista (o viceversa)
5) Confirmá el patrón de cambio con la Parabólica de SAR y entonces identificá potenciales compras o ventas
6) Usá el perfil de volumen para detectar las potenciales zonas de soporte o resistencia, principalmente para establecer ordenes stop limit/loss o take profit.
¡Espero que pueda serles de utilidad!
Saludos,
FRANCRYPTO®

Shaded Tripple MAsThree moving averages that have shaded area between its sma and ema versions. Default lengths are 50, 100 and 200.

Custom Multi-Timeframe Screener with AlertsThis is a multi-timeframe screener with alerts. Use this way you can create a screener on indicators using 2 or more timeframes.
In TradingView there is a limit of 40 security function calls. Every timeframe requires another security call so you can screen fewer symbols with any additional timeframe.
In this example, I use 2 timeframes, so the maximum amount of symbols you can scan is 40/2 = 20.
For 3 timeframes - 13, 4tfs - 10, 5tfs - 8 symbols and so on.
In this simplistic example, I require a cross of EMAs on the current timeframe and confirmation that one EMA above/below another from the second timeframe.
Of course, you can create much more complicated functions for this screener.
Params
- higher timeframe
- ema params
- 20 symbol inputs for instruments you want to use in this screener
Alerts
You can create an alert from it easily by selecting the screener name from the list and then selecting "Any alert() function call".
No additional configuration is required, message and alert on close is generated in the code.
You should better change the default name for your alert. Sometimes because of big amount of inputs you might receive an error.
Disclaimer
Please remember that past performance may not be indicative of future results.
Due to various factors, including changing market conditions, the strategy may no longer perform as good as in historical backtesting.
This post and the script don’t provide any financial advice.

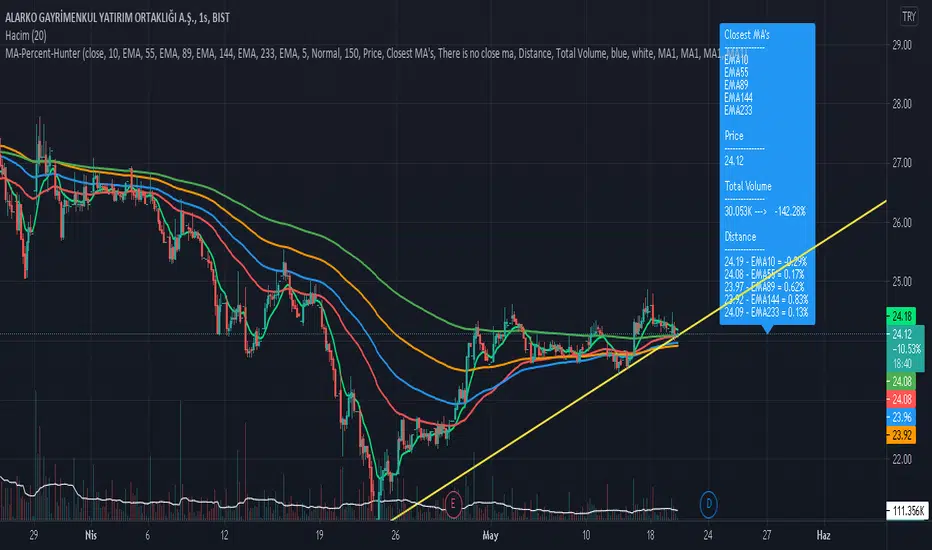
Moving Average Percentage Hunter by HassonyaIn this indicator study, we aim to capture the moving averages to which the bar close is closest. The indicator shows the moving averages, which are closest to the percentage value we selected, on the label. It indicates the names of the closest averages at the top of the label with a (near) note next to them. If none of the averages are close to the specified percentage value, there will be a no nearness warning. The indicator supports the heikin ashi candles. For this setting, check the I'm using heikin ashi candles box.
Thanks to this feature of the indicator, you will be able to see bar proximity to the moving averages you use continuously. You can make purchases and sales by using this feature to your advantage. This way you can easily catch reaction turns.
If you want, you can turn off moving averages in the settings section. You can open it whenever you need. You can do this in the show moving averages box. Appears if you check it, disappears if you uncheck it.
There are 5 moving average options. SMA, EMA, WMA, TMA and HullMA moving averages. Moving average names and values in the list are dynamically adjusted. When you change the settings, the moving average names and values in the list will change automatically. At the bottom of the settings, you can determine the lengths of the moving averages yourself. In the next update, each moving average will have a different average option.
You can enter percentage values, fractional figures. for example (3.5, 5.2 vb.) The indicator will show you the value you give and the proximity of the value below that value. You can adjust this setting in MA Percentage Nearness.
More detailed options will be available in the next update. Range of values, options below, above, and so on.
In the settings section, there is a Show distance option. If you check this option, you can continuously see the percentage values of the distance to the moving averages on the label. For this feature, you have to check the show distance box.
The alarm feature will come in the next update.
Thanks for support. Good Luck.
Custom WaterMark + 4EMA [SilentKreator]4 Ema + Custom Watermark, you can customize everything, in the watermark you can write your name, is a tool to visually protect your work, mainly for streamers and analysts.

Background Color Based on EMAHello Traders,
this is a very simple script. It paints the background color based on the close price in reference to an exponential moving average.
If the close is above the EMA the background color will be green.
If the close is under the EMA the background color will be red.
You can adjust colors and the EMA period by yourself.
This little indicator script is just to get a better overview, for example in combination with other indicators.
Hope you guys like this script. Wish you a great trading week.

Buy/Sell/Hold/Away? This script based on Simple Moving Average and Exponential Moving Average.
The Red Line is an exponential moving average with small length. It act as a main line.
The Black Line is an average of some past data of exponential moving average. Act as Trend Line
The green circles is an exponential moving average with medium length. It act as a signal line.
The Idea is, when the price move higher from it past,past,past, repeatedly in some duration, it will gain enough energy to fly to the highest.
Buy signal when red line cross down green circle. strong buy when red line cross down black line.
Sell signal when red line cross down green circle. strong buy when red line cross down black line.
Additional 1:
Triangle up(blue) indicate Buy Signal. it happen when the price break resistant with some condition and volume>1m
Triangle down(maroon) indicate Sell Signal. it happen when the price break support with some condition and volume>1m
The more triangle show in series, the strong the trend to move accordingly.
Additional 2:
Support and Resistance line.
Hope Benefit To You All.

Bjorgum EMAThis is an answer back to repeated requests for a simple version of Bjorgum Triple EMA Strat, which is not recommended for use with Heiken Ashi candles as it results in "double smoothing" of the averages and can give late signals as a result.
The inputs are raw and super basic. At its core its really just 3 EMAs that you can customize the source and length. The averages and shadowing change color based on if they are either rising or falling.
default values are 5, 9, and 21 EMA on open as source.
Bar color is dictated by the bar close over or under the 5 and 9 EMA.
This is suitable for use on HA candle.
Rainbow Trend IndicatorThis is an indicator based on the MA rainbow concept. It is possible to choose between 15 or 20 MA's and if all 15 MA's is picked, the calculation will be calculated on 15 MA's and if 20 is picked the calculation is calculated on 20 MA's. The indicator will then be a line which is assigned a value from the calculation based on the MA's. If the line is above the dashed zero line, meaning the line's last value is a positive value, the price is in a uptrend and if the line is below the dashed zero line, meaning the line's last value is a negative value, the price is in a downtrend.
In short
If the line is green, the price is in a uptrend. If the line is red, the price is in a downtrend.

EMA Cross Levels + Standard DeviationPlots the price level that the most recent EMA crossover occurred at(Green if bullish and red if bearish).
Also calculates standard deviation over a shorter window-length/lookback period (of 'n_std_fast' length) and another over a much longer span of periods(n='n_std_slow', > 'n_std_fast').
These are the two dotted lines appearing as bands around the cross-level line.

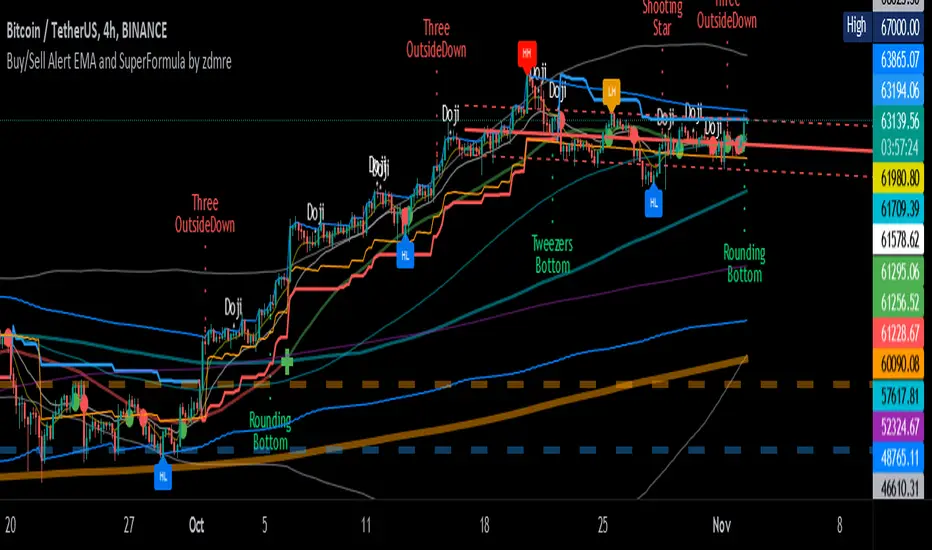
Buy/Sell Alert EMA with SuperFormula by zdmre*** Use it at your own risk
This indicator has 3 indicators and gives a buy/sell signal depending on the EMA.
3 indicators:
- Ichimoku
- Bollinger Band
- EMA
It also shows the value on the candle as a warning in the Buy and Sell signals. This value is calculated with a special formula I have created.
On the other hand Bollinger Band and Ichimoku Cloud are also included to check the accuracy of the signals.
For this indicator, I recommend a minimum of 4 hours chart.
Custom Moving Average (EMA & SMA)This script is a custom visualization tool to plot 4 Moving Averages (MA).
Each MA is customizable; you can:
enable (disable) the plot of MA;
select whether the MA is an EMA or an SMA;
the length;
the source (open, close, ...);
the offset value (default is 0).
Note:
The 1st MA is an EMA with length 50.
The others MAs are SMA with length 9, 30 and 100 respectively.

Multiple Time Frames Moving Averages (x3)This indicator is a set of 3 moving averages for which you can configure the type of the moving averages , their length , and of course the time frame . The moving averages you can choose from are:
- Simple Moving Average ( SMA )
- Exponential Moving Average ( EMA )
- Weighted Moving Average ( WMA )
- Running Moving Average (RMA)
- Hull Moving Average ( HMA )
- Volume Weighted Moving Average ( VWMA )
- Arnaud Legoux Moving Average ( ALMA )
The time-frames you can choose from - minutes (1, 3, 5, 15, 45), hours (1, 2, 3, 4, 12), days (1, 3), weekly or monthly .
Overall, it is a minimalistic indicator. No major improvements or trading logic like some of my other indicators, but I did make it slightly easier to use and visually appealing. The MAs' colors change from light to dark green/blue/red depending on the trend - bullish or bearish respectively. Initially, those were changing from green to red (based on direction) but it became a bit confusing when they started crossing each other. Anyway, feel free to change those colors to whatever you like.
If you have suggestions on how to improve this indicator or ideas about new ones, please drop me a line. Thanks.

