Crypto Flow Index (CFI) - RS vs BTC/ETH ---
Crypto Flow Index, CFI
Crypto Flow Index, CFI, measures relative strength between an asset and Bitcoin or Ethereum.
You use CFI to judge whether capital favors your asset or the benchmark.
CFI does not give entry or exit signals.
You use CFI as a bias and context tool.
---
What CFI measures
Relative strength money flow on the BASE/BTC or BASE/ETH pair.
Volume weighted pressure, not price alone.
Momentum blended into flow to smooth rotations.
Optional USD trend filter using fast and slow EMAs.
---
How to read CFI
Above 50 means relative strength favors the asset.
Below 50 means relative strength favors BTC or ETH.
Rising CFI shows strengthening relative demand.
Falling CFI shows weakening relative demand.
---
Histogram
Green bars show positive relative flow.
Red bars show negative relative flow.
Larger bars signal stronger pressure.
---
Bias ribbon
Green ribbon shows bullish relative bias.
Red ribbon shows bearish relative bias.
Gray ribbon shows transition or balance.
---
How to use CFI
Favor long trades when CFI stays above 50.
Avoid longs when price rises but CFI falls.
Spot rotations before price reacts.
Combine with structure, entries, and risk rules.
---
Important limits
CFI compares assets only to BTC or ETH.
CFI does not represent the entire crypto market.
USD price and relative strength often diverge.
---
Core question CFI answers
Is your asset gaining or losing strength versus Bitcoin or Ethereum.
---
ETHUSD

Filter Wave1. Indicator Name
Filter Wave
2. One-line Introduction
A visually enhanced trend strength indicator that uses linear regression scoring to render smoothed, color-shifting waves synced to price action.
3. General Overview
Filter Wave+ is a trend analysis tool designed to provide an intuitive and visually dynamic representation of market momentum.
It uses a pairwise comparison algorithm on linear regression values over a lookback period to determine whether price action is consistently moving upward or downward.
The result is a trend score, which is normalized and translated into a color-coded wave that floats above or below the current price. The wave's opacity increases with trend strength, giving a visual cue for confidence in the trend.
The wave itself is not a raw line—it goes through a three-stage smoothing process, producing a natural, flowing curve that is aesthetically aligned with price movement.
This makes it ideal for traders who need a quick visual context before acting on signals from other tools.
While Filter Wave+ does not generate buy/sell signals directly, its secure and efficient design allows it to serve as a high-confidence trend filter in any trading system.
4. Key Advantages
🌊 Smooth, Dynamic Wave Output
3-stage smoothed curves give clean, flowing visual feedback on market conditions.
🎨 Trend Strength Visualized by Color Intensity
Stronger trends appear with more solid coloring, while weak/neutral trends fade visually.
🔍 Quantitative Trend Detection
Linear regression ordering delivers precise, math-based trend scoring for confidence assessment.
📊 Price-Synced Floating Wave
Wave is dynamically positioned based on ATR and price to align naturally with market structure.
🧩 Compatible with Any Strategy
No conflicting signals—Filter Wave+ serves as a directional overlay that enhances clarity.
🔒 Secure Core Logic
Core algorithm is lightweight and secure, with minimal code exposure and strong encapsulation.
📘 Indicator User Guide
📌 Basic Concept
Filter Wave+ calculates trend direction and intensity using linear regression alignment over time.
The resulting wave is rendered as a smoothed curve, colored based on trend direction (green for up, red for down, gray for neutral), and adjusted in transparency to reflect trend strength.
This allows for fast trend interpretation without overwhelming the chart with signals.
⚙️ Settings Explained
Lookback Period: Number of bars used for pairwise regression comparisons (higher = smoother detection)
Range Tolerance (%): Threshold to qualify as an up/down trend (lower = more sensitive)
Regression Source: The price input used in regression calculation (default: close)
Linear Regression Length: The period used for the core regression line
Bull/Bear Color: Customize the color for bullish and bearish waves
📈 Timing Example
Wave color changes to green and becomes more visible (less transparent)
Wave floats above price and aligns with an uptrend
Use as trend confirmation when other signals are present
📉 Timing Example
Wave shifts to red and darkens, floating below the price
Regression direction down; price continues beneath the wave
Acts as bearish confirmation for short trades or risk-off positioning
🧪 Recommended Use Cases
Use as a trend confidence overlay on your existing strategies
Especially useful in swing trading for detecting and confirming dominant market direction
Combine with RSI, MACD, or price action for high-accuracy setups
🔒 Precautions
This is not a signal generator—intended as a trend filter or directional guide
May respond slightly slower in volatile reversals; pair with responsive indicators
Wave position is influenced by ATR and price but does not represent exact entry/exit levels
Parameter optimization is recommended based on asset class and timeframe

Asset vs Total Market Cap & Relative Strength Purpose
This indicator allows traders to compare a selected asset to the major market benchmarks:
BTC – primary crypto market leader
ETH – secondary crypto market leader
USDT.D – shows market risk-on vs risk-off sentiment
TOTAL – total crypto market capitalization, useful for overall market trends
It also provides relative strength calculations:
Rel. Strength = Asset % change - USDT.D % change
Rel. Strength vs Total = Asset % change - Total % change
This allows you to see if your asset is outperforming or underperforming broader benchmarks.
The table covers multiple timeframes, making it easy to scan both short-term and longer-term trends:
Row Timeframe
0 Current
1 15m
2 1H
3 4H
4 1D
Selected Asset / BTC / ETH:
Green for positive % change
Red for negative % change
Gradient intensity proportional to magnitude (maxAbsChange input)
USDT.D:
Orange if rising (risk-off)
Teal if falling (risk-on)
Total Market Cap / Rel. Strength:
Gradient reflects asset performance relative to total market, independent of USDT.D.
Positives
Compact dashboard: Everything is in one table for quick scanning.
Multi-timeframe comparison: Traders can instantly see short-term vs long-term strength.
Relative performance visualization: Gradients immediately highlight outperformers and underperformers.
Benchmark comparisons: Asset vs BTC, ETH, USDT.D, and Total Market Cap.
Independent Rel. Strength: Highlights whether the asset is outperforming even if the total market moves.
Customizable gradient sensitivity: maxAbsChange and maxRelChange allow tuning how “strong” the colors appear.
Chart plotting: Rel. Strength vs total market is plotted for further visual reference.
How to Use
Green table cells → strong positive movement
Red table cells → negative movement
Rel. Strength > 0 → asset outperforming
Rel. Strength < 0 → asset underperforming
Use table to compare relative performance vs BTC, ETH, and total market for informed trading decisions.

Mutanabby_AI __ OSC+ST+SQZMOMMutanabby_AI OSC+ST+SQZMOM: Multi-Component Trading Analysis Tool
Overview
The Mutanabby_AI OSC+ST+SQZMOM indicator combines three proven technical analysis components into a unified trading system, providing comprehensive market analysis through integrated oscillator signals, trend identification, and volatility assessment.
Core Components
Wave Trend Oscillator (OSC): Identifies overbought and oversold market conditions using exponential moving average calculations. Key threshold levels include overbought zones at 60 and 53, with oversold areas marked at -60 and -53. Crossover signals between the two oscillator lines generate entry opportunities, displayed as colored circles on the chart for easy identification.
Supertrend Indicator (ST): Determines overall market direction using Average True Range calculations with a 2.5 factor and 10-period ATR configuration. Green lines indicate confirmed uptrends while red lines signal downtrend conditions. The indicator automatically adapts to market volatility changes, providing reliable trend identification across different market environments.
Squeeze Momentum (SQZMOM): Compares Bollinger Bands with Keltner Channels to identify consolidation periods and potential breakout scenarios. Black squares indicate squeeze conditions representing low volatility periods, green triangles signal confirmed upward breakouts, and red triangles mark downward breakout confirmations.
Signal Generation Logic
Long Entry Conditions:
Green triangles from Squeeze Momentum component
Supertrend line transitioning to green
Bullish crossovers in Wave Trend Oscillator from oversold territory
Short Entry Conditions:
Red triangles from Squeeze Momentum component
Supertrend line transitioning to red
Bearish crossovers in Wave Trend Oscillator from overbought territory
Automated Risk Management
The indicator incorporates comprehensive risk management through ATR-based calculations. Stop losses are automatically positioned at 3x ATR distance from entry points, while three progressive take profit targets are established at 1x, 2x, and 3x ATR multiples respectively. All risk management levels are clearly displayed on the chart using colored lines and informative labels.
When trend direction changes, the system automatically clears previous risk levels and generates new calculations, ensuring all risk parameters remain current and relevant to existing market conditions.
Alert and Notification System
Comprehensive alert framework includes trend change notifications with complete trade setup details, squeeze release alerts for breakout opportunity identification, and trend weakness warnings for active position management. Alert messages contain specific trading pair information, timeframe specifications, and all relevant entry and exit level data.
Implementation Guidelines
Timeframe Selection: Higher timeframes including 4-hour and daily charts provide the most reliable signals for position trading strategies. One-hour charts demonstrate good performance for day trading applications, while 15-30 minute timeframes enable scalping approaches with enhanced risk management requirements.
Risk Management Integration: Limit individual trade risk to 1-2% of total capital using the automatically calculated stop loss levels for precise position sizing. Implement systematic profit-taking at each target level while adjusting stop loss positions to protect accumulated gains.
Market Volatility Adaptation: The indicator's ATR-based calculations automatically adjust to changing market volatility conditions. During high volatility periods, risk management levels appropriately widen, while low volatility conditions result in tighter risk parameters.
Optimization Techniques
Combine indicator signals with fundamental support and resistance level analysis for enhanced signal validation. Monitor volume patterns to confirm breakout strength, particularly when Squeeze Momentum signals develop. Maintain awareness of scheduled economic events that may influence market behavior independent of technical indicator signals.
The multi-component design provides internal signal confirmation through multiple alignment requirements, significantly reducing false signal occurrence while maintaining reasonable trade frequency for active trading strategies.
Technical Specifications
The Wave Trend Oscillator utilizes customizable channel length (default 10) and average length (default 21) parameters for optimal market sensitivity. Supertrend calculations employ ATR period of 10 with factor multiplier of 2.5 for balanced signal quality. Squeeze Momentum analysis uses Bollinger Band length of 20 periods with 2.0 multiplication factor, combined with Keltner Channel length of 20 periods and 1.5 multiplication factor.
Conclusion
The Mutanabby_AI OSC+ST+SQZMOM indicator provides a systematic approach to technical market analysis through the integration of proven oscillator, trend, and momentum components. Success requires thorough understanding of each element's functionality and disciplined implementation of proper risk management principles.
Practice with demo trading accounts before live implementation to develop familiarity with signal interpretation and trade management procedures. The indicator's systematic approach effectively reduces emotional decision-making while providing clear, objective guidelines for trade entry, management, and exit strategies across various market conditions.

Reversal IndicatorWhat does this indicator do?
This indicator is designed to help traders spot potential reversal points in the market by combining multiple conditions:
✅ Multi-Timeframe RSI – Checks RSI on a lower timeframe (like 5m) to see if the market is oversold or overbought.
✅ Higher Timeframe SMA Filter – Uses a higher timeframe SMA (like 1h) as a trend filter, so signals only trigger in the direction of the bigger trend.
✅ Candle Pattern Confirmation – Looks for bullish or bearish engulfing candles to confirm price exhaustion before signaling a reversal.
When all these conditions align, the indicator plots a triangle under/above the candle to highlight a possible reversal.
Why is this useful?
Many traders struggle with false RSI signals or candle patterns that fail because they don’t respect the larger trend.
This indicator filters out weak setups by requiring alignment between:
A lower timeframe RSI oversold/overbought condition,
A higher timeframe trend filter (SMA),
And a strong candle reversal pattern.
This multi-layer approach helps avoid chasing every RSI dip and focuses only on high-probability reversal zones.
How does it work?
Bullish reversal signal → appears when RSI on the lower TF is oversold, price is still above the higher TF SMA (trend still intact), AND a bullish engulfing candle forms.
Bearish reversal signal → appears when RSI on the lower TF is overbought, price is below the higher TF SMA, AND a bearish engulfing candle forms.
When all conditions match, the indicator plots a triangle under the candle for bullish signals and above the candle for bearish signals.
How to use it?
Choose your timeframes:
A timeframe for trend filtering (e.g. 1h).
A timeframe for RSI (e.g. 4h).
NOTICE: THE RSI TIMEFRAME SHOULD BE GREATER THEN THE TIMEFRAME FOR THE SMA
Otherwise it will not generate that much signals.
Watch for signals ONLY in the direction of the higher trend.
Use the signals as potential reversal points, not as guaranteed entries. Combine with your own confluence.
Optionally set alerts for bullish or bearish reversal conditions so you never miss a setup.
Customization
✅ Choose your RSI length & overbought/oversold levels.
✅ Select which timeframes you want for SMA & RSI.
✅ Toggle the higher TF SMA display on/off.
✅ Adjust signal appearance (triangles).
Important Notes
⚠️ This is not a standalone trading system. It’s a tool to help spot possible reversal areas. Always confirm with price action, support/resistance, or your own strategy

Comparison with BTC (RSI)显示当前品种与BTC汇率对的RSI值
以此判断强势或弱势品种以及超买超卖
——————————
Display the RSI value of the exchange rate between the current variety and BTC
Use this to determine strong or weak varieties, as well as overbought and oversold

Crypto Trend IndicatorThe Crypto Trend Indicator is a trend-following indicator specifically designed to identify bullish and bearish trends in the price of Bitcoin, and other cryptocurrencies. This indicator doesn't provide explicit instructions on when to buy or sell, but rather offers an understanding of whether the trend is bullish or bearish. It's important to note that this indicator is only useful for trend trading.
The band is a visual representation of the 30-day and 60-day Exponential Moving Average (EMA). When the 30-day EMA is above the 60-day EMA, the trend is bullish and the band is green. When the 30-day EMA is below the 60-day EMA, the trend is bearish and the band is red. When the 30-day EMA starts to converge with the 60-day EMA, the trend is neutral and the band is grey.
The line is a visual representation of the 20-week Simple Moving Average (SMA) in the daily timeframe. "Bull" and "Bear" signals are generated when the 20-day EMA is either above or below the 20-week SMA, in conjunction with a bullish or bearish trend. When the band is green and the 20-day EMA is above the 20-week SMA, a “Bull” signal emerges. When the band is red and the 20-day EMA is below the 20-week SMA, a “Bear” signal emerges. The 20-week SMA can potentially also function as a leading indicator, as substantial price deviations from the SMA typically indicate an overextended market.
While this indicator has traditionally identified bullish and bearish trends in various cryptocurrency assets, past performance does not guarantee future results. Therefore, it is advisable to supplement this indicator with other technical tools. For instance, range-bound indicators can greatly improve the decision-making process when planning for entries and exits points.

Cryptocurrency Market Sentiment v1.0Introduction:
Capable of observing the market sentiment of the cryptocurrency market
The relative status of BTC and altcoins
How it works:
1. The general uptrend process of the cryptocurrency market is BTC → ETH → high-cap altcoins → low-cap altcoins. When funds cannot push up BTC's market cap, funds gradually flow into smaller-cap altcoins until the upward trend ends.
2. Select ETH as the representative of altcoins, and understand the sentiment and current stage
3. Mathematical principle : divide the price of ETH by the price of BTC, and then apply it to the RSI formula .
How to use it:
1. Similar to the RSI indicator , when CMS enters the overbought zone, it represents an active altcoin market, a passionate market sentiment , and the end of the uptrend.
2. When CMS enters the oversold zone, it indicates the leading stage of BTC in the rising trend or the capital flow back to BTC in the declining process .
3. If CMS is at a low level, long positions should focus on altcoins, and short positions should focus on BTC, and vice versa.
----------------------------------------------------------------------------------------------------------
简单介绍:
能够观察加密市场市场情绪
BTC和寨币的相对状态
如何工作:
1、加密市场一般的上涨过程为 BTC → ETH → 大市值山寨 → 小市值山寨,当资金无法推动大市值的BTC上涨时,资金就会逐渐流向市值较小的山寨,直到一轮上涨结束。
2、选取ETH作为altcoins的代表,通过ETH与BTC的关系来了解加密市场的情绪和目前上涨的阶段。
3、数学原理:将ETH的价格/BTC的价格,随后将其带入RSI公式
如何使用:
1、与RSI指标类似,当cms进入超买时,代表寨币市场的活跃,市场情绪热烈,上涨进入尾声。
2、当cms进入超卖时,为上涨中BTC领涨的阶段或下降过程中资金回流BTC。
3、如果cms在低位,做多应关注altcoins,做空应关注btc,反之亦然。

Customizable Moving Average RibbonThis indicator is a highly customizable moving average ribbon with some unique features.
This script can utilize multiple unique sources, including a non-repainting renko closing price. Renko charts focus solely on price movement and minimize the impacts of time and the extra noise time creates. Employing the renko close helps smooth out the MA ribbon. Insignificant price movements will not cause a change in the plotted lines of the indicator unless a new threshold is breached or a "brick" is created. This is highly useful for quickly identifying consolidation areas or overall flat price movement.
There are two methods for selecting the box size when utilizing the renko source. Box size is critical for the overall function and efficacy of the plots you will visually see with this indicator. Box size is set automatically using the Average True Range "ATR" or manually using the "Traditional" setting. The simplest way to determine a manual box size is to take the ATR of the given instrument and round it to the nearest decimal place. As an example, if the ATR for the asset is 0.18, you would round that number to 0.2 and utilize this as your traditional box size.
The MA ribbon contains eleven adjustable moving average lines. Users can choose to turn off as many as they would like. Users can also adjust the length of the individual moving averages and the source for all moving averages. There are nine types of moving averages to choose from for the ribbon. The MA options are:
Exponential Moving Average = 'EMA'
Double Exponential Moving Average= 'DEMA'
Triple Exponential Moving Average = 'TEMA'
Simple Moving Average = 'SMA'
Relative Moving Average = 'RMA'
Volume Weighted Moving Average = 'VWMA'
Weighted Moving Average = 'WMA'
Smoothed Simple Moving Average = 'SSMA'
Hull Moving Average = 'HULL'
We believe that the ribbons features, including the line color change, help quickly identify trends and give users optimum customization. Users can select from five different color schemes including:
Green/Red
Purple/White
White/Blue
Silver / Orange
Teal/ Orange

Price Distance RatioThis study plots the ratio between current price and the price N days ago.
With N input that is configurable, users can find optimal long/short entries when price is in an established trend and price has diverge far from a given local peak or all time high.
With many years of stock trading the analysis indicates a connection between the distance of price and subsequent returns.
Portfolios of stocks with lower price to local highes ratios generally underperformed portfolios of stocks with higher prices to peaks reached similar N days ago.
The highest returns to previous peak are recorded when buying at the biggest dip.
For example, the purchase at 20% drawdown could generate 25% when price returns to the peak. The purchase at 50% drawdown could generate bigger, i.e. 100% return, when price returns to the peak. And the purchase at 90% drawdown could generate much bigger, i.e. 900% return, in a case the price returns to the peak.
However, buying very far below local peaks on almost all holding periods produces lower CAGR returns because of "timing adjustment". In simple words, typically the drawdown takes less time vs. further recovery.
For example:
👉 The largest BTC drawdown in 2013-2015 took 410 days (Peak-to-Valley) . And the recovery of BTC to new highs took 771 days (Valley-to-Peak) after that.
👉 The 3rd longest drawdown in BTC took 363 days (observed from December 17, 2017 to December 15, 2018). And further recovery in BTC to its new high took almost two years - 716 days .
👉The 4th longest drawdown in BTC took 162 days (observed from June 08, 2011 to November 17, 2011). And further recovery in BTC to its new high took more than a year - 469 days .
The concept of this study could recognizes at least 4 different modes of action.
👉 In a clearly established upward trend traders should be buying (following the trend) when Ratio is above 100% and reducing the size when Ratio turns below 100%.
👉 Conversely, in a clearly established downward trend traders should be shorted when Ratio is below 100% and covering when the Ratio turns back to 100%.
👉 In a sideways movement traders are advised to wait carefully if the Ratio near 100% for a long time, and take a position the trend is clear.
👉 Chartists can analyze the dynamic of the indicator - both in terms of trends and overall level. For example as it shown at the chart.
The understading of the study and rules of "timing adjustments" could genarate the awesome opportunities for stock options traders also, with strategies of selling uncovered call options and vertical call spreads.
// Many thanks to @HPotter and @Wheeelman wizards for their continious support and assistance.

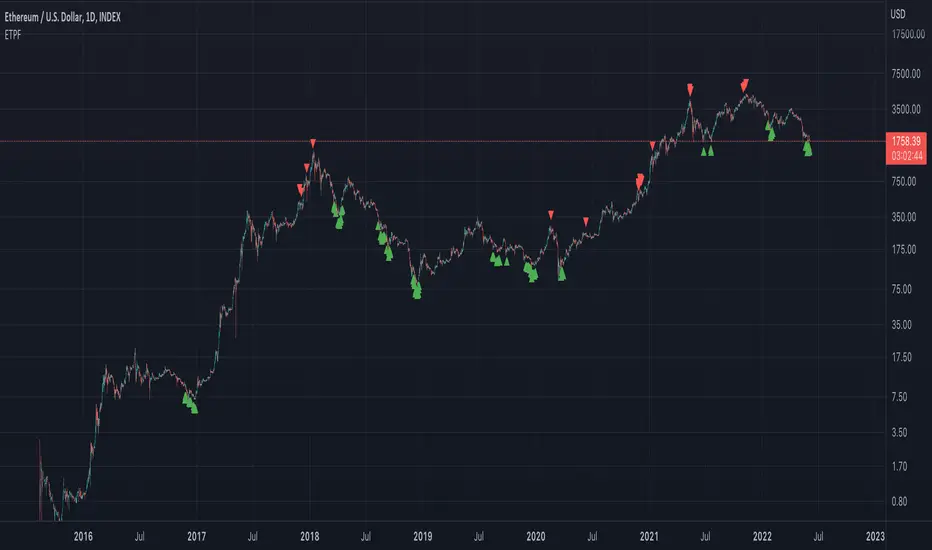
Exponential Top and Bottom FinderThis is an indicator to identify possible tops and bottoms after exponential price surges and drops, it works best on ETH 1D, but you can also use it for bitcoin and altcoins.
It's based on stochastic first and second derivatives of a close moving average

ETH Top Cap [jamesray]This script is modified from Top Cap , as published here.
Historically it matches market tops for ETH

Vix SpikeThis script calculates spikes Vix tops and bottoms. The Vix Market Bottom is calculated using CM_Williams_Vix_Fix Finds Market Bottoms (Chris Moody). The Vix Market Top is calculated as the inverse of CM Williams’ formula.
The highest Vix Bottom and the highest Vix Top are averaged (over the Highest Vix Lookback period).
Buys are signaled when the Vix Bottom line crosses below the Highest Vix Average.
Sells are signaled when the Vix Top line crosses below Highest Vix Average.
BINANCE:ETHUSDT 5 min
BYBIT:XRPUSD 5 min

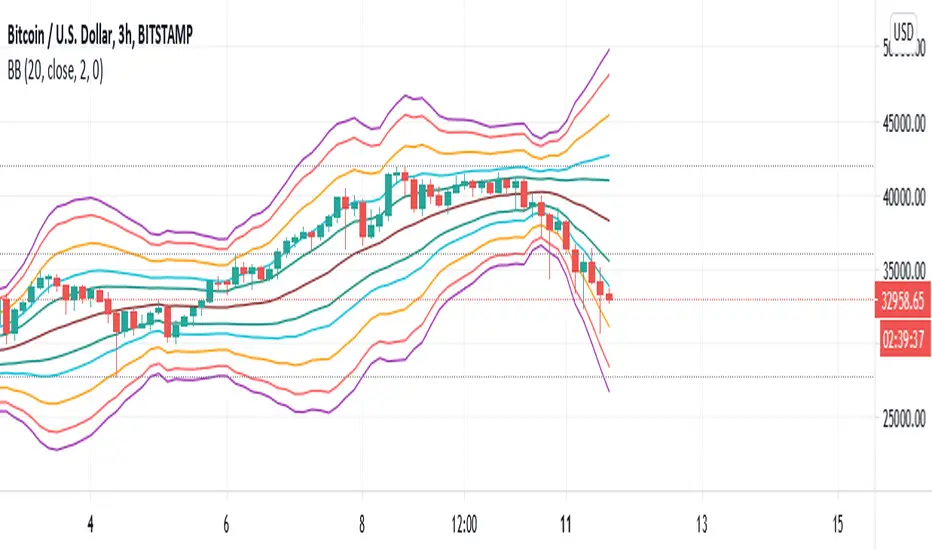
Bollinger Bands Fibonacci Ratio Standard Deviation LINESHello Traders.
in this script, Bollinger bands are made based on a standard deviation with respect to Fibonacci ratios. I hope you can be satisfied. If you are satisfied with this script, please like and feel free to share your comments with me.
Teal Upper and Lower B-Bands = 1.0 Standard Deviation
Aqua Upper and Lower B-Bands = 1.618 Standard Deviation
Orange Upper and Lower B-Bands = 2.618 Standard Deviation
Red Upper and Lower B-Bands = 3.618 Standard Deviation
Purple Upper and Lower B-Bands = 4.236 Standard Deviation
you can use this indicator by clicking the button (Add to Favorite Scripts) and then add it to your chart from (Fx) section.
KINSKI RSI Short/LongExtends the display of the Relative Strength Index (RSI) by shorts and longs from Bitmex and shows them as a diagram.
How to interpret the display?
- blue line is the default Relative Strength Index
- red line means "oversold
- green line "overbought"
- grey dotted line up/down indicates the optimal range for up and down movements 30 to 70
- in general, the reaching or crossing of the thresholds in the direction of the mid-range is seen as a possible buy or sell signal
- RSI values (blue line) of over 70 percent are considered "overbought", values below 30 percent "oversold
Which settings can be made?
- Selection for the "Currency". Default value is "BTCUSD". Currently only the following currencies are supported "BTCUSD", "ETHUSD", "ETCUSD", "OMGUSD", "XLMUSD", "XTZUSD".
- Selection for calculation formula ("Calculation"). The default value is "hlc3".
- Field for the moving average value ("RSI Length"). The default value is 14, but values of 7, 9 or 25 are also common. The shorter the period under consideration, the more volatile the indicator is, but with longer periods, fewer signals are triggered.
- furthermore you can make layout adjustments via the "Style" menu

Simple EMA trend indicatorSimple EMA trend indicator , pretty straightforward green equates to bullish and usually a retest/wick is often seen , same for the flipside viceversa


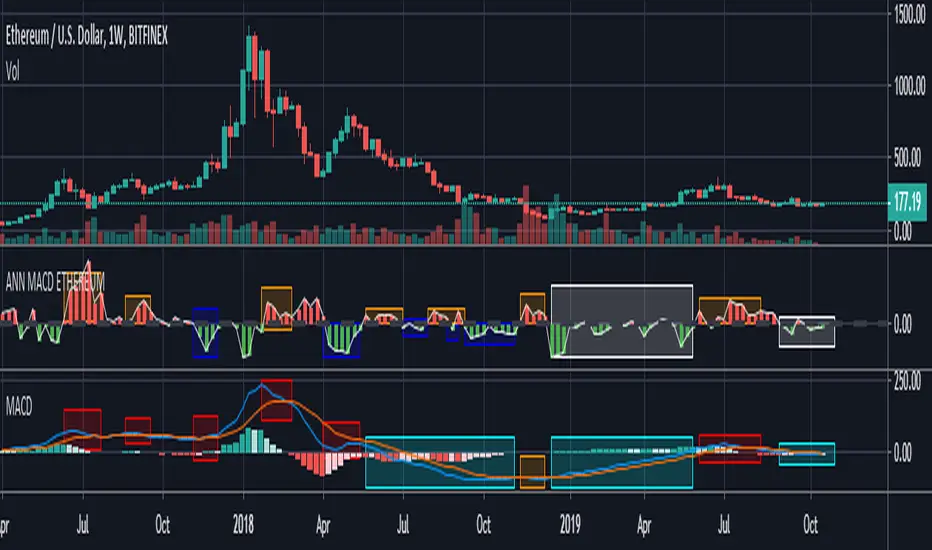
ANN MACD ETHEREUM
This script is trained with Ethereum (Timeframe : 4 hours ).
Details :
Input columns: 19
Output columns: 1
Excluded columns: 0
Training example rows: 300
Validating example rows: 0
Querying example rows: 0
Excluded example rows: 0
Duplicated example rows: 0
Input nodes connected: 19
Hidden layer 1 nodes: 8
Hidden layer 2 nodes: 1
Hidden layer 3 nodes: 0
Output nodes: 1
Learning rate: 0.7000
Momentum: 0.8000
Training error: 0.009378 ( That's a very good error coefficient. )
Many thanks to wroclai for help.
Deep learning series will continue!
Pivot Point Reversal + RSI AlertsThese are alerts for previously published strategy:
This strategy joins the Pivot Reversal strategy with the RSI indicator.
We check RSI level at the pivot point level and only if RSI condition is satisfied we update levels for stop orders.

Welles Wilder MAHow to trade:
Recommended for longer timeframes at least 4H.
Buy when the green dot appears.
Sell when the yellow dot appears.
Welles Wilder moving average by XOOOOOO

ETH HawkEye Aggregated Volume IndicatorThis is combined Aggregated ETH Exchange Volume by Neobutane with HawkEye volume clone indicator by LazyBear.
Indicator includes aggregated raw ETH volume from 7 user selectable fiat and tether exchanges on USD, USDT, BTC, EUR, GBP, JPY pairs + Exponential MA + hawkeye bar coloring where: green is bullish volume , red - bearish and white - volume neutral to the market:
Bitfinex
Coinbase
Bitstamp
Kraken
Binance
Poloniex
Bittrex
*There is a TV bug that doesn't display a whole volume history if some pair was added later than date intended to be analysed by operator eg, if you want to watch older data you should exclude all secondary pairs that were added later and switch off "newer" exchanges like Binance.

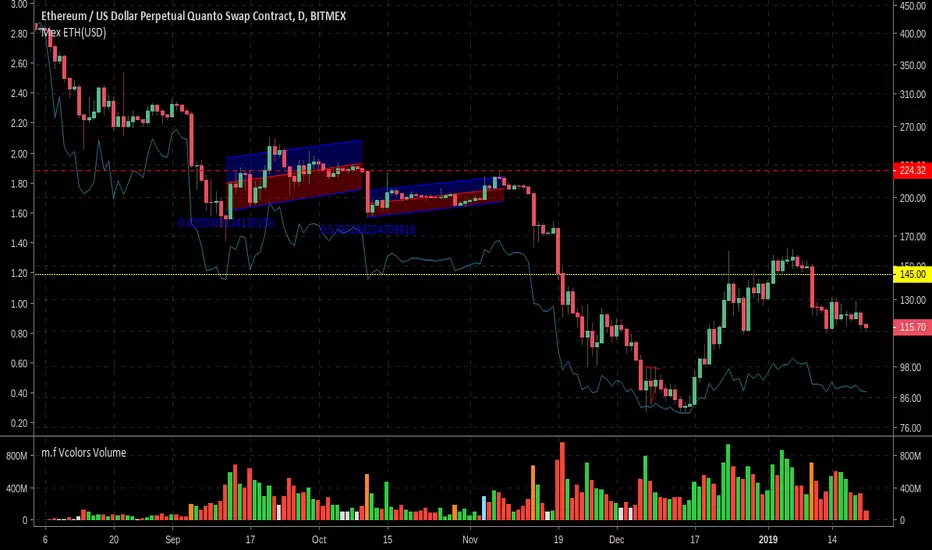
BitMEX ETHUSD contract value (USD)The ETHUSD Quanto Swap contract on BitMEX allows you to trade ETHUSD with Bitcoin put forward as collateral. However this means that 1 contract is not equal to 1 USD or 1 ETH, but instead varies according to the price of ETHUSD.
You can see the contract specs here www.bitmex.com and find more information here blog.bitmex.com
My advice is always to make sure you fully understand a derivative product before you trade it, however many of us may not have the acumen to actually understand how a quanto swap works. Nevertheless, we have to be aware that the value in USD of each contract depends on the price of Ethereum and also the price of Bitcoin at each point in time.
This tool will show you the value of a single ETHUSD contract in USD, but it solely for indicative purposes only. Your trade, your risk. I do not ask for any donations from your gains and I am not liable for any of your losses.
Source code is provided.
Note in the example image that the price of ETHUSD is plotted on a logarithmic scale but the indicative contract value is linear.