ETF 3-Day Reversion StrategyIntroduction: This strategy is a modification of the “3-day Mean Reversion Strategy” from the book "High Probability ETF Trading" by Larry Connors and Cesar Alvarez. In the book, the authors discuss a high-probability ETF mean reversion strategy for a 1-day time-frame with these simple rules:
The price must be above the 200 day SMA and below the 5 day SMA.
The low of today must be lower than the low of yesterday (must be true for 3 consecutive days)
The high of today must be lower than the high of yesterday (must be true for 3 consecutive days)
If the 3 rules above are true, then buy on the close of the current day.
Exit when the closing price crosses above the 5 day SMA.
In practice and in backtesting, I’ve found that the strategy consistently works better when using an EMA for the trend-line instead of an SMA. So, this script uses an EMA for the trend-line. I’ve also made the length of the exit EMA adjustable.
How it works:
The Strategy will buy when the buy conditions above are true. The strategy will sell when the closing price crosses over the Exit Moving Average
Plots:
Green line = Exit Moving Average (Default 5 Day EMA)
Blue line = 5 Day EMA (Used as Entry Criteria)
Disclaimer: Open-source scripts I publish in the community are largely meant to spark ideas that can be used as building blocks for part of a more robust trade management strategy. If you would like to implement a version of any script, I would recommend making significant additions/modifications to the strategy & risk management functions. If you don’t know how to program in Pine, then hire a Pine-coder. We can help!
ETF

Moses Long-term Index ETF Investing StrategyMoses is a script designed for long-term Index ETF investors.
Moses Goals.
1. Alerts you when a major crash is starting or is underway (Bear Market Signal)
2. Warn you of price events in the market that may lead to increased volatility and downward price pressure (Shock Event Warning)
3. Clearly inform you when the market is in a bull phase (growing) or bear phase (decreasing) (Bull/Bear Signal)
4. Inform you if the market is showing early signs of recovery from a crash
5. Alert you to catastrophic events, which are extreme one bar price drops (typically occurring before or during a major stock market crash)
Moses Logic.
Moses is the product of years of testing, but the application of the logic is simple.
1. Moses is designed specifically to work on a weekly chart (5 days per bar). Do not use the scripts on daily, monthly, or intraday charts
2. Moses Uses 4 Moving Average Indicators
3. Moses uses the position of price and the moving averages to determine the state of the market (Bull/Bear/Recovery)
4. Moses uses price action to determine shock events and catastrophic event warnings
5. The script is hardcoded to start trading in 1997. Why? So that the script's primary goal of avoiding crashes is tested on 3 major crashes, the Dotcom 2000, the Financial Crisis 2008, and the Corona Crash in 2020.
How Moses Works
Being able to exit the market before or during a large market crash enables you to preserve a portion of your equity from decline. Buying back into the market on a Bull Market or Early Recovery Signal enables you to enter the market at a lower price. This goal is achieved during major crashes.
As with all scripts, there are false signals which may incur a losing trade; you can see in the strategy tester results the % of Winning/Losing Trades.
Strategy Setup In Tradingview
Initial Capital $10,000
Order Size 100% of equity (this is because it is a long-term strategy with only one trade in play – you are either long or not invested, using a smaller position size means you cannot meaningfully compare a Moses strategy to a Buy & Hold Strategy)
Commission is $5 per trade (this is negligible because the strategy only trades at most once per year)
Slippage – 10 ticks
This Script Displays the 5 Main MOSES Signals Directly On Your Chart To Help Your Investing Decision Making
1. Bull Market Signal - Green
2. Bear Market Signal - Red
3. Stock Market Recovery Signal - Amber/Yellow
4. Shock Event Warning - Shock Label on Price
5. Catastrophic Event Warning - Red Catastrophe Label
Includes 5 Moses Scripts
• Moses Signals 2.0 (plots all alerts directly on the price chart)
• Moses Buy on Bull - Sell on Bear (Plots a buy on the first Bull Market Signal - Closes All Positions on a Bear Market Signal)
• Moses Buy on Bull - Sell on Catastrophe (Plots a buy on the first Bull Market Signal - Closes All Positions on a Catastrophic event)
• Moses Buy on Recovery - Sell on Catastrophe (Plots a buy on the first Recovery Signal - Closes All Positions on a Catastrophic Event)
• Buy & Hold Script (Used to compare the effectiveness of the strategies versus a Buy and Hold Strategy)
As the script has 3 Moses Strategies, the idea is that you choose the strategy that best fits the ETF you are trading.
Moses is a long-term investing strategy that has historically outperformed the US and European Major Indices for the last 24 years. There is no guarantee of future performance.
Moses has outperformed the market (buy and hold strategy) from 1997 on the:
Nasdaq 100, S&P500, Russell 3000, Nasdaq Composite, EuroStoxx 50, Italian Milano Borsa, German DAX, Paris CAC40
Moses does not outperform the market on:
Nifty 50, BSE Sensex, ASX 200, Chinese Market
Backtested Performance
Test Timeframe Jan 13 1997 - Sept 21 2021
Duration Years 24.75
Initial Investment $10,000
North America Strategy-------------------------------$ Return------------CAGR-------Total %
Nasdaq 100 Buy & Hold----------------------------$176,380-----------12.30%------1664%
Buy Bull - Sell Bear------------------$288,554-----------14.55%------2786%
Buy Bull - Sell Catastrophe---------$202,491-----------12.92%------1925%
Buy Recovery - Sell Catastrophe---$229,866-----------13.50%------2199%
North America Strategy-------------------------------$ Return-----------CAGR------Total %
S&P 500 Buy & Hold----------------------------$58,122-----------7.37%------481%
Buy Bull - Sell Bear------------------$48,544-----------6.59%------385%
Buy Bull - Sell Catastrophe $59,573-----------7.48%------496%
Buy Recovery - Sell Catastrophe $64,579-----------7.83%------546%
North America Strategy-------------------------------$ Return-----------CAGR------Total %
Russell 3000 Buy & Hold----------------------------$61,363-----------7.61%------514%
Buy Bull - Sell Bear------------------$52,957-----------6.97%------430%
Buy Bull - Sell Catastrophe---------$64,027-----------7.79%------540%
Buy Recovery - Sell Catastrophe---$71,565-----------8.28%------616%
North America Strategy-------------------------------$ Return-----------CAGR------Total %
Nasdaq Composite Buy & Hold----------------------------$112,839-----------10.29%------1028%
Buy Bull - Sell Bear------------------$123,308-----------10.68%------1133%
Buy Bull - Sell Catastrophe---------$107,699-----------10.08%------977%
Buy Recovery - Sell Catastrophe---$112,453-----------10.27%------1025%
*CAGR - Compound Annual Growth Rate
From a Declaration of Principles jointly adopted by a Committee of the American Bar Association and a Committee of Publishers
This work is provided to you for informational purposes only and should not be construed as an offer to buy or sell a particular security or a solicitation of offers to buy or sell a particular security. The author may make available certain information related to the potential price movement of particular securities. By reading this report or using the training materials, you acknowledge and agree that any reliance upon the content or data available is at your own sole risk. You are strongly advised to use your own judgment, your own research, and question everything. The information is generic in nature and not targeted to individuals or individual circumstances. The author is an independent investor and is not licensed to give formal Stock advice to the individual, run funds of any type, or accept fees for individual stock advice. The Author accepts no responsibility for loss of money for following any of the lessons or systems created. Trading of securities may not be suitable for all users of this information; if in doubt, seek a professional advisor. All use of this work is at your sole risk.

ETF / Stocks / Crypto - DCA Strategy v1Simple "benchmark" strategy for ETFs, Stocks and Crypto! Super-easy to implement for beginners, a DCA (dollar-cost-averaging) strategy means that you buy a fixed amount of an ETF / Stock / Crypto every several months. For instance, to DCA the S&P 500 (SPY), you could purchase $10,000 USD every 12 months, irrespective of the market price. Assuming the macro-economic conditions of the underlying country remain favourable, DCA strategies will result in capital gains over a period of many years, e.g. 10 years. DCA is the safest strategy that beginners can employ to make money in the markets, and all other types of strategies should be "benchmarked" against DCA; if your strategy cannot outperform DCA, then your strategy is useless.
Recommended Chart Settings:
Asset Class: ETF / Stocks / Crypto
Time Frame: H1 (Hourly) / D1 (Daily) / W1 (Weekly) / M1 (Monthly)
Necessary ETF Macro Conditions:
1. Country must have healthy demographics, good ratio of young > old
2. Country population must be increasing
3. Country must be experiencing price-inflation
Necessary Stock Conditions:
1. Growing revenue
2. Growing net income
3. Consistent net margins
4. Higher gross/net profit margin compared to its peers in the industry
5. Growing share holders equity
6. Current ratios > 1
7. Debt to equity ratio (compare to peers)
8. Debt servicing ratio < 30%
9. Wide economic moat
10. Products and services used daily, and will stay relevant for at least 1 decade
Necessary Crypto Conditions:
1. Honest founders
2. Competent technical co-founders
3. Fair or non-existent pre-mine
4. Solid marketing and PR
5. Legitimate use-cases / adoption
Default Robot Settings:
Contribution (USD): $10,000
Frequency (Months): 12
*Robot buys $10,000 worth of ETF, Stock, Crypto, regardless of the market price, every 12 months since its founding time.*
*Equity curve can be seen from the bottom panel*
Risk Warning:
This strategy is low-risk, however it assumes you have a long time horizon of at least 5 to 10 years. The longer your holding-period, the better your returns. The only thing the user has to keep-in-mind are the macro-economic conditions as stated above. If unsure, please stick to ETFs rather than buying individual stocks or cryptocurrencies.

The Lazy Trader - Index (ETF) Trend Following Robot50/150 moving average, index (ETF) trend following robot. Coded for people who cannot psychologically handle dollar-cost-averaging through bear markets and extreme drawdowns (although DCA can produce better results eventually), this robot helps you to avoid bear markets. Be a fair-weathered friend of Mr Market, and only take up his offer when the sun is shining! Designed for the lazy trader who really doesn't care...
Recommended Chart Settings:
Asset Class: ETF
Time Frame: Daily
Necessary ETF Macro Conditions:
a) Country must have healthy demographics, good ratio of young > old
b) Country population must be increasing
c) Country must be experiencing price-inflation
Default Robot Settings:
Slow Moving Average: 50 (integer) //adjust to suit your underlying index
Fast Moving Average: 150 (integer) //adjust to suit your underlying index
Bullish Slope Angle: 5 (degrees) //up angle of moving averages
Bearish Slope Angle: -5 (degrees) //down angle of moving averages
Average True Range: 14 (integer) //input for slope-angle formula
Risk: 100 (%) //100% risk means using all equity per trade
ETF Test Results (Default Settings):
SPY (1993 to 2020, 27 years), 332% profit, 20 trades, 6.4 profit factor, 7% drawdown
EWG (1996 to 2020, 24 years), 310% profit, 18 trades, 3.7 profit factor, 10% drawdown
EWH (1996 to 2020, 24 years), 4% loss, 26 trades, 0.9 profit factor, 36% drawdown
QQQ (1999 to 2020, 21 years), 232% profit, 17 trades, 3.6 profit factor, 2% drawdown
EEM (2003 to 2020, 17 years), 73% profit, 17 trades, 1.1 profit factor, 3% drawdown
GXC (2007 to 2020, 13 years), 18% profit, 14 trades, 1.3 profit factor, 26% drawdown
BKF (2009 to 2020, 11 years), 11% profit, 13 trades, 1.2 profit factor, 33% drawdown
A longer time in the markets is better, with the exception of EWH. 6 out of 7 tested ETFs were profitable, feel free to test on your favourite ETF (default settings) and comment below.
Risk Warning:
Not tested on commodities nor other financial products like currencies (code will not work), feel free to leave comments below.
Moving Average Slope Angle Formula:
Reproduced and modified from source:

Reflex - A new Ehlers indicatorSource: Stocks and Commodities V38
Hooray! A new John Ehlers indicator!
John claims this indicator is lag-less and uses the SPY on the Daily as an example.
He states that drawing a line from peak to peak (or trough to trough) will correspond perfectly with the Asset.
I have to say I agree! There is typically one bar of lag or no lag at all!
I believe this indicator can be used for either entries or exits, but not both.
Entry
1. Entering Long positions at the pivot low points (Stocks and ETFs)
2. Entering Long when the Reflex crosses above the zero lines (Stocks, ETFs, Commodities)
Exit
1. Exiting Long positions at a new pivot high point (Stocks and ETFs)
2. Exiting Long when the Reflex crosses below the zero lines (Stocks, ETFs, Commodities)
In this example, I place a Long order on the SPY every time the Reflex crosses above the zero level and exit when it crosses below or pops my stop loss, set at 1.5 * Daily ATR.
4/6 Wins
+10.76%
For me, that's good enough to create a strategy and backtest on several Indices and ETFs, which is what I have a hunch this will work on.
I think there is a lot of promise from a single Indicator!
Let me know in the comment section if you're able to use this in a strategy.

Systematic Momentum strategy v 1.0Systematic Momentum strategy v 1.0
This is a long-only strategy optimized taking into consideration the underlying's momentum and volatily.
Long story short it opens positions when the momentum is highest and the risk is lowest and closes the same position when the risk-to-reward is no longer optimal.
How to use:
-> To be used on an Index or a tracker ETF
-> Position sizing should be set up to 100% of the portfolio

InfoPanel - SeasonalityThis panel will show which is the best month to buy a stock, index or ETF or even a cryptocurrency in the past 5 years.
Script to use only with MONTHLY timeframe.
Thanks to: RicardoSantos for his hard work.
Please use comment section for any feedback.

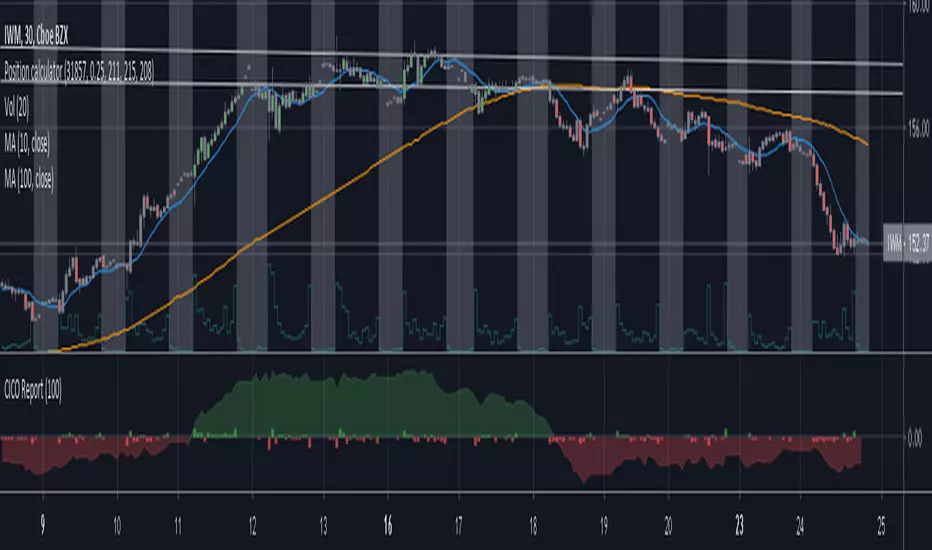
Cash in/Cash out Report (CICO) - Quiets market noiseThe cash in/cash out report (CICO for short) was built with the intent to quiet the market noise. The blunt way to say it, this indicator quiets the market manipulators voice and helps the retail investor make more money. I believe money is better of in the 99% hands versus the greedy hoarding that is currently going on. There are dozens of companies in the SP500 that have the same tax rate as unborn babies, nada. These hoarders also have machine learning high frequency trading bots that purposely create fear and anxiety in the markets. When all of the major markets move at the exact same time of day on frequent occasions, I see red flags. I recommend looking into Authorized participants in the ETF market to understand how the markets can be manipulated, specifically Creation and Redemption.
Enough of my rant. This indicator is open source. Directions on how to use the indicator can be found within the code. The basic summary is, clear your charts to bare minimums. Make the colors gray on all candles. Then apply this indicator. The indicator will color the "buy" and "sell" signals on the chart. Keep in mind, markets are manipulated to create fear in the retail investors little heart and can change drastically at any second. This indicator will show real time changes in running sum into and out of the market, it is estimated by average prices and not exact.
Once the chart is all greyed out and the indicator is applied you will see an area colored red and green. What this indicator does is takes a running sum of the new money into and out of the market. It takes the average of the high and low price times the volume. If the price is going up the value is positive, going down will be negative. Then the running sum is displayed. The area section is the running sum and the column bars are each value. When a market is steadily increasing in value you will see the large green area grow. When markets shift, values and display will change in color and vector. Full descriptions are available within the script in the comment sections.
I hope this help you make more money. If this helps you grow profits, give it a like!
Happy investing 99%er!
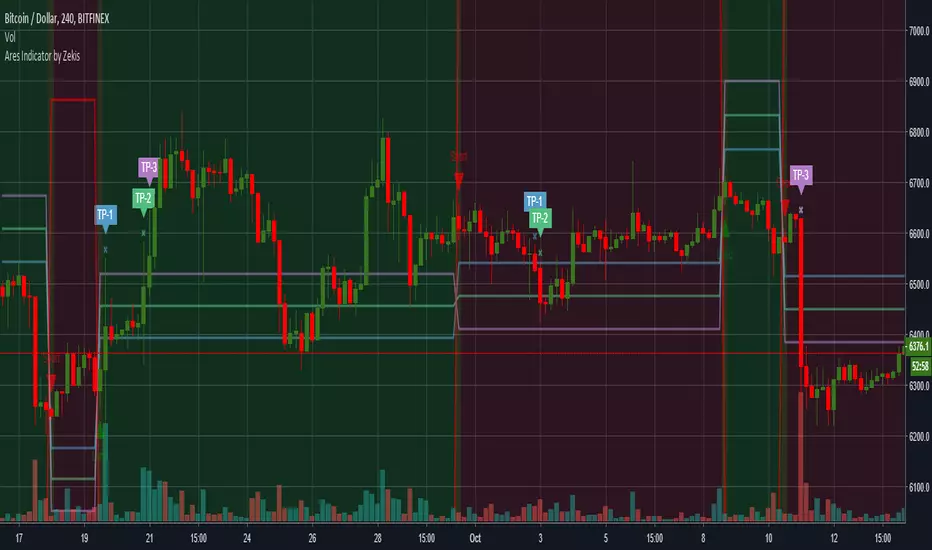
Ares Indicator by ZekisAres Indicator
System Algorithm based on historical price probabilities, with moving averages modified for optimal results.
Buy/Long when background turns green.
Sell/Short when background turns red.
There are 3 Take Profits and a Stop Loss, marked with lines for a better view and with symbols when it get there.
You can set them as you want to meet your requirements.
Alerts are added.
Enjoy!
@ Zekis
Marker bullish trending momentum swing trade strategyLooking for bullish trending upward momentum, then selling at the top. Stop losses and max drawdown configurable based risk profile and stock/ETF. Please follow me if you like this signal strategy.