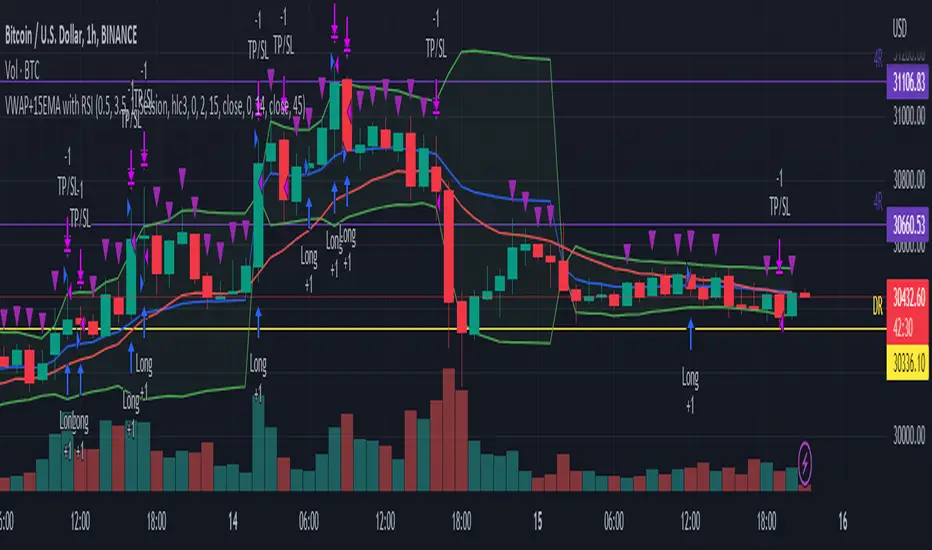
TriautoETF(TQQQ) Short Strategy B1○ Objective.
This is a strategy for the TQQQ NASDAQ:TQQQ short strategy in the TriAuto ETF .
It is used as a hedging short rather than for profit-making purposes.
Entry and close points are indicated.
○ Strategy
The strategy is to hold a short position when the price falls below the moving average line, which is a market-conscious line that is rarely broken.
The close (settlement) is determined by using the moving average.
The moving average is based on the market-conscious QQQ NASDAQ:QQQ .
This script is used on the daily chart of the TQQQ.
It works as a hedge for long positions because open interest is held even at the major bottoms of the China and Corona shocks.
The system is set up to quickly cut its losses even if the moving average is "tricked" into falling below the moving average.
Média Móvel Exponencial (MME)
Scalping The Bull - Two EMA StrategyName: Scalping The Bull - Two EMA "Gianno-Nano" Strategy from the Meeting
Category: Trend Follower
Operating mode: Spot or Future, only long or swing trading
Trades duration: Multiday
Timeframe: 4H
Suggested usage: Mid-term trading, when the market is in trend and it is showing high volatility.
Entry: When fast EMA crosses over slow EMA.
Exit: When fast EMA crosses under slow EMA then Exit Long or Entry Short (for reversal strategy).
Usage:
⁃ It can be useful to use alerts or web-hooks to automate this strategy.
⁃ This is a raw system that can be improved in different ways (e.g. Stop-loss, take-profit, position sizing) or studying more the behaviour of the coin.
Configuration:
- N/A
Backtesting
⁃ Exchange: BINANCE
⁃ Pair: NEOUSDT
⁃ Timeframe: 4H
⁃ Fee 0.075%
⁃ Slippage 0
- Start : 2017-12-03
How you or we can improve? Source code is open so share your ideas!
Stochastic Moving AverageHi all,
This Strategy script combines the power of EMAs along with the Stochastic Oscillator in a trend following / continuation manner, along with some cool functionalities.
I designed this script especially for trading altcoins, but it works just as good on Bitcoin itself and on some Forex pairs.
______ SIGNALS ______
The script has 4 mandatory conditions to unlock a trading signal. Find these conditions for a long trade below (works the exact other way round for shorts)
- Fast EMA must be higher than Slow EMA
- Stochastic K% line must be in oversold territory
- Stochastic K% line must cross over Stochastic D% line
- Price as to close between slow EMA and fast EMA
Once all the conditions are true, a trade will start at the opening of the next
______ SETTINGS ______
- Trade Setup:
Here you can choose to trade only longs or shorts and change your Risk:Reward.
You can also decide to adjust your volume per position according to your risk tolerance. With “% of Equity” your stop loss will always be equal to a fixed percentage of your initial capital (will “compound” overtime) and with “$ Amount” your stop loss will always be 'x' amount of the base currency (ex: USD, will not compound)
Stop Loss:
The ATR is used to create a stop loss that matches current volatility. The multiplier corresponds to how many times the ATR stop losses and take profits will be away from closing price.
- Stochastic:
Here you can find the usual K% & D% length and overbought (OB) and oversold (OS) levels.
The “Stochastic OB/OS lookback” increase the tolerance towards OB/OS territories. It allows to look 'x' bars back for a value of the Stochastic K line to be overbought or oversold when detecting an entry signal.
The “All must be OB/OS” refers to the previous “Stochastic OB/OS lookback” parameter. If this option is ticked, instead of needing only 1 OB/OS value within the lookback period to get a valid signal, now, all bars looked back must be OB/OS.
The color gradient drawn between the fast and slow EMAs is a representation of the Stochastic K% line position. With default setting colors, when fast EMA > slow EMA, gradient will become solid blue when Stochastic is oversold and when slow EMA > fast EMA, gradient will become solid blue when Stochastic is overbought
- EMAs:
Just pick your favorite ones
- Reference Market:
An additional filter to be certain to stay aligned with the current a market index trend (in our case: Bitcoin). If selected reference market (and timeframe) is trading above selected EMA, this strategy will only take long trades (vice-versa for shorts) Because, let’s face it… even if this filter isn’t bulletproof, you know for sure that when Bitcoin tanks, there won’t be many Alts going north simultaneously. Once again, this is a trend following strategy.
A few tips for increased performance: fast EMA and D% Line can be real fast… 😉
As always, my scripts evolve greatly with your ideas and suggestions, keep them coming! I will gladly incorporate more functionalities as I go.
All my script are tradable when published but remain work in progress, looking for further improvements.
Hope you like it!
Fukuiz Octa-EMA + Ichimoku (Strategy)This strategy is based EMA of 8 different period and Ichimoku Cloud which works better in 1hr 4hr and daily time frame.
#A brief introduction to Ichimoku #
The Ichimoku Cloud is a collection of technical indicators that show support and resistance levels, as well as momentum and trend direction. It does this by taking multiple averages and plotting them on a chart. It also uses these figures to compute a “cloud” that attempts to forecast where the price may find support or resistance in the future.
#A brief introduction to EMA#
An exponential moving average ( EMA ) is a type of moving average (MA) that places a greater weight and significance on the most recent data points. The exponential moving average is also referred to as the exponentially weighted moving average . An exponentially weighted moving average reacts more significantly to recent price changes than a simple moving average ( SMA ), which applies an equal weight to all observations in the period.
#How to use#
The strategy will give entry points itself, you can monitor and take profit manually(recommended), or you can use the exit setup.
EMA (Color) = Bullish trend
EMA (Gray) = Bearish trend
#Condition#
Buy = All Ema (color) above the cloud.
SELL= All Ema turn to gray color.
CCI + EMA with RSI Cross StrategyThis strategy uses the CCI + 2 RSIs + 2 EMAs to generate trade signals. Trades are only taken during the normal trading session and all open trades are closed 15 min before the close of the current session. A trailing stop loss is used and is customizable.
Not trading advice, use at your own risk.
SEMA-XSEMA-X (sema cross)
It's a simple EMA cross strategy
Rules of strategy
1. 2 EMA crossing
2. Long (Golden Cross), Short (Dead Cross)
3. Target profit, stop loss setting
You can also get big trend gains if you set a long target price.
* * *
SEMA-X (세마크로스)
간단한 EMA 교차 전략 입니다.
전략의 규칙
1. 2개의 EMA 교차
2. 매수(골든 크로스), 매도(데드 크로스)
3. 목표가, 손절가 설정
목표가를 길게 설정하면 큰 추세 이익도 얻을 수 있습니다.
Hulk Strategy x35 Leverage 5m chart w/Alerts This strategy is a pullback strategy that utilizes 2 EMAs as a way of identifying trend, MACD as an entry signal, and RSI and ADX to filter bad trades. By using the confirmation of all of these indicators the strategy attempts to catch pullbacks, and it is optimized to wait for high probability setups. Take not that the strategy is optimized for use on BTCUSDT along with 35 times leverage(Using leverage is risky). The Hulk Strategy waits for strong trend confirmation and then attempts to identify pullbacks using MACD and RSI. By using these it identifies strong short term movement against the trend(hence the name Hulk). To use the strategy wait for the strategy to make an entry, and then enter with a stop loss of 1.1% and a take profit of 1.35% with respect to if it is a long or short position. The trade frequency of this strategy is high as it is made for use on the 5m timeframe. But this does not mean you will have to be staring at your computer constantly as an average of 1 trade takes place each day. This will vary a lot though, somedays the strategy enters up to 4 times. I wish you good trading and hope that you like this strategy!
P.S. The indicators on my chart are visualizations of the indicators used in the strategy, they are not necessary for the strategy to work though. Also the colored in cloud on the price chart is an EMA cloud and it comes with the strategy when you add it to your chart. This EMA cloud consists of two EMAs a 50 and a 200 EMA.
Uptrend and Oversold Index Swing Trading System 8H--- Foreword ---
The Overbought and Oversold Index Swing Trading System or short: I11L Hypertrend primarily uses money management Strategies, EMA and SMA and my momentum Ideas for trying to produce satisfactory Alpha over a timespan of multiple years.
--- How does it Work? ---
It uses 20 different EMA's and SMA's to produce a score for each Bar.
It will credit one Point If the EMA is above the SMA.
A high score means that there is a strong Uptrend.
Spotting the strong Uptrend early is important.
The I11L Hypertrend System trys to spot the "UPTREND" by checking for a crossover of the Score(EMA) / Score(SMA).
A low score means that there is a strong Downtrend.
Its quite common to see a reversal to the mean after a Downtrend and spotting the bottom is important.
The System trys to spot the reversal, or "OVERSOLD" state by a crossunder of the Score(EMA) / Score(SMA).
--- What can i customize? ---
-> Trading Mode: You can choose between two different trading modes, Oversold and Overbought(trend) and Random Buys to check if your systems Profitfactor is actually better then market.
-> Work with the total equity: The system uses the initial capital per default for Backtesting purposes but seeing the maximum drawdown in a compounding mode might help!
-> Use a trailing SL: A TSL trys to not lose too much if the trade goes against your TP
-> Lookbackdistance for the Score: A higher Lookbackdistance results in a more lagging indicator. You have to find the balance between the confirmation of the Signal and the frontrunning.
-> Leverage: To see how your strategie and your maximum Drawdown with the total equity mode enabled would have performed.
-> Risk Capital per Trade unleveraged: How much the underlying asset can go against your position before the TSL hits, or the SL if no TSL is set.
-> TPFactor: Your risk/reward Ratio. If you risk 3% and you set the ratio to 1.2, you will have a TP at 3 * 1.2 = 3.6%
-> Select Date: Works best in the 8H Timeframe for CFD's. Good for getting a sense of what overfitting actually means and how easy one can fool themself, find the highest Profitfactor setting in the first Sector (Start - 2012) and then see if the second Sector (2012 - Now) produces Alpha over the Random Buy mode.
--- I have some questions about the System ---
Dear reader, please ask the question in the comment Section and i will do my best to assist you.
EMA Cloud Intraday Strategy********NOT TRADING ADVICE - USE AT YOUR OWN RISK - TRADING IS RISKY - DO NOT BLINDLY FOLLOW THE SIGNALS FROM THIS STRATEGY********
This strategy utilizes the 9 and 20 period exponential moving averages to create a colored cloud between similar to what is seen on the Ichimoku Cloud. The strategy closes all trades by the end of the trading day. Entry is when the price closes above a Green (9 EMA above 20 EMA) cloud or below a Red (9 EMA below 20 EMA) cloud. Exit is when price closes against the 9 EMA or at the end of the trading day. Running the strategy tester on different intraday time frames will show the best time frame for a given Symbol. For example, I have found that the best results are returned by this strategy for SPY on the 30 minute time frame.
********NOT TRADING ADVICE - USE AT YOUR OWN RISK - TRADING IS RISKY - DO NOT BLINDLY FOLLOW THE SIGNALS FROM THIS STRATEGY********
Perfect OrderEntry Point
How to Entry
Perfect Order Entry
SMA5,13,21 & EMA75,90,200
Please enjoy your entry
EMA StratIf previous day close above EMA, enter long at open the following day. Exit long position if prices close below EMA.
EDMA Scalping Strategy (Exponentially Deviating Moving Average)This strategy uses crossover of Exponentially Deviating Moving Average (MZ EDMA ) along with Exponential Moving Average for trades entry/exits. Exponentially Deviating Moving Average (MZ EDMA ) is derived from Exponential Moving Average to predict better exit in top reversal case.
EDMA Philosophy
EDMA is calculated in following steps:
In first step, Exponentially expanding moving line is calculated with same code as of EMA but with different smoothness (1 instead of 2).
In 2nd step, Exponentially contracting moving line is calculated using 1st calculated line as source input and also using same code as of EMA but with different smoothness (1 instead of 2).
In 3rd step, Hull Moving Average with 2/3 of EDMA length is calculated using final line as source input. This final HMA will be equal to Exponentially Deviating Moving Average.
EDMA Defaults
Currently default EDMA and EMA length is set to 20 period which I've found better for higher timeframes but this can be adjusted according to user's timeframe. I would soon add Multi Timeframe option in script too. Chikou filter's period is set to 25.
Additional Features
EMA Band: EMA band is shown on chart to better visualize EMA cross with EDMA .
Dynamic Coloring: Chikou Filter library is used for derivation of dynamic coloring of EDMA and its band.
Trade Confirmation with Chikou Filter: Trend filteration from Chikou filter library is used as an option to enhance trades signals accuracy.
Strategy Default Test Settings
For backtesting purpose, following settings are used:
Initial capital=10000 USD
Default quantity value = 5 % of total capital
Commission value = 0.1 %
Pyramiding isn't included.
Backtesting data never assures that the same results would occur in future and also above settings use very less of total portfolio for trades, which in a way results less maximum drawdown along with less total profit on initial capital too. For example, increasing default quantity value will definity increase maximum drawdown value. The other way is also to use fix contracts in backtesting but it all depends on users general practice. Best option is to explore backtesting results with manually modified settings on different charts, before trusting them for other uses in future.
Usage and In-Detail Backtesting
This strategy has built-in option to enable trade confirmations with Chikou filter which will reduce the total number of trades increasing profit factor.
Symmetrically Weighted Moving Average (SWMA) on input source, may risk repainting in real-time data. Better option is to run a trade on bar close or simply left this optin unchecked.
I've set Chikou filter unchecked to increase number of trades (greater than 100) on higher timeframe (12H) and this can be changed according to your precision requirement and timeframe.
Timeframes lower than 4H usually have more noise. So its better to use higher EDMA and EMA length on lower timeframes which will decrease total number of offsetting trades increasing average total number of bars within a single trade.
Original "Exponentially Deviating Moving Average (MZ EDMA )" Indicator can be found here.
Trend Follower Strategy v2 [divonn1994]The Trend Follower Strategy that I made classifies red and green candles into tiny, small, and big sizes and will send buy or sell signals depending on if the candle is classified as "big" so you get into and out of a position when there is a big candle. Out during a big green candle to take profit. Out during a big red candle in case the market is turning down. It also won't enter a position unless there is positive EMA momentum.
For the chart there is a Buy and a Sell signal. Buy = 1, Sell = 0, and when the value crosses above or below 0.5 it will trigger a long position or close the long position. The graph isn't necessary to the strategy, but can help with visualizing the trade patterns in the past if you like.
This strategy works best so far with these coins at time of posting (March 4th, 2022):
KCSUSDT (621x profit), HTUSDT (45x profit), LUNAUSDT (45x profit), BNBBTC (1553x profit), ETHBTC (219x profit), KCSBTC (1222x profit), LUNABTC (83x profit), FTMBTC (52x profit).
It can work with other pairings, but I personally like these pairings best. I didn't test it with coins outside of the top 100 coins by market cap. Use it however you want.
Works best on 1 Day charts.
The strategy would rather be in the market than out. It gets out when it see's a red flag, but can immediately go back in in the next bar if the red flags are all gone. So it makes a lot of trades.
------------------------------------------------------------------------------------------------------------------------------------------------------------------------------------------------------------------------
Update: This is the same strategy I uploaded before but I made the code Open for anyone to check it out and so it has a similar description as the previous version. Let me know what you think. I'd remove the old version if I could, but I guess it's site policy to not be able to remove scripts that have been uploaded.
STR:EMA Oscilator [Azzrael]Strategy based on EMA and EMA Oscilator
(EMA - close) + Std Dev + Factor = detecting oversell/overbuy
Long only!
Pyramiding - sometimes, depends on ...
There're 2 enter strategies in one script:
1 - Classic, buy on entering to OverSell zone (more profitable ~> 70%)
2 - Crazy, buy on entering to OverBuy zone (catching trend and pyramiding, more net profit)
Exit - crossing zero of (EMA - close)
sma RSI & sudden buy and sell Strategy v1This strategy uses mostly three things:-
1. average RSI (sma rsi over a period)
2. sudden buy and sudden sell (usually to infer the change in trend or direction)
3. various EMAs ( used as a filter)
I mostly build it to work on a 3min crypto chart but it should work on any timeframe or any symbol.
Settings - Length -RSI length (hardly needed to be changed but sometimes it doubles the net profit)(+/-2)
instant length - a sudden increase or decrease in the price calculated by the length of RSI (+/-10)
Bars - No of candles to verify before starting /closing the strategy (+/-20)
Lookbackno2 - another variable to verify ema opening/closing (hardly needed to change)
emas - values of different EMAs (you can change if you want but I don't recommend it though)
over40 and over60 - the value of overbuying and overselling(+/-10)
In future, I will probably add ADX or use machine learning to filter out results
It works well considering 0.05% commission per entry and exit (total of 1% per trade)
you can message me for any query or suggestions.
Mix1 : Ema Cross + Trend Channel [Gu5] - BacktestBacktest of the indicator "Mix1: Ema Cross + Trend Channel "
Trend indicator, by the crossing of moving averages
SMA200 with a channel as a filter confirms the trend.
The crossing of two moving averages, give alert only in trend.
Stochastic & MAThis trading system comes from the experience of having a "fast" signal for entry at low prices (such as the stoscastic) and then "following" the stock with a "slower" indicator such as the exponential moving average. Both the input and output signals are filtered.
The use of the trading system only carries out long operations and has been tested on shares and ETFs, including indices, on daily bases (End Of Day).
ENTRY CONDITION: when stochastic's k is higher than d (on the default value of 21 periods) we enter the lower part of the oversold, to which we apply a filter or the confirmation that the closing of the day of the crossing is higher than that of the n -th previous bar (the 2nd previous bar recommended).
Other default settings are k = 6 and d = 4; the oversold level is also customizable (recommended = 25).
EXIT CONDITIONS: once the entry has "gone well", we follow the upward trend of the stock not with a stochastic oscillator - which tends to exit too soon, especially in case of strong trends - but with a simple moving average exponential (by default at 38 periods). Also in this case a filter is added, that is, k must be> to a filter threshold (recommended = 65) which is used to distinguish the decline between a "physiological" tracking. "(k drops" slowly "together with the approach of prices to the moving average) from a more" violent "tracking (prices are below the moving average and k consequently fall" suddenly ", in a few bars).
MONEY MANAGEMENT: 13% stop loss inserted (the physiological level of tracking of the shares is generally max 8-12% so we also consider a 1% margin due to trading). For more volatile stocks, the level can be extended to 20%.
LEVERAGE: the default value is equal to 1, but it is advisable, for simulations on shares, to use higher levers (x2, x3, ...) if you trade the relative CFD or on the index in case of buying and selling of Leveraged ETFs (e.g. LEVMIB which is 2x leveraged ETFs on Italian index).
5min Williams Fractals scalping (3commas)Another strategy I'm learning Pine Script on. It is inspired by a MoneyZG youtube strategy called "Easy 5 Minute Scalping Strategy (Simple to Follow Scalping Trading Strategy)".
Again this is a one order per trade strategy compatible with the 3commas bot (works also with the free 3commas subscription). This strategy is based on the signals from Williams Fractals, taking the signals in reverse - red triangle indicates a bottom and hence we go long. The green triangle indicates a top so we go short. By default these signals are only accepted if they occur between the two Emas. However, you can also turn this off and when a WF signal comes in, only the current price has to be between the Emas. Stop loss is set to the current Ema slow and the take profit is a multiple of the distance to the slow ema.
Like previously I have added different filters as well as the ability to view essential things like the WF signal and Emas. I hope the script will help you to be more successful and if so it would be great if you could share here your setups, or tips on what would be good to refine to make it an even a more profitable strategy. Kind of a community approach so that we help each other out :).
Instructions for the 3commas connector:
1. First, you need to prepare 3commas Long/Short bots that will only listen to custom TV signals.
2. Inputs for the 3commas bot can be found at the end of the user inputs.
3. Once you have entered the required details into the inputs, turn on 3commas comments. They should appear on the chart (looks messy).
4. Now you can add the alert where you should paste the 3commas Webhook URL: 3commas.io
5. For the alert message text insert the placeholder {{strategy.order.comment}} and delete the rest.
6. Once the alert is saved, you can turn off those 3commas comments to have a clearer chart.
7. With a new alert, the bot and trade should launch.
In the near future I would like to publish more scripts that will carry similar elements as the first two, incl. compatibility with 3commas (I don't have access to another bot system). I will choose some strategies myself, but I will also be glad for some tips on what strategy would be good to do and is still missing here on Tradingview (short youtube videos or brief strategy manuals would be great).
Thanks and keep it up
PS: My screen values starting at Long Target Profit and ending at Pullback NOT greater than: 1.5; 1.5; 0; ON; 1; 2; OFF; 17; 36; ON; 0.05; ON; Chart; 14; 46; 50; 48.5; 51; OFF; 1; ON; 4; 2.
3 Indicator Strategy (StochRSI, MFI & EMA) With Safety OrdersThis strategy uses Stochastic RSI, Money Flow Index and EMA with settings for lower time-frames.
It also features safety orders based on 3 different take profit and stop loss methods.
Recommended Indicator Settings for lower time-frames;
Stoch RSI: 1,1,100,100
MFI: 30
EMA: 100
Take Profit/Stop Loss Settings:
There are 3 TP/SL types available;
- Pips -> based on minticks
- Base Value -> manually entering a value for the actual profit/loss.
- Opposite Signal -> e.g. if the current open order is long, strategy waits for the next short signal.
Swing Trades Validator - The One TraderThis swing trading strategy validator is built on the original strategy taught in my bootcamp for swing traders.
The strategy is simple and follows a trend trading pattern on prices reacting to Exponential Moving Averages over a multiple time-frame analysis.
The details of the strategy are as follows:
- Holding Period : Upto a couple of months
- Time-frames to be analysed : Month - Week - Day
- Trade Execution : Daily Time-frame
Analysis Details:
Step 1 : On the Monthly time-frame, the candle needs to be bullish with the latest close being higher than the opening price of the month.
Step 2 : The price needs to be above the 8ema on the Monthly time-frame.
Step 3 : The 8ema must be above the 20ema on the Monthly time-frame.
The above steps indicate a bullish strength in the instrument on the Monthly time-frame.
Step 4 : On the Weekly time-frame, the candle needs to be bullish with the latest close being higher than the opening price of the week.
Step 5 : The price needs to be above the 8ema on the Weekly time-frame.
Step 6 : The 8ema must be above the 20ema on the Weekly time-frame.
The above steps indicate a bullish strength in the instrument on the Weekly time-frame.
Step 7 : On the Daily time-frame, the candle needs to be bullish with the latest close being higher than the opening price of the day.
Step 8 : The price needs to be above the 8ema on the Daily time-frame.
Step 9 : The 8ema must be above the 20ema on the Daily time-frame.
The above steps indicate a bullish strength in the instrument on the Daily time-frame.
Step 10 : While the 8ema is above the 20ema on the Daily time-frame, the price must be allowed to rise before a pullback is seen towards the moving averages, indicating a bearish move trying to change the trend.
Step 11 : These pullback candles need to form a pattern called the Ring Low with the second pullback candle having a lower high and lower low and the low of the last pullback candle being lesser than or equal to the fat ema on the Daily time-frame.
Step 12 : If the stock is still bullish and the trend is displaying a strength in the underlying bullish direction, then there will be a resumption candle that will have a closing price higher than the previous day's high price.
This trend continuation signal is a confirmation that the instrument will continue in the underlying trend direction and we will be able to enter if this condition is satisfied.
The profit and loss percentages are set at a default 10% as this can be a minimum risk : reward for swing trades on average, but the inputs have been made available to the users in order to adjust the risk : reward to find the most optimum breathing room for each individual stock or instrument. This will give the user a highly custom overview of the strategy on individual instruments based on their volatility and price movements.
The strategy tester will auto back-test this strategy historically and find all the trades that were taken based on this strategy and populate a performance summary.
The most important data in V1.0 of this script are as follows:
1. No. of Trades Taken : We want to see many trades being taken on this strategy in that particular instrument. This shows us a healthy report on the number of winning vs. losing trades.
2. Percentage Profitable : We want to see that this strategy has worked out in the past and is giving us a high probability of return. This in no way an indication that the strategy will definitely work out in the future as well, but gives us an idea of whether or not we should enter this trade.
3. No. of Winning Trades vs. Losing Trades : We would like to see a significantly higher number of winning trades.
4. Avg. # of bars in a trade : This gives us an idea of how long on average we might have to wait to see the results of this strategy either in favor of our reward or against our desired direction. Some trades can be completed in around 15-20 bars on average and some trades have shown to take upto 45 days to reach desired reward. This is in line with our planned holding period, but gives the trader a sense of time and increased level of patience.
The future updates will have more utility of the various elements of the strategy tester and the entire exit strategy will be integrated into the script.
This script is not to be used as a standalone method and must be studied well in order to execute trades. I have not hidden visibility on other time-frames, but since order execution is done on the Daily time-frame, the script must run on the Daily time-frame only.
There are many other factors to be taken into consideration before entering a trade and proper risk management and position sizing rules must be followed.
Our bootcamp participants will use this strategy tester in conjunction with the invite-only Trading Toolkit assigned to them.
The development of this script will be ongoing and all comments and feedback are welcome.
EMA Cross + Divergence strategy (Div. signals by The Divergent)A sample strategy demonstrating the usage of The Divergent divergence indicator and The Divergent Library .
The Divergent is an advanced divergence indicator which you can easily incorporate into your own strategies.
In order to use this strategy (and to use the signals in your own strategy), you need to have the Pro version of The Divergent applied to your chart.
For more information, please see the comments inlined in the code.
Dollar cost averaging This is a testing startergy based on dollar cost averaging and sell on high points.
moonshot hypertrender (supertrend strategy)
This is a well-known strategy by using 3 different Supertrends and a trend-defining EMA,
feel free to play around with the settings, a backtest on 8h ETHUSDT pair brought some good results using
the 233EMA and investing 75% of a 10k start capital.
The idea is to have at least 2 Supertrends going green above the trend-EMA to go into a long position. The exit
will be triggered if 2 Supertrends change to red (idea: 1 super trend in red could initialize a take profit).
Taking shorts works vice versa.
The EMA shows in green for uptrends and in red for downtrends, if it is blue (ranging market) no Signal will be taken because
the 3 Supertrends are not all above or below the trendline(EMA).
I heard about this strategy on youtube but I can't get the promised 60% win-rate ;)
any suggestions to improve it are welcome
Hope you find it useful and it would be nice to get your feedback
-theasgard-