Média Móvel Exponencial (MME)

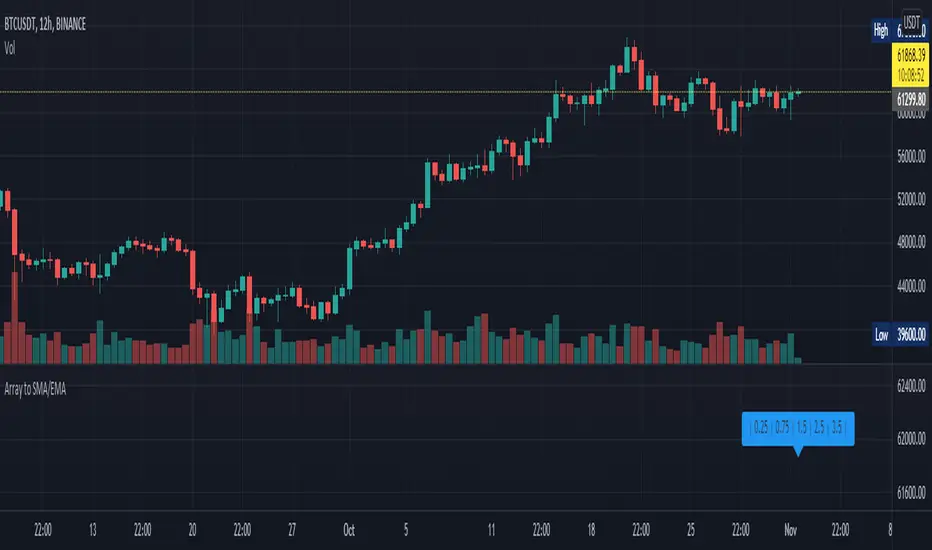
Array to SMA/EMAThis script is to help people with converting arrays to Simple Moving Average and Exponential Moving Average arrays. It is the same as using ta.sma() or ta.ema() in v5 with series but it takes an array as input instead. Both functions have inbuilt bad-input checking logic to ensure that the period length is not too high or too low - which could give unwanted results. If such values are used, the functions will output an array of the same length with NaN values. The EMA function also has an optional argument called sma_seed , which determines whether the first value in the output array will be the SMA of the first value from the input array (true) or the first value itself (false). Both functions work independently of one another, all you have to do is copy the entire function into your code and off you go! I can add more functions such as RMA or VWMA if there is demand, let me know and leave a like! ~ if you want.
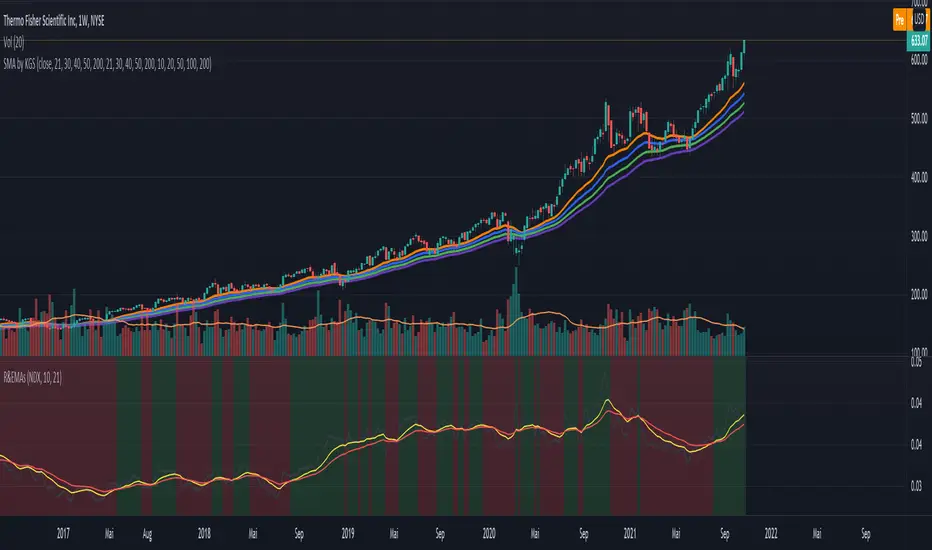
Ratio (Relative Strength) & EMAsRatio (Relative Strength) & EMAs
This indicator is used to compare the actual symbol with another one by calculating the ratio. EMA1 and EMA2 of the ration are shown as well. The idea is to choose an index like the NDX or SPX for comparison and to determine if the actual symbol outperforms the index or not - separate the wheat from the chaff. The rules are as follow:
When the calculation ratio (symbol divided ratio symbol) is above EMA1 and EMA1 is above EMA2) the background turs green. If not the background turn red.
Triple EMA (20, 50, 200) w/ LabelsI've combined the 20, 50, and 200 day exponential moving averages and added labels.
I created this due to finding EMA scripts that are either nothing but ugly to look at or have extra "features" that serve no purpose.
This gets rid of the clutter and gives a simple triple EMA with labels.
Labels are optional, you can turn them off in the settings.

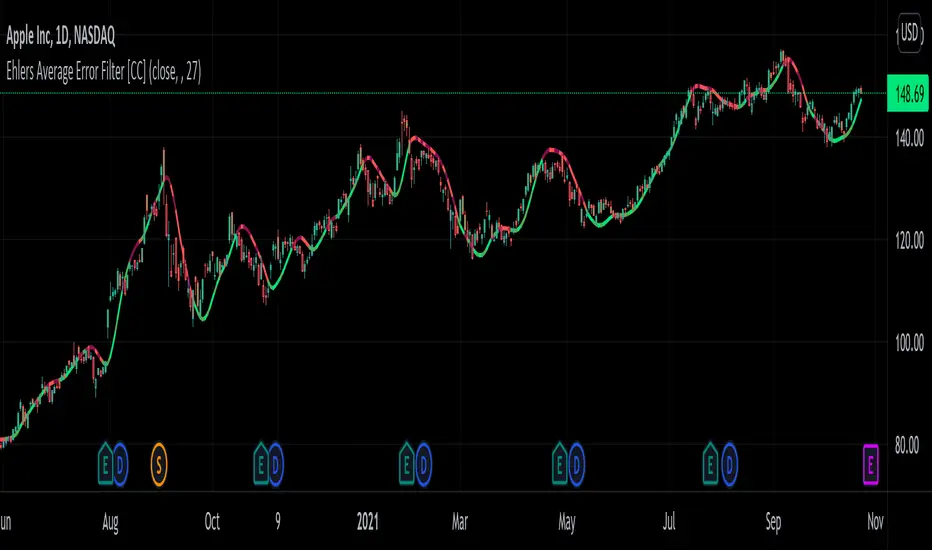
Ehlers Average Error Filter [CC]The Average Error Filter was created by John Ehlers and this is a variation of a Zero Lag Exponential Moving Average that uses a Super Smoother to filter out the noise and then uses a second Super Smoother of the difference between the current price and the filtered data. This works well as a trendline and does give out a few false signals like all indicators inevitably do but most signals do a good job of keeping up with the trend and providing clear entries and exits when the trend changes. I have included strong buy and sell signals in addition to normal ones so like always darker colors are strong signals and lighter colors are normal ones. Buy when the line turns green and sell when it turns red.
Let me know if there are any other scripts you would like to see me publish!
Scalping EMA ADX RSI with Buy/Sell AlertsThis is a study indicator that shows the entries in the strategy seen in one of the youtube channel so it does not belong to me. I can't tell who it is because it's against the House Rules to advertise but you can find out if you look for it on youtube. Default values of oscilators and ema adjusted as suggested. He says he got the best results in 5 min timeframe but i tried to make things as modifiable as possible so you can mess around with the settings and create your own strategy for different timeframes if you'd like. Suggested to use with normal candlestick charts. The blue line below indicates the ADX is above the selected threshold set in the settings named "Trend Ready Limit". You can set alerts for Buy, Sell or Buy/Sell signal together.
The entry strategy itself is pretty straight forward.
The rules for entry are as follows, the script will check all of this on auto and will give you buy or sell signal :
Recommended time frame: 5 min
For Long Entry:
- Check if price above the set EMA (Can disable this rule if you'd like in the settings)
- RSI is in Oversold
- ADX is above set "Trend Ready" threshold (Meaning there is a trend going on)
- Price must approve the trend of previous candles. This is bullish for buy entries and bearish for sell entries.
- Enter with stop loss below last swing low with 1:1 or 1.5:1 take profit ratio.
For Short Entry:
- Check if price below the set EMA (Can disable this rule if you'd like in the settings)
- RSI is in Overbought
- ADX is above set "Trend Ready" threshold (Meaning there is a trend going on)
- Price must approve the trend of previous candles. This is bullish for buy entries and bearish for sell entries.
- Enter with stop loss above last swing high with 1:1 or 1.5:1 take profit ratio.
This is my first indicator. Let me know if you want any updates. I am not sure if i can add everything but i'll try nonetheless.
Changed: Signals will check up to 2 candles before if the RSI is below or above the set value to show signal. This is because sometimes the entry signal is right but the response might be a bit late.

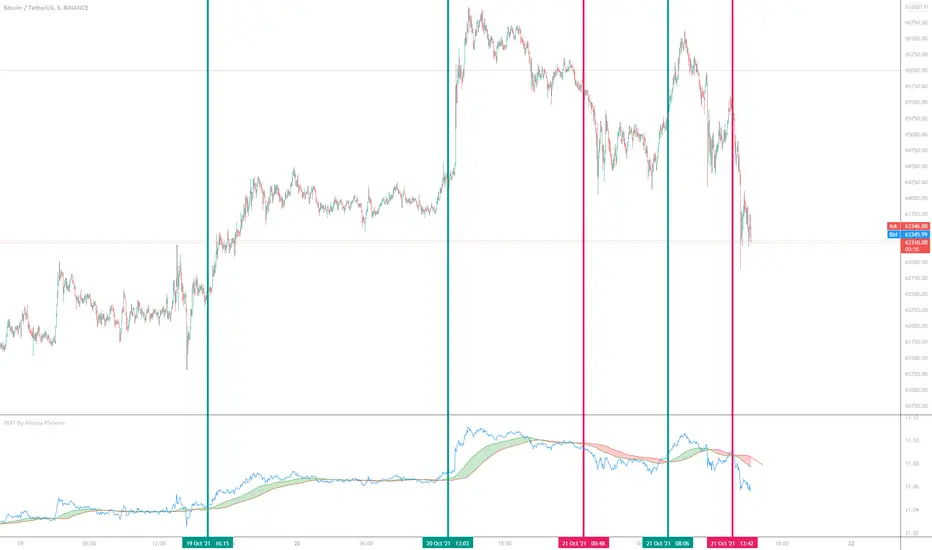
Price Movement Trend By Alireza Phoenix (Logarithmic)hi Traders
This logarithmic indicator shows the price movement trend, which is designed based on logarithmic functions and moving averages.
The Price Movement Trend Display Composed By :
A leading line consisting of the natural logarithm of Running Moving Average with length 60 and Offset 20 , and is displayed in red line.
A signal line consisting of a natural logarithm of an exponential moving average of length 90 , and is displayed in green line.
A price line consisting of the natural logarithm of a simple moving average along 1 whose source is price close , and is displayed in blue line.
A hidden price line consisting of the natural logarithm of a simple moving average along 1 and its source being the highest and lowest average prices , and is displayed in maroon line.
Learning how to get a signal from the price Movement trend indicator:
Moving the signal line and breaking the leading line upwards to form a green cloud is a buy signal.
Moving the signal line and breaking the leading line downwards that forms a red cloud is a sell signal.
Moving the price line and breaking the trend cloud upward , is a buy signal
Moving the price line and breaking the trend cloud downwards , is a sell signal
My instagram id : @pnxf6
ترجمه فارسی :
سلام تریدرها
این اندیکاتور لگاریتمی ، نمایش دهنده روند حرکتی قیمت است ، که بر اساس توابع لگاریتمی و میانگین های متحرک قیمت طراحی شده است
این اندیکاتور تشکیل شده از :
یک خط پیشرو متشکل از لگاریتم طبیعی متحرک وزنی نمایی مورد استفاده درآر اس آی به طول 60 و انحراف 20 است
یک خط سیگنال متشکل از لگاریتم طبیعی میانگین متحرک نمایی با طول 90
یک خط قیمت که متشکل از لگاریتم طبیعی میانگین متحرک ساده در طول 1 که منبع آن بسته شدن قیمت است.
یک خط قیمت مخفی که متشکل از لگاریتم طبیعی میانگین متحرک ساده در طول 1 و منبع آن میانگین بالاترین و پایین ترین قیمت است
یک فضای ابری مابین خط پیشرو و خط سیگنال که که با "نمایش روند حرکت قیمت" مشخص شده و در رنگ های سبز و قرمز قابل مشاهده میباشد.
آموزش گرفتن سیگنال ازاندیکاتور نمایش روند قیمت :
حرکت خط سیگنال و شکستن خط پیشرو رو به بالا که تشکیل ابر سبز رنگ میدهد یک سیگنال خرید میباشد .
حرکت خط سیگنال و شکستن خط پیشرو رو به پایین که تشکیل ابر قرمز رنگ میدهد یک سیگنال فروش میباشد .
حرکت خط قیمت و شکستن ابر روند حرکت قیمت رو به بالا سیگنال خرید میباشد
حرکت خط قیمت و شکستن ابر روند حرکت قیمت رو به پایین سیگنال فروش میباشد.
Ehlers Error Correcting Exponential Moving Average [CC]The Error Correcting Exponential Moving Average was created by John Ehlers and Ric Way (Stocks & Commodities V. 28:11 (30-35)) and this is an excellent moving average that accurately identifies the trend and sticks with the price during trends or choppy periods pretty well. It looks back to find the best gain setting for each day that returns the smallest difference between the current price and the ema based on the gain setting and uses that day's info in it's total calculations and if there is a zero gain for the day then it is just a classic ema. I have included strong buy and sell signals in addition to normal ones so lighter colors are normal and darker colors are strong. Buy when the line turns green and sell when it turns red.
Let me know if there are any other indicators you would like to see me publish!

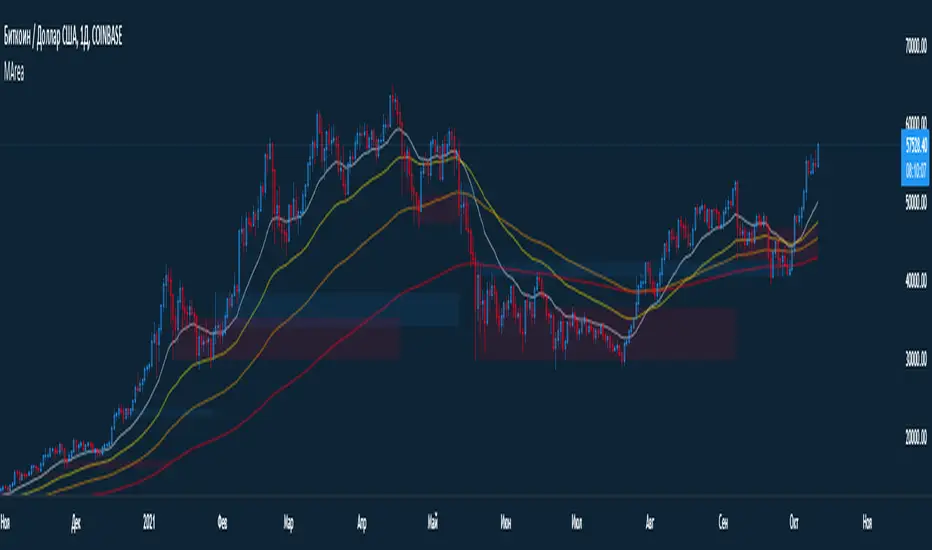
[DS]Bitcoin BTC ETH and others cryptos==DESCRIPTION - English version
The purpose of this script is to show information on graph that can help your decision to buy and sell cryptos.
The script is indicated for Position Trade (Long Term - Holder) and Swing Trade (Medium term).
Position Trade it is recommended to use the Weekly (W) and Daily (D) charts, Swing trade to use the 4H and 2H charts.
It is not advisable to use this indicator with graphic time frame less than 2 hours because the noise levels of information are very high.
An alert function has been inserted in the indicator and to activate this function you will need configure it in the Tradingview.
This alert will indicate the likely points of entry and exit of the asset.
**DESCRIÇÃO - Versão em Português
A proposta deste script é mostrar no gráfico informações que possam auxiliar a sua decisão de compra e venda de cryptos.
Este script é indicado para negociação Position Trade (Longo Prazo - Holders) e Swing Trade (Médio prazo).
Para Position Trade (Holders) é indicado utilizar os gráficos Semanal (W) e Diário (D), para Swing trade utilizar os gráficos 4H e 2H.
Não é aconselhável utilizar este indicador com tempos gráficos menores que 2hs pois os níveis de ruídos nas informação são muito altos.
Foi inserido no indicador uma função de alerta e para ativar esta função, você precisará configurá-la no seu Tradingview.
Este alerta irá indicar os provaveis pontos de entrada e saída do ativo.
====================================================================================================
** English Version
====================================================================================================
█ SETUP applied to Indicator
The setup is based on the average 8, 21 and 56 of the weekly chart (taught on youtube channel: Augusto Backes)
Price above the average 8 on the weekly, indicates that the market is UP trend, below the average 8 on the weekly that the market is DOWN trend
RSI greater than 60% the market is UP trend
RSI greater than 40% and lower 60% the market is in ACCUMULATION
RSI less than 40% the market DOWN trend
The weekly average 8 is represented in GREEN (Upward Trend) and RED (Downward Trend).
The weekly average 21 is represented in LIGHT ORANGE
The weekly average 56 is represented in LIGHT PURPLE
The crossing of weekly averages 8 and 21 is represented with a GREEN (HIGH trend) and RED (LOW trend) cross - this signal is disabled on the graph but you can enable it by clicking on the graph setup
█ FUNCTION USE
(1) Average 8, 21 and 56 on Weekly - show the average 8, 21, 56 weekly on graphic (Average 8 in color red and green, 21 - light orange, 56 light purple)
(2) Crossing of averages 8 and 21 Weekly - is not active but you can activate
(3) Calculation of RSI
(4) barcolor() - mark the candles with the green color (High market) and red color (Dow market)
(5) alertcondition() - you can active this alert on Tadingview
█ BUY AND SELL POINTS - likely points
The indication of the BUY position is shown by a green arrow pointing upwards and the sell position by a red arrow pointing downwards. Buy and sell indications are obtained from the divergence in the market trend.
█ THANK TO
PineCoders for everything they do, all the tools and help they provide, and their involvement in making a better community. All PineCoders, Pine Pros and Pine Wizards, people who share their work and knowledge because of it and helping others, I am so happy and so grateful.
█ NOTE
This indicator is not a buy and sell recommendation, it indicates the most likely buy and sell points. Every purchase and sale decision is your responsibility
*****************************************************************************************************
** Versão em Português
*****************************************************************************************************
█ SETUP aplicado no Indicador
O setup está baseado na média 8, 21, e 56 do gráfico semanal
Preço acima da média 8 no semanal indica que o mercado esta em tendência de ALTA, abaixo da média 8 no semanal que o mercado está em tendência de BAIXA
RSI maior que 60% o mercado está em ALTA
RSI maior que 40% e menor 60% o mercado está em ACUMULAÇÃO
RSI menor que 40% o mercado está em BAIXA
A média 8 semanal está representadas nas cores VERDE (Tendência de Alta) e VERMELHA (Tendência de Baixa).
A média 21 semanal está representada na cor laranja claro
A média 56 semanal está representada na cor roxa claro
O cruzamento das médias 8 e 21 semanal esta representado com uma cruz VERDE (Tendência de ALTA) e VERMELHA (Tendência de BAIXA) - este sinal esta desativado no gráfico mas você pode ativá-lo clicando no setup do gráfico
█ FUNÇÕES UTILIZADAS
(1) Média 8, 21 e 56 no Semanal - mostra a média 8, 21, e 56 no gráfico
(2) Cruzamento das médias 8 e 21 Semanal - não está ativo mas você pode ativá-lo
(3) Cálculo do RSI
(4) barcolor() - marca a vela (Candle) com a cor verde (Mercado em Alta) e a cor vermelha (Mercado em Baixa)
(5) alertcondition () - você pode ativar o alerta no Tradingview
█ PONTOS DE COMPRA E VENDA - prováveis pontos
A indicação da posição de COMPRA é apresentada por uma seta na cor verde apontada para cima e a posição de VENDA por uma seta na cor vermelha apontada para baixo. As indicações de compra e venda são obtidas a partir da divergência na tendência do mercado.
█ OBRIGADO PARA
PineCoders por tudo o que fazem, todas as ferramentas e ajuda que fornecem, e seu envolvimento em fazer uma comunidade melhor. Todos os PineCoders, Pine Pros e Pine Wizards, pessoas que compartilham seu trabalho e conhecimento por causa dele e ajudando os outros, estou muito feliz e muito grato.
█ NOTA
Este indicador não é uma recomendação de compra e venda ele indica os pontos mais prováveis de compra e venda. Toda decisão de compra e venda é de sua responsabilidade

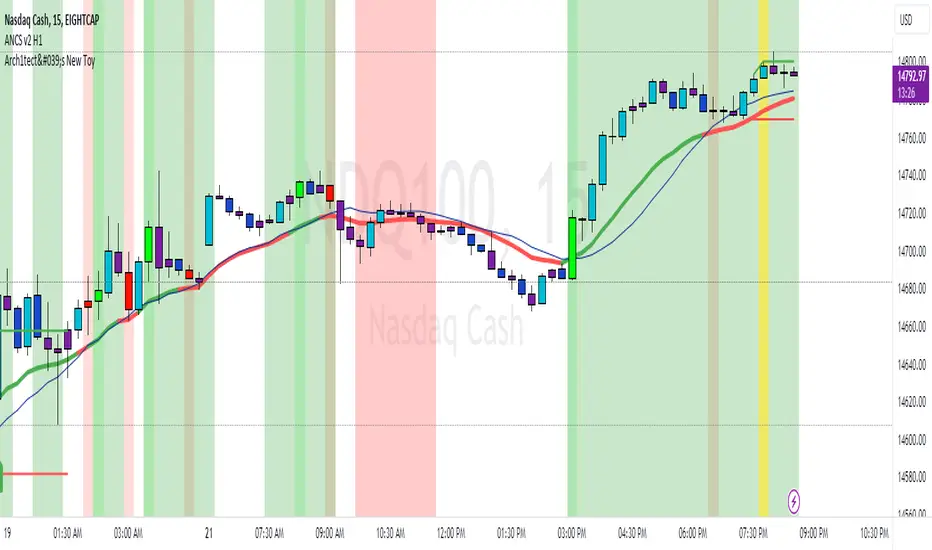
Arch1tect's New ToyDescription:
Arch1tect's New Toy tries to predict market trends by simply utilising 2 moving averages crossovers.
How it works:
Buy signals are triggered when the faster MA crosses over the slower MA from the downside to the upside.
Sell signals are triggered when the faster MA crosses under the slower MA from the upside to the downside.
How to use:
Take buys when buy signal is triggered AND close existing sell position
Take sells when sell signal is triggered AND close existing buy position
Note:
Settings are optimised for XAUUSD on the M1 chart.
Extra:
Alerts are included.
You can toggle between EMA , WMA and SMA to your liking.
Strategy Tester version:
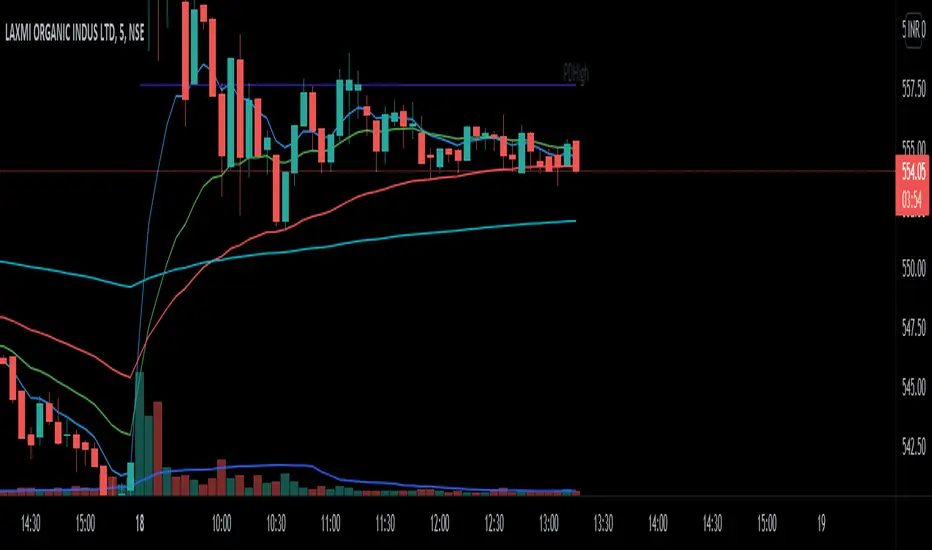
RVC_DecisionPoints By RishabhThe script is a combination of moving averages and previous day low and previous day high.
It can be used for intraday trading and as well as swing trades.
For using intraday I prefer 8 ema and 20 ema to take trades and trail stop losses with 50ema and 200 ema for confirmation.
For swing trades you can always use 50 ema as support to buy on the dip.
The entry is made on the basis of the stock breaks the previous day high or previous day low.
Indicator: SMA/EMA (Multi timeframes)This moving average indicator will plot the SMA or EMA sourced from a different timeframe on the current chart.
Applications:
Say you are viewing an hourly chart but you also want to know the ema20 sourced from a higher timeframe (i.e daily) of the same security. The problem with using most built-in indicators is that the MA values are usually calculated from the current chart, so to do that, you will have to toggle between 1h/1D. This script will eliminate this hassle by plotting out the desired alternative timeframe on the same chart.
Dynamic settings
By default the alternative timeframe is 1D, but this can be customized further:
- 1 week chart -> plots out 1 month MA
- 1 day chart -> plots out 1 week MA
- 1 hour chart -> plots out 1 day MA

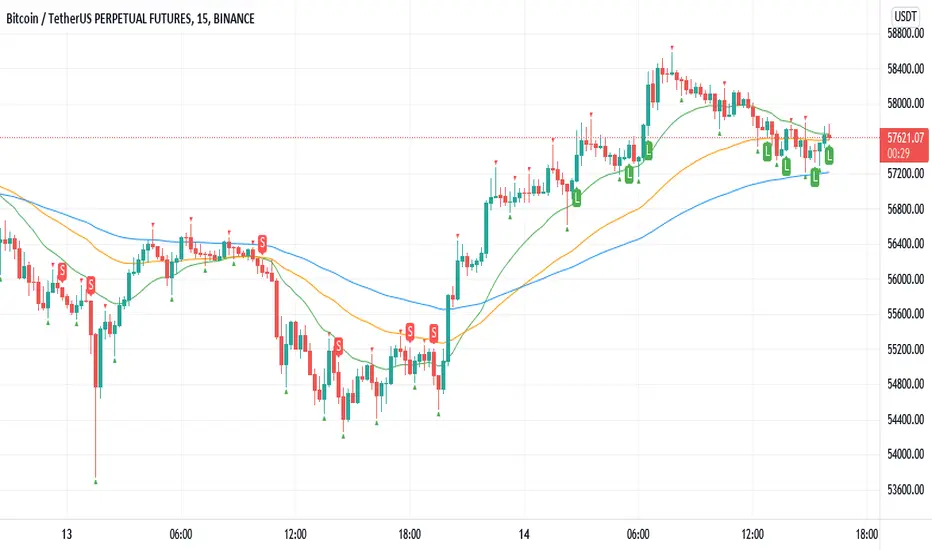
Williams Fractals BUY/SELL signals indicatorThis indicator made with using Williams Fractals, 20 50 100 Moving Averages and Relative Strength Index. You can easily find entry points by using Long (L), Short (S) signals.
This is a 15min scalping strategy for BTC:USDT Perpetual pair. For use different pairs or TFs you may need to change settings.
How to use
****************
When flashing Long (L) or Short (S) signal you should wait until the candle closing for the confirmation.
After that candle closed with the signal, you can enter a trade in next candle opening.
Your SL should be 3.1% from etnry and TP should be 0.5% from entry for best results. (You can use Long Position / Short Position tool in Prediction and Measurement Tools in drawing pannel to calculate this. This settings only for BTC:USDT Perp 15 min TF. For other TFs or Pairs settings may vary. You can easily change these settings and backtest your own.)
After entering a trade you can be ignored next signals until close the trade.
To learn more about this strategy, please try the "Williams Fractals Strategy" I coded. Thank you!
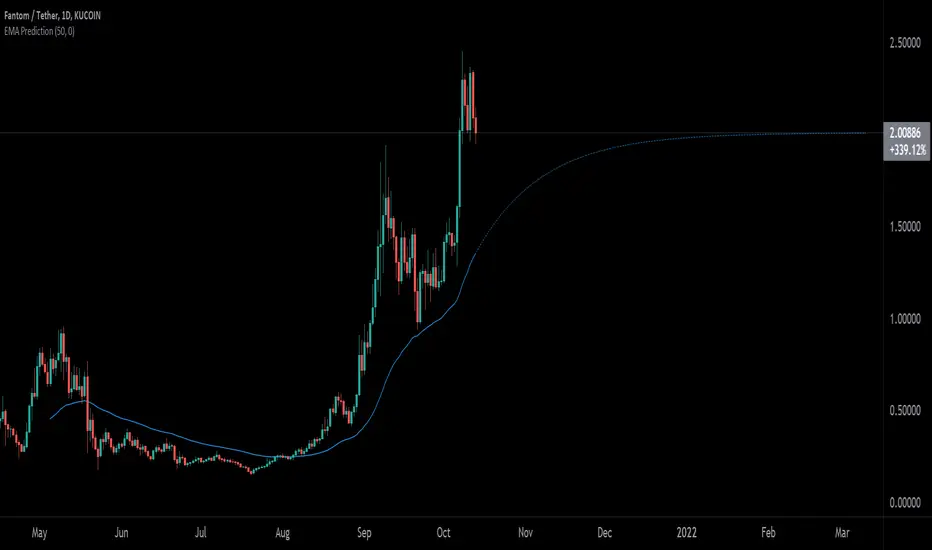
EMA PredictionThis script predicts future EMA values assuming that the price remains as configured (-50% to +50%).
Rolling EMAVWAP with Standard Deviation BandsThis is experimental code trying to implement exponentially decreasing weights over time in a simple VWAP.
Also i applied EMA rules when calculating the Standard Deviation Bands.
The script produces results from 1 candle.
There is an "log space" option to neutralize bands shifts when charting in log space - this gives the correct geometrically equal distances on both sides of the emaVWAP.

MA + VolumeAreaMade a stripped-down version of the script.
Later it will be supplemented with other functions.
In assembly:
-4 EMA
-The bull / bear area from the volume candlestick data.
In the settings, you can change the size of the array and the amount of sampled data in it.
p.s I cut all my scripts for convenient work for you. Stay tuned! Good luck.