Micro/Mini P&L [LDT]Overview
Micro/Mini P&L is a risk and P&L visualization tool built primarily for futures traders.
It provides accurate dollar-based calculations for either micros or minis, regardless of which contract type you are currently charting.
The indicator automatically detects your instrument (NQ, MNQ, ES, MES, YM, RTY, CL, GC, etc.) and adjusts point-value data accordingly, allowing you to chart one contract while evaluating risk for another.
This removes the need for manual conversions and keeps your position data consistent at all times.
Although optimized for futures, the tool also works on any other asset for general trade-level visualization.
Features
• Automatic instrument detection for major futures markets including NQ/MNQ, ES/MES, YM/MYM, RTY/M2K, CL/MCL, GC/MGC and others.
Point-value logic adjusts instantly based on the detected symbol ensuring accurate calculations without manual configuration.
• Micro/Mini display toggle, allowing you to calculate dollar values for either contract type regardless of which contract is on your chart.
Useful for traders who prefer charting minis whilst trading micros or the opposite.
• Trade-level visualization, including Entry, Take Profit and Stop Loss levels with automatically drawn lines and optional TP/SL zone shading for clear and structured display on the chart.
• Dynamic P/L calculations, showing both point-based and dollar-based metrics in real time.
This includes TP/SL dollar values, points to target/stop, real-time P/L and an optional risk-reward ratio.
• Adaptive risk table, displaying contract counts from 1 up to your selected maximum, total dollar risk for each row and highlighting your chosen contract size.
This provides a straightforward method for evaluating risk, scaling and position sizing.
• Customizable display options, including color settings, label visibility, extension length, bar offsets and table positioning.
This allows the tool to remain clean, unobtrusive and easy to integrate into any chart layout.
Purpose
This tool is designed to give futures traders a clear, consistent and reliable way to view dollar-accurate risk per contract without performing manual conversions.
Whether you trade micros or minis, the displayed values always align with your selected contract type, even when charting the opposite market.
Educational


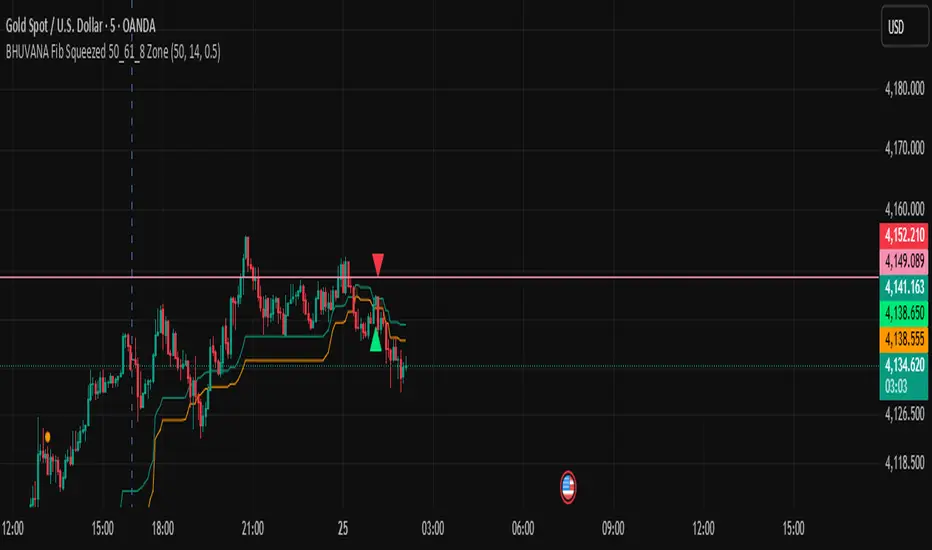
BHUVANA Fibonacci squeezed 50%–61.8% bandThis indicator is designed based on XAUUSD and in the 5 min time frame,When it looks like upstairs it is BUY trend (uptrend),Wjen it looks like downstairs the trend is sell (ie)Down trend)
Swing mapping: Finds the active high/low over a user-defined lookback and computes Fib 50% and Fib 61.8%.
Squeeze detection: Measures the distance between 50% and 61.8%. If the band width is ≤ (ATR × multiplier), the zone is flagged as a Squeeze.
Breakout entries (on close):
Long when price crosses up through 50% while squeezed.
Short when price crosses down through 61.8% while squeezed.
Risk framework: Auto-plots stop lines from the signal bar:
Long SL = swing low; Short SL = swing high.
Visuals: Fib lines (50/61.8) + optional yellow zone highlight during squeeze.

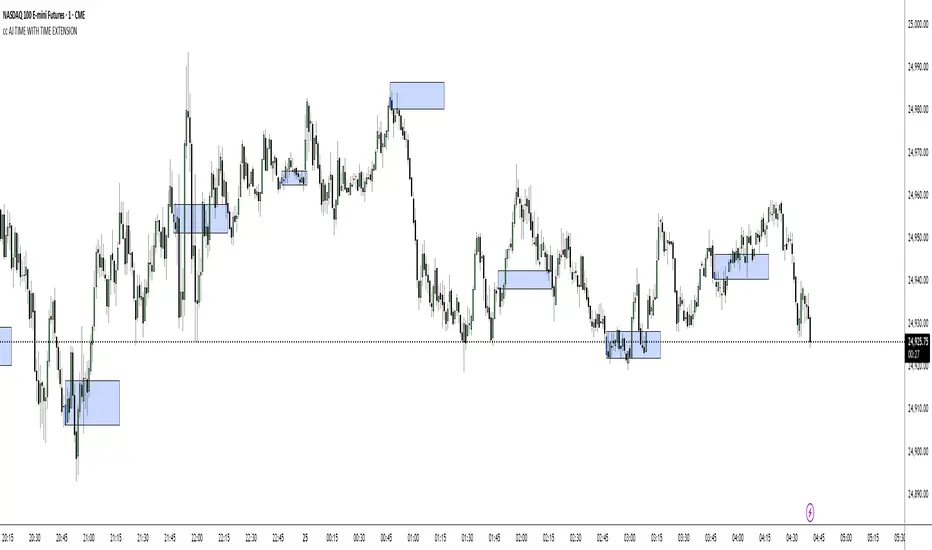
cc AJ TIME WITH TIME EXTENSIONcc AJ TIME WITH TIME EXTENSION – Flexible Session & Time-Based Highlighter (v6)
A fully customizable Pine Script® indicator that lets you highlight specific times of day using three different calculation methods and draw extended background rectangles (session boxes) forward in time.
Features:
• Up to 6 independent time rules
• Three selectable detection methods for each rule (you can combine them):
– Direct minute match (e.g. when the current minute = your target)
– Addition method (hour + minute = target value)
– Subtraction method (minute − hour = target value)
• Each rule can independently color candles (barcolor) and/or draw a price-level rectangle
• Rectangles automatically extend right for a user-defined duration (hours + minutes)
• Individual control over fill color, opacity, border color, and border thickness
• Works on any timeframe and any symbol
• Uses UTC+2 as reference timezone (common for many European/London-based sessions – change in code if needed)
Perfect for marking custom session windows, recurring intraday time windows, or any personal time-based confluences you trade.
No external data, no repainting, no hidden calculations – completely transparent and compliant with TradingView House Rules.
Educational / personal use only • Not financial advice
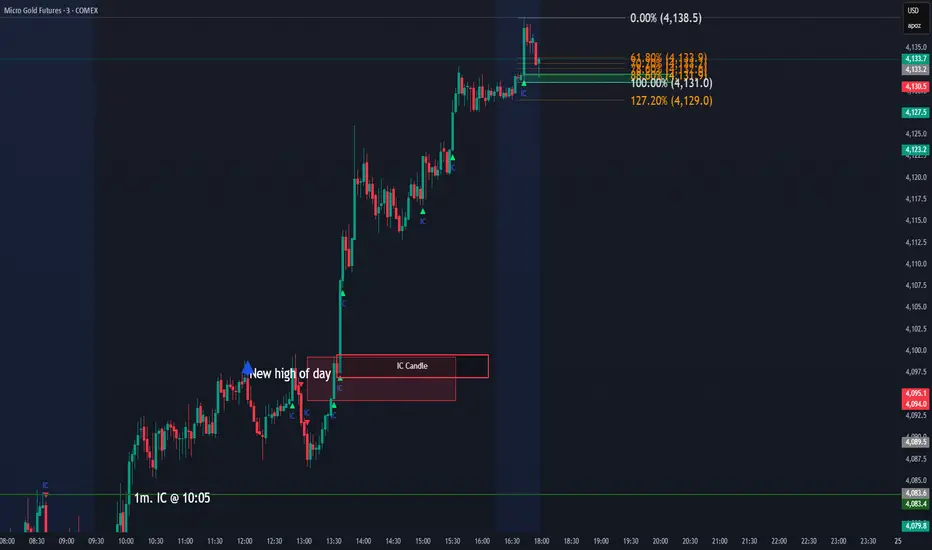
IC Opposite Candle Zones – BOXESWhat this does
✔ Detects bullish & bearish institutional candles
✔ Finds the last opposite candle before it
✔ Creates a zone using that candle’s full wick range
✔ Draws it with actual boxes that extend forward
✔ Deletes old boxes so your chart doesn’t get cluttered
Hamaada RangeThis indicator plots the Daily DR/IDR range (19:30–23:00 NY) for each weekday, Monday to Friday.
It automatically draws the Daily Range (DR) and Initial Daily Range (IDR) highs, lows, midlines, and opening price.
Each day’s DR/IDR box extends into the following session for clarity and projection.
All lines and colors are fully customizable per-day.
Tracks 3-bar swings after the DR window closes.
Automatically detects when price violates the DR high or low.
Draws a “Swing Violation Line” from the last valid swing to the end of the extension period.
Friday DR extends to next Monday and supports cross-week swing violation detection.
Background shading, labels, and opening lines are optional.
Designed for precision session modeling in NY timezone (America/New_York recommended).

Price Action - Bar CountDrawing from Al Brooks' emphasis on session rhythms in his books, this counts bars from market opens, resetting at US (0930-1600 ET), HK (0930-1200,1300-1600 HKT), or London (0800-1630 GMT) if selected. Labels every N bars (default 2) below, with custom colors per session and after-hours gray. Up to 79 in regular color, then faded. Helps track opening range tests and two-legged moves—focus on first hour dynamics for high-probability trades.

Price Action - H/L BarBased on Al Brooks' "Bar by Bar" (Chapter 09A, p.45-50) and "Trends" (p.98-105), this marks H (higher high with close above mid) and L (lower low with close below mid) swings. Marking pauses after each, resuming on pullback. Labels "H" above and "L" below bars for swing counting in trends or ranges. Key: Markets form two legs—use for measured moves or failed breakouts, always in context of prior extremes.

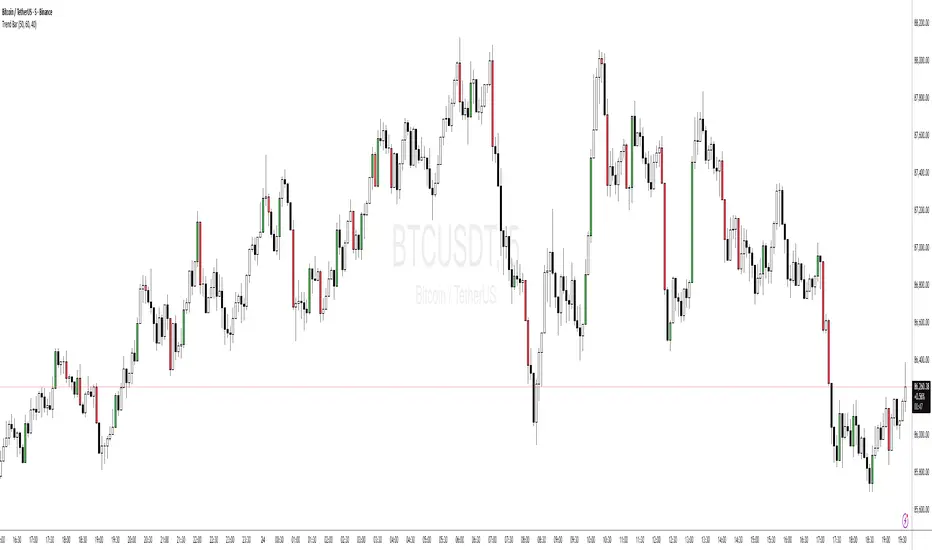
Price Action - Trend BarFrom Al Brooks' "Trading Price Action Trends," this indicator colors strong trend bars. Bull trend bars (green body ≥50%, close ≥60% up range, larger than 1.5x average) highlight buyer control, while bear trend bars (red body ≥50%, close ≤40% down range) show seller dominance. Use to identify trend resumption or climaxes. Philosophy: Trends persist until tested—focus on high-probability entries after pullbacks, avoiding barbwire noise.
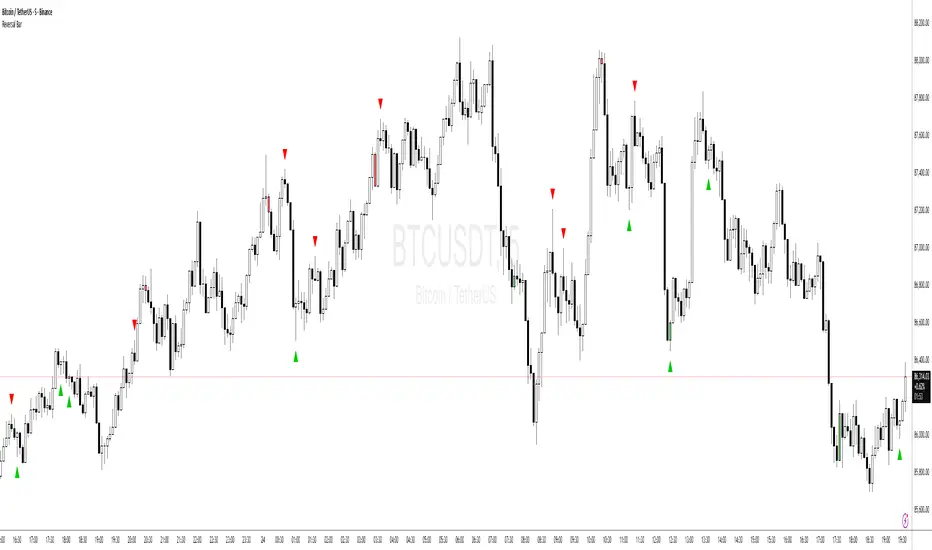
Price Action - Reversal BarInspired by Al Brooks' "Trading Price Action Reversals," this indicator detects potential bull and bear reversal bars. Bull reversals require a green bar with close above mid-range, small upper tail (≤30%), large lower tail (≥30%), and low below previous low without significant overlap. Bear reversals are the opposite. Triangles mark these setups for early reversal signals in trends or climaxes. Remember, markets test extremes—use with trend lines for confirmation, as single bars are often traps without a second leg.
Bitcoin Macro Fair Value [Structural]//@version=6
indicator("Bitcoin Macro Fair Value ", overlay=true)
// --- Model Coefficients (Derived from Python Analysis 2019-2025) ---
intercept = input.float(3.156434, "Intercept")
c_m2 = input.float(0.132827, "Real M2 Coef")
c_corp = input.float(0.742593, "Corp Spread Coef")
c_hy = input.float(-0.617968, "HY Spread Coef")
c_dxy = input.float(0.009772, "DXY Coef")
c_real30 = input.float(0.713311, "Real 30Y Coef")
c_be30 = input.float(-1.059273, "Breakeven 30Y Coef")
c_slope = input.float(0.402220, "Slope 10Y-2Y Coef")
// --- Data Fetching ---
m2 = request.security("FRED:M2SL", "M", close)
cpi = request.security("FRED:CPIAUCSL", "M", close)
real_m2 = m2 / cpi
corp = request.security("FRED:BAMLC0A0CM", "D", close)
hy = request.security("FRED:BAMLH0A0HYM2", "D", close)
dxy = request.security("TVC:DXY", "D", close)
real30 = request.security("FRED:DFII30", "D", close)
nom30 = request.security("FRED:DGS30", "D", close)
be30 = nom30 - real30
nom10 = request.security("FRED:DGS10", "D", close)
nom2 = request.security("FRED:DGS2", "D", close)
slope = nom10 - nom2
// --- Calculation ---
log_fv = intercept + (c_m2 * real_m2) + (c_corp * corp) + (c_hy * hy) + (c_dxy * dxy) + (c_real30 * real30) + (c_be30 * be30) + (c_slope * slope)
fair_value = math.exp(log_fv)
plot(fair_value, "Macro Fair Value", color=color.new(color.blue, 0), linewidth=2)


SNP420_Five_to_Five_INDIFor consistent 9-5 traders.
Use for your traidingroutine.
Change colours and time for your strategy.
Peace and love! SNP420

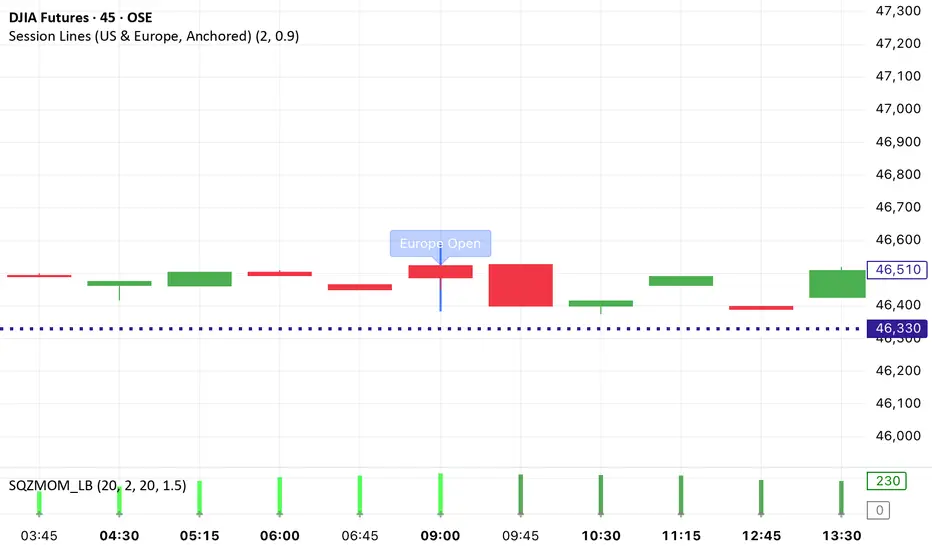
Session Lines (US & Europe, Anchored and Adaptive)A sleek indicator that marks the London (blue) and New York (red) trading sessions with perfectly aligned vertical lines both open and close times.
Lines automatically scale with your chart, adapt to any timeframe, and fade smoothly on higher intervals to keep your layout clean and professional.
Static K-means Clustering | InvestorUnknownStatic K-Means Clustering is a machine-learning-driven market regime classifier designed for traders who want a data-driven structure instead of subjective indicators or manually drawn zones.
This script performs offline (static) K-means training on your chosen historical window. Using four engineered features:
RSI (Momentum)
CCI (Price deviation / Mean reversion)
CMF (Money flow / Strength)
MACD Histogram (Trend acceleration)
It groups past market conditions into K distinct clusters (regimes). After training, every new bar is assigned to the nearest cluster via Euclidean distance in 4-dimensional standardized feature space.
This allows you to create models like:
Regime-based long/short filters
Volatility phase detectors
Trend vs. chop separation
Mean-reversion vs. breakout classification
Volume-enhanced money-flow regime shifts
Full machine-learning trading systems based solely on regimes
Note:
This script is not a universal ML strategy out of the box.
The user must engineer the feature set to match their trading style and target market.
K-means is a tool, not a ready made system, this script provides the framework.
Core Idea
K-means clustering takes raw, unlabeled market observations and attempts to discover structure by grouping similar bars together.
// STEP 1 — DATA POINTS ON A COORDINATE PLANE
// We start with raw, unlabeled data scattered in 2D space (x/y).
// At this point, nothing is grouped—these are just observations.
// K-means will try to discover structure by grouping nearby points.
//
// y ↑
// |
// 12 | •
// | •
// 10 | •
// | •
// 8 | • •
// |
// 6 | •
// |
// 4 | •
// |
// 2 |______________________________________________→ x
// 2 4 6 8 10 12 14
//
//
//
// STEP 2 — RANDOMLY PLACE INITIAL CENTROIDS
// The algorithm begins by placing K centroids at random positions.
// These centroids act as the temporary “representatives” of clusters.
// Their starting positions heavily influence the first assignment step.
//
// y ↑
// |
// 12 | •
// | •
// 10 | • C2 ×
// | •
// 8 | • •
// |
// 6 | C1 × •
// |
// 4 | •
// |
// 2 |______________________________________________→ x
// 2 4 6 8 10 12 14
//
//
//
// STEP 3 — ASSIGN POINTS TO NEAREST CENTROID
// Each point is compared to all centroids.
// Using simple Euclidean distance, each point joins the cluster
// of the centroid it is closest to.
// This creates a temporary grouping of the data.
//
// (Coloring concept shown using labels)
//
// - Points closer to C1 → Cluster 1
// - Points closer to C2 → Cluster 2
//
// y ↑
// |
// 12 | 2
// | 1
// 10 | 1 C2 ×
// | 2
// 8 | 1 2
// |
// 6 | C1 × 2
// |
// 4 | 1
// |
// 2 |______________________________________________→ x
// 2 4 6 8 10 12 14
//
// (1 = assigned to Cluster 1, 2 = assigned to Cluster 2)
// At this stage, clusters are formed purely by distance.
Your chosen historical window becomes the static training dataset , and after fitting, the centroids never change again.
This makes the model:
Predictable
Repeatable
Consistent across backtests
Fast for live use (no recalculation of centroids every bar)
Static Training Window
You select a period with:
Training Start
Training End
Only bars inside this range are used to fit the K-means model. This window defines:
the market regime examples
the statistical distributions (means/std) for each feature
how the centroids will be positioned post-trainin
Bars before training = fully transparent
Training bars = gray
Post-training bars = full colored regimes
Feature Engineering (4D Input Vector)
Every bar during training becomes a 4-dimensional point:
This combination balances: momentum, volatility, mean-reversion, trend acceleration giving the algorithm a richer "market fingerprint" per bar.
Standardization
To prevent any feature from dominating due to scale differences (e.g., CMF near zero vs CCI ±200), all features are standardized:
standardize(value, mean, std) =>
(value - mean) / std
Centroid Initialization
Centroids start at diverse coordinates using various curves:
linear
sinusoidal
sign-preserving quadratic
tanh compression
init_centroids() =>
// Spread centroids across using different shapes per feature
for c = 0 to k_clusters - 1
frac = k_clusters == 1 ? 0.0 : c / (k_clusters - 1.0) // 0 → 1
v = frac * 2 - 1 // -1 → +1
array.set(cent_rsi, c, v) // linear
array.set(cent_cci, c, math.sin(v)) // sinusoidal
array.set(cent_cmf, c, v * v * (v < 0 ? -1 : 1)) // quadratic sign-preserving
array.set(cent_mac, c, tanh(v)) // compressed
This makes initial cluster spread “random” even though true randomness is hardly achieved in pinescript.
K-Means Iterative Refinement
The algorithm repeats these steps:
(A) Assignment Step, Each bar is assigned to the nearest centroid via Euclidean distance in 4D:
distance = sqrt(dx² + dy² + dz² + dw²)
(B) Update Step, Centroids update to the mean of points assigned to them. This repeats iterations times (configurable).
LIVE REGIME CLASSIFICATION
After training, each new bar is:
Standardized using the training mean/std
Compared to all centroids
Assigned to the nearest cluster
Bar color updates based on cluster
No re-training occurs. This ensures:
No lookahead bias
Clean historical testing
Stable regimes over time
CLUSTER BEHAVIOR & TRADING LOGIC
Clusters (0, 1, 2, 3…) hold no inherent meaning. The user defines what each cluster does.
Example of custom actions:
Cluster 0 → Cash
Cluster 1 → Long
Cluster 2 → Short
Cluster 3+ → Cash (noise regime)
This flexibility means:
One trader might have cluster 0 as consolidation.
Another might repurpose it as a breakout-loading zone.
A third might ignore 3 clusters entirely.
Example on ETHUSD
Important Note:
Any change of parameters or chart timeframe or ticker can cause the “order” of clusters to change
The script does NOT assume any cluster equals any actionable bias, user decides.
PERFORMANCE METRICS & ROC TABLE
The indicator computes average 1-bar ROC for each cluster in:
Training set
Test (live) set
This helps measure:
Cluster profitability consistency
Regime forward predictability
Whether a regime is noise, trend, or reversion-biased
EQUITY SIMULATION & FEES
Designed for close-to-close realistic backtesting.
Position = cluster of previous bar
Fees applied only on regime switches. Meaning:
Staying long → no fee
Switching long→short → fee applied
Switching any→cash → fee applied
Fee input is percentage, but script already converts internally.
Disclaimers
⚠️ This indicator uses machine-learning but does not predict the future. It classifies similarity to past regimes, nothing more.
⚠️ Backtest results are not indicative of future performance.
⚠️ Clusters have no inherent “bullish” or “bearish” meaning. You must interpret them based on your testing and your own feature engineering.

[CASH] Crypto And Stocks Helper (MultiPack w. Alerts)ATTENTION! I'm not a good scripter. I have just learned a little basics for this project, stolen code from other public scripts and modified it, and gotten help from AI LLM's.
If you want recognition from stolen code please tell me to give you the credit you deserve.
The script is not completely finished yet and contains alot of errors but my friends and family wants access so I made it public.
_________________________________________________________________________________
CASH has multiple indicators (a true all-in-one multipack), guides and alerts to help you make better trades/investments. It has:
- Bitcoin Bull Market Support Band
- Dollar Volume
- 5 SMA and 5 EMA
- HODL Trend (a.k.a SuperTrend) indicator
- RSI, Volume and Divergence indicators w. alerts
More to come as well, like Backburner and a POC line from Volume Profile.
Everything is fully customizable, appearance and off/on etc.
More information and explainations along with my guides you can find in settings under "Input" and "Style".

🔥 SMC Reversal Engine v3.5 – Clean FVG + DashboardSMC Reversal Engine v3.5 – Clean FVG + Dashboard
The SMC Reversal Engine is a precision-built Smart Money Concepts tool designed to help traders understand market structure the single most important foundation in reading price action. It reveals how institutions move liquidity, where structure shifts occur, and how Fair Value Gaps (FVGs) align with these changes to signal potential reversals or continuations.
Understanding How It Works
At its core, the script detects CHoCH (Change of Character) and BOS (Break of Structure)—the two key turning points in institutional order flow. A CHoCH shows that the market has reversed intent (for example, from bearish to bullish), while a BOS confirms a continuation of the current trend. Together, they form the backbone of structure-based trading.
To refine this logic, the engine uses fractal pivots clusters of candles that confirm swing highs and lows. Fractals filter out noise, identifying points where price truly changes direction. The script lets you set this sensitivity manually or automatically adapts it depending on the timeframe. Lower fractal sensitivity captures smaller intraday swings for scalpers, while higher sensitivity locks onto major swing structures for swing and position traders.
The dashboard gives you a real-time reading of the trend, the last high and low, and what the market is likely to do next—for example, “Expect HL” or “Wait for LH.” It even tracks the accuracy of these structure predictions over time, giving an educational feedback loop to help you learn price behavior.
Fair Value Gaps and Tap Entries
Fair Value Gaps (FVGs) mark moments when price moves too quickly, leaving inefficiencies that institutions often revisit. When price taps into an FVG, it often acts as a high-probability entry zone for reversals or continuations. The script automatically detects, extends, and deletes old FVGs, keeping only relevant zones visible for a clean chart.
Traders can enable markTapEntry to visually confirm when an FVG gets filled. This is a simple but powerful trigger that often aligns with CHoCH or BOS moments.
Recommended Settings for Different Traders
For Scalpers, use a lower HTF structure such as 1 minute or 5 minutes. Keep Auto Fractals on for faster reaction, and limit FVG zones to 2–3. This gives you a clean, real-time reflection of order flow.
For Intraday Traders, 15-minute to 1-hour structure gives the perfect balance between reactivity and stability. Fractal sensitivity around 3–5 captures the most actionable levels without excessive noise.
For Swing Traders, use 4-hour, 1-day, or even 3-day structure. The chart becomes smoother, showing higher-order CHoCH and BOS that define true institutional transitions. Combine this with EMA confirmation for higher conviction.
For Position or Macro Traders, select Weekly or Monthly structure. The dynamic label system expands automatically to keep more historical BOS/CHoCH points visible, allowing you to see long-term shifts clearly.
Educational Value
This indicator is built to teach traders how to see structure the way professionals and smart money do. You’ll learn to recognize how markets transition from one phase to another from accumulation to manipulation to expansion. Each CHoCH or BOS helps you decode where liquidity is being taken and where new intent begins.
The included SMC Quick Guide explains each structural cue right on your chart. Within days of using it, you’ll start noticing patterns that reveal how price really moves, instead of guessing based on indicators.
Settings and How to Use Them
Everything in the SMC Reversal Engine is designed to adapt to your trading style and help you read structure like a professional.
When you open the Inputs Panel, you’ll see sections like Fractal Settings, FVG Settings, Buy/Sell Confirmation, and Educational Tools.
Under Fractal Settings, you can choose the higher timeframe (HTF) that defines structure—from minutes to weeks. The Auto Fractal Sensitivity option automatically adjusts how tight or wide swing points are detected. Lower sensitivity captures short-term fluctuations (great for scalpers), while higher values filter noise and isolate major swing highs and lows (perfect for swing traders).
The Fair Value Gap (FVG) options manage imbalance zones—the footprints of institutional orders. You can show or hide these zones, extend them into the future, and control how long they remain before auto-deletion. The Mark Entry When FVG is Tapped option places a small label when price revisits the gap—a potential entry signal that aligns with smart money logic.
EMA Confirmation adds a layer of confluence. The script can automatically scale EMA lengths based on timeframe, or you can input your preferred values (for example, 9/21 for intraday, 50/200 for swing). Require EMA Crossover Confirmation helps filter false moves, keeping you trading only with aligned momentum.
The Educational section gives traders visual reinforcement. When enabled, you’ll see tags like HH (Higher High), HL (Higher Low), LH (Lower High), and LL (Lower Low). These show structure shifts in real time, helping you learn visually what market structure really means. The Cheat Sheet panel summarizes each term, always visible in the corner for quick reference.
Early Top Warnings use wick size and RSI divergence to signal when price may be overextended—a useful heads-up before potential CHoCH formations.
Finally, the Narrative and Accuracy System translates structure into simple English—messages like Trend Bullish → Wait for HL or BOS Bearish → Expect LL. Over time, you can monitor how accurate these expectations have been, training your pattern recognition and confidence.
Pro Tips for Getting the Most Out of the SMC Reversal Engine
1. Start on Higher Timeframes First: Begin on the 4H or Daily chart where structure is cleaner and signals have more weight. Then scale down for entries once you grasp directional intent.
2. Use FVGs for Context, Not Just Entries: Observe how price behaves around unfilled FVGs—they often act as magnets or barriers, offering insight into where liquidity lies.
3. Combine With HTF Bias: Always trade in the direction of your higher timeframe trend. A bullish weekly BOS means lower timeframes should ideally align bullishly for optimal setups.
4. Clean Charts = Clear Mind: Use Minimal Mode when focusing on price action, then toggle the educational tools back on to review structure for learning.
5. Don’t Chase Every CHoCH or BOS: Focus on significant breaks that align with broader context and liquidity sweeps, not minor fluctuations.
6. Accuracy Rate Is a Feedback Tool: Use the accuracy stat as a reflection of consistency—not a trade trigger.
7. Build Narrative Awareness: Read the on-chart narrative messages to reinforce structured thinking and stay disciplined.
8. Practice Replay Mode: Step through past structures to visually connect CHoCH, BOS, and FVG behavior. It’s one of the best ways to train pattern recognition.
Summary
* Detects CHoCH and BOS automatically with fractal precision
* Identifies and manages Fair Value Gaps (FVGs) in real time
* Displays a smart dashboard with accuracy tracking
* Adapts label visibility dynamically by timeframe
* Perfect for both learning and trading with institutional clarity
This tool isn’t about predicting the market—it’s about understanding it. Once you can read structure, everything else in trading becomes secondary.


MAGIC MA BANDSMagic MA Bands — Dynamic Trend Zones Instead of Lines
Magic MA Bands help traders visualize dynamic support and resistance zones rather than relying on a single moving average line. Instead of treating the MA as an exact reaction level, this tool creates a band or zone where price is statistically more likely to react, reverse, or continue trending.
🧠 How It Works
The script plots:
Upper Band (default: 50 EMA using High values)
Lower Band (default: 50 EMA using Low values)
Optional Midline MA (default: 200 SMA for long-term trend)
The area between the upper and lower bands becomes a trend cushion, helping traders identify:
Dynamic support/resistance zones
Trend strength and continuation probability
Ideal pullback entry regions
🎯 Trend Interpretation Guide
Use Case Recommended Setting
Short-Term Trend 20/21 EMA or SMA
Medium-Term Trend 50 EMA / SMA
Long-Term Trend 200 SMA / EMA (Midline Optional)
All parameters are fully customisable so the user can define their preferred structure based on their trading style, asset volatility, or timeframe.
✔️ Best For:
Trend traders
Swing trading
Pullback-based entries
Institutional-style zone analysis

Trader Dogout
“Trader Dogout — Official team template.
Combines EMA20, EMA200, and optimized volume for a clear read of trend, momentum, and decision zones.
Designed for traders who operate with precision, simplicity, and zero distractions.
Perfect for both day trading and swing trading.”

ICT Macro Slot Algo Event📊 Overview
A powerful multi-timeframe trading indicator that combines Institutional Macro Session Tracking identify optimal trading windows throughout the day. This tool helps traders align with institutional flow patterns and algorithmic activity across major sessions.
🎯 Key Features
1. Macro Algo Event Sessions
Tracks 6 key institutional time windows during NY Session:
NY Sweep (08:50-09:10) - Opening balance flows
Silver Bullet #1 (09:50-10:10) - First major macro move
Silver Bullet #2 (10:50-11:10) - Second chance/retest opportunity
Lunch Macro (11:50-12:10) - Mid-day repositioning
Post-Lunch Rebalance (13:10-13:40) - Post-lunch adjustments
NY Closing Macros (15:15-15:45) - End-of-day flows

ICT Macro Slot Algo Event📊 Overview
A powerful multi-timeframe trading indicator that combines Institutional Macro Session Tracking to identify optimal trading windows throughout the day. This tool helps traders align with institutional flow patterns and algorithmic activity across major sessions.
🎯 Key Features
1. Macro Algo Event Sessions
Tracks 6 key institutional time windows during NY Session:
NY Sweep (08:50-09:10) - Opening balance flows
Silver Bullet #1 (09:50-10:10) - First major macro move
Silver Bullet #2 (10:50-11:10) - Second chance/retest opportunity
Lunch Macro (11:50-12:10) - Mid-day repositioning
Post-Lunch Rebalance (13:10-13:40) - Post-lunch adjustments
NY Closing Macros (15:15-15:45) - End-of-day flows
